d3
Bring data to life with SVG, Canvas and HTML. :bar_chart::chart_with_upwards_trend::tada:
- 114k
- Shell
- ISC
- 3 wk ago
Bring data to life with SVG, Canvas and HTML. :bar_chart::chart_with_upwards_trend::tada:
🏆 A ranked list of awesome machine learning Python libraries. Updated weekly.
AnyChart is a lightweight and robust JavaScript charting solution with great API and documentation. The chart types and unique features are numerous, the library works easily with any development stack.
12 weeks, 26 lessons, 52 quizzes, classic Machine Learning for all
Full-stack observability · Metrics · Logs · Traces · Flows · Topology · Infrastructure · APM · NPM · DBM · RUM · Synthetics · Cloud · AI SRE · OpenTelemetry · SNMP · NetFlow/IPFIX/sFlow · IPMI · Redfish · 2000+ integrations
📊 Re-usable, easy interface JavaScript chart library based on D3.js, with SVG and Canvas rendering support
The 30 Days of Python programming challenge is a step-by-step guide to learn the Python programming language in 30 days. This challenge may take more than 100 days. Follow your own pace. These videos may help too: https://www.youtube.com/channel/UC7PNRuno1rzYPb1xLa4yktw
The open and composable observability and data visualization platform. Visualize metrics, logs, and traces from multiple sources like Prometheus, Loki, Elasticsearch, InfluxDB, Postgres and many more.
70 free charts in plain HTML, CSS and vanilla JavaScript. No library. Bar, line, pie, Sankey, heatmap, Gantt and more, each with a live demo and one file to download.
Apache Superset is a Data Visualization and Data Exploration Platform
| Name | Stars | License | Language | Last change | In common | Compare |
|---|---|---|---|---|---|---|
| ABTSoftware/SciChart.JS.Examples | 116 | MIT | TypeScript | 2 d ago | ||
| d3/d3 | 114k | ISC | Shell | 3 wk ago | data-visualization | Compare |
| lukasmasuch/best-of-ml-python | 24k | CC-BY-SA-4.0 | Unknown | 3 d ago | data-visualization, data-visualizations | Compare |
| AnyChart/AnyChart | 395 | None declared | JavaScript | 8 mo ago | data-visualization, javascript-charts, javascript-library | Compare |
| microsoft/ML-For-Beginners | 92k | MIT | Jupyter Notebook | 2 wk ago | Same need | Compare |
| netdata/netdata | 82k | GPL-3.0 | Go | 10 h ago | data-visualization | Compare |
| AOSSIE-Org/OrgExplorer | 53 | None declared | JavaScript | 4 wk ago | data-visualization, data-visualization-dashboard, data-visualizations | Compare |
| naver/billboard.js | 6k | MIT | TypeScript | 4 d ago | data-visualizations | Compare |
| Asabeneh/30-Days-Of-Python | 79k | None declared | Python | 8 wk ago | Same need | Compare |
| grafana/grafana | 78k | AGPL-3.0 | TypeScript | 2 h ago | data-visualization | Compare |
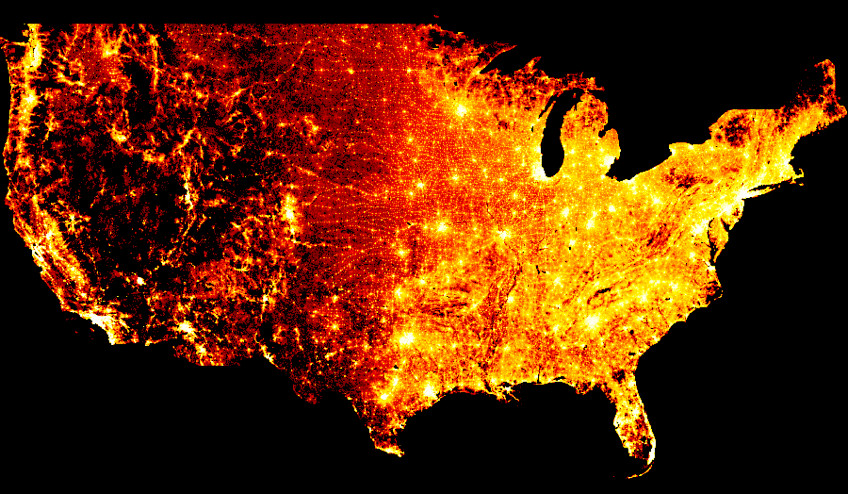
| holoviz/datashader | 3.6k | BSD-3-Clause | Python | 6 d ago | data-visualizations | Compare |
| mmrahmanbappi/70-free-data-charts | 1 | MIT | HTML | 2 mo ago | data-visualization, javascript-charts | Compare |
| apache/superset | 76k | Apache-2.0 | Python | 2 h ago | data-visualization | Compare |