ML-For-Beginners
12 weeks, 26 lessons, 52 quizzes, classic Machine Learning for all
- 92k
- Jupyter Notebook
- MIT
- 2 wk ago
12 weeks, 26 lessons, 52 quizzes, classic Machine Learning for all
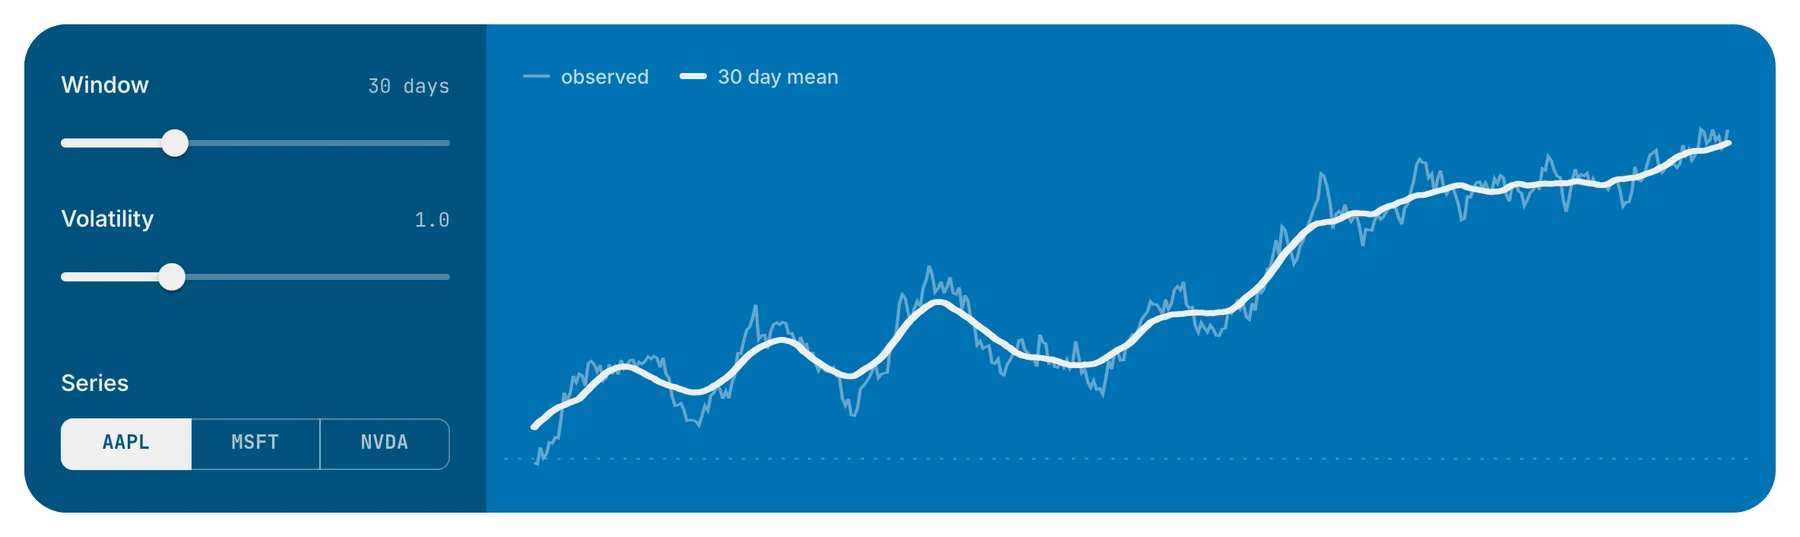
Bring data to life with SVG, Canvas and HTML. :bar_chart::chart_with_upwards_trend::tada:
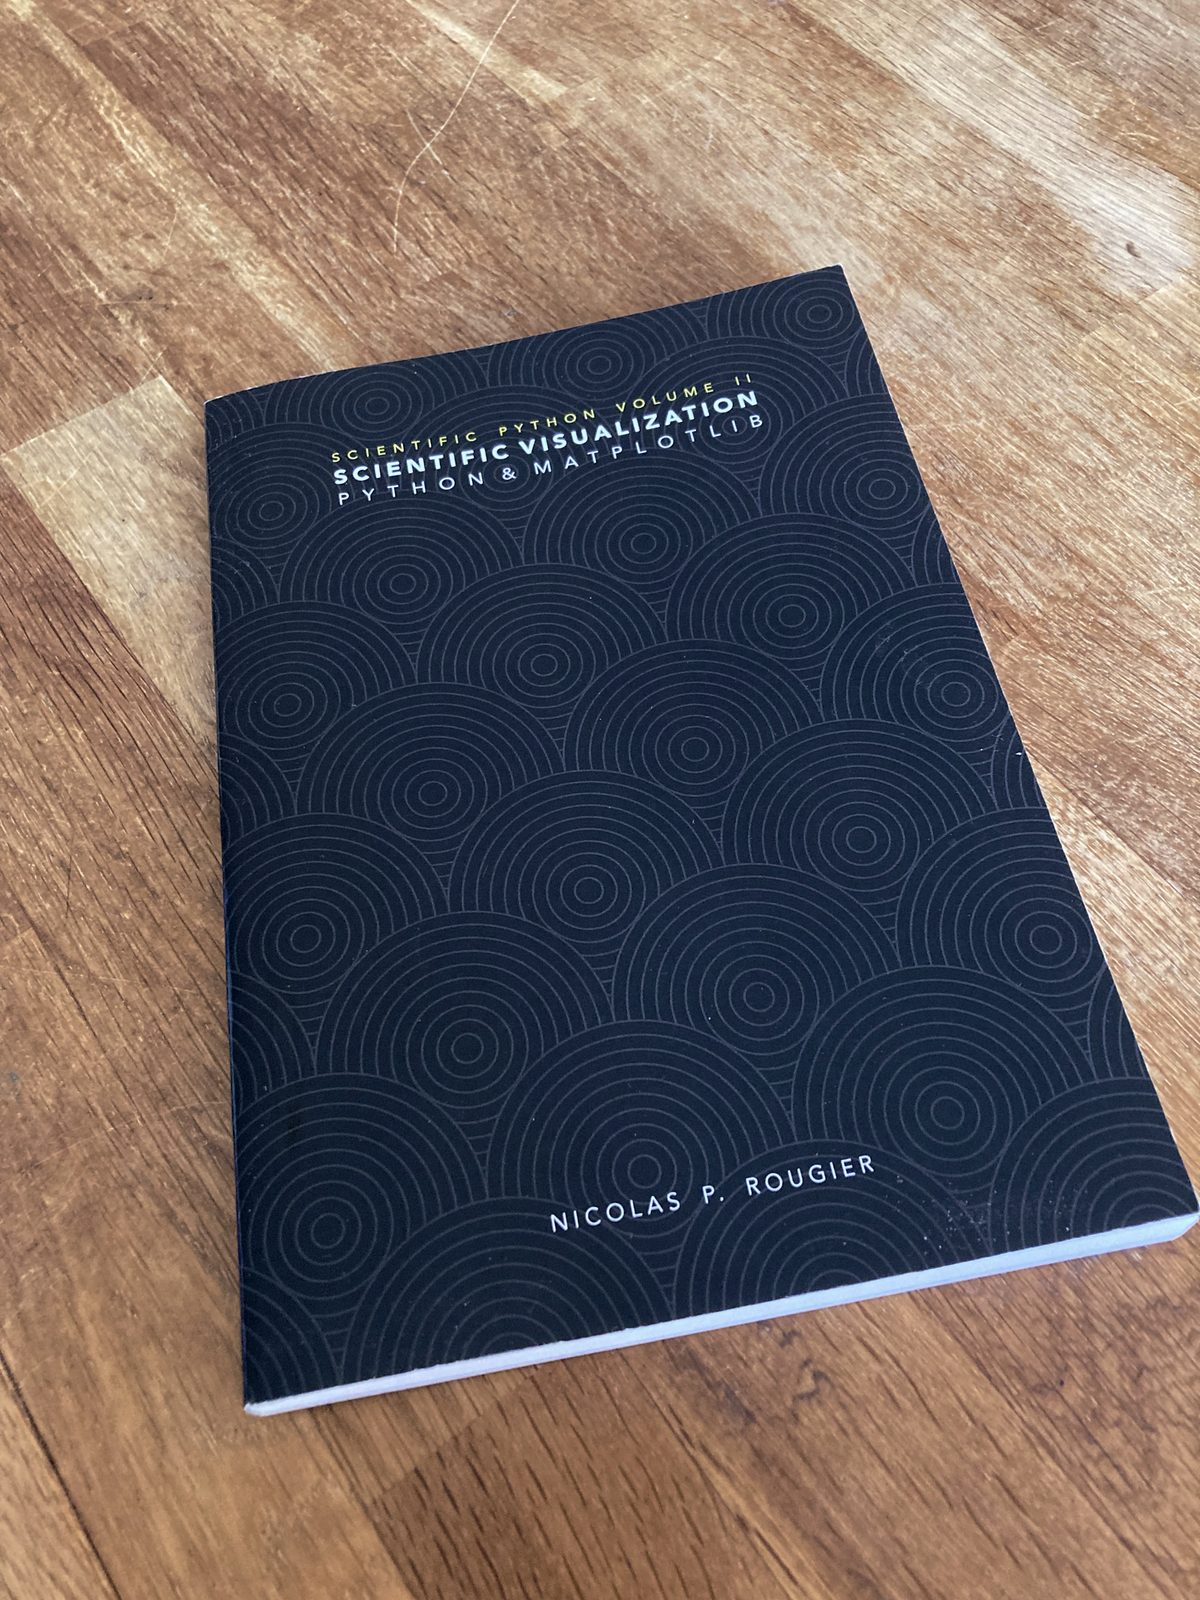
An open access book on scientific visualization using python and matplotlib
The 30 Days of Python programming challenge is a step-by-step guide to learn the Python programming language in 30 days. This challenge may take more than 100 days. Follow your own pace. These videos may help too: https://www.youtube.com/channel/UC7PNRuno1rzYPb1xLa4yktw
Full-stack observability · Metrics · Logs · Traces · Flows · Topology · Infrastructure · APM · NPM · DBM · RUM · Synthetics · Cloud · AI SRE · OpenTelemetry · SNMP · NetFlow/IPFIX/sFlow · IPMI · Redfish · 2000+ integrations
A golang framework helps gopher to build a data visualization and admin panel in ten minutes
Apache Superset is a Data Visualization and Data Exploration Platform
The open and composable observability and data visualization platform. Visualize metrics, logs, and traces from multiple sources like Prometheus, Loki, Elasticsearch, InfluxDB, Postgres and many more.
Panel: The powerful data exploration & web app framework for Python
A curated list of awesome data visualization libraries and resources.
| Name | Stars | License | Language | Last change | In common | Compare |
|---|---|---|---|---|---|---|
| LSYS/forestplot | 141 | MIT | Jupyter Notebook | 2 y ago | ||
| microsoft/ML-For-Beginners | 92k | MIT | Jupyter Notebook | 2 wk ago | data-science | Compare |
| d3/d3 | 114k | ISC | Shell | 2 wk ago | data-visualization, visualization | Compare |
| rougier/scientific-visualization-book | 12k | None declared | Python | 11 mo ago | dataviz, matplotlib | Compare |
| Asabeneh/30-Days-Of-Python | 79k | None declared | Python | 7 wk ago | data-science, matplotlib | Compare |
| netdata/netdata | 82k | GPL-3.0 | Go | 7 h ago | data-visualization | Compare |
| GoAdminGroup/go-admin | 9k | Apache-2.0 | Go | 17 mo ago | dataviz | Compare |
| apache/superset | 76k | Apache-2.0 | Python | 7 h ago | data-science, data-visualization | Compare |
| grafana/grafana | 78k | AGPL-3.0 | TypeScript | 3 h ago | data-visualization | Compare |
| holoviz/panel | 5.8k | BSD-3-Clause | Python | 2 d ago | dataviz, matplotlib | Compare |
| scikit-learn/scikit-learn | 68k | BSD-3-Clause | Python | 8 h ago | data-science | Compare |
| hal9ai/awesome-dataviz | 4.5k | None declared | JavaScript | 9 d ago | data-visualization, dataviz, visualization | Compare |
| keras-team/keras | 64k | Apache-2.0 | Python | 22 h ago | data-science | Compare |