d3
Bring data to life with SVG, Canvas and HTML. :bar_chart::chart_with_upwards_trend::tada:
- 114k
- Shell
- ISC
- 3 wk ago
Bring data to life with SVG, Canvas and HTML. :bar_chart::chart_with_upwards_trend::tada:
The 30 Days of Python programming challenge is a step-by-step guide to learn the Python programming language in 30 days. This challenge may take more than 100 days. Follow your own pace. These videos may help too: https://www.youtube.com/channel/UC7PNRuno1rzYPb1xLa4yktw
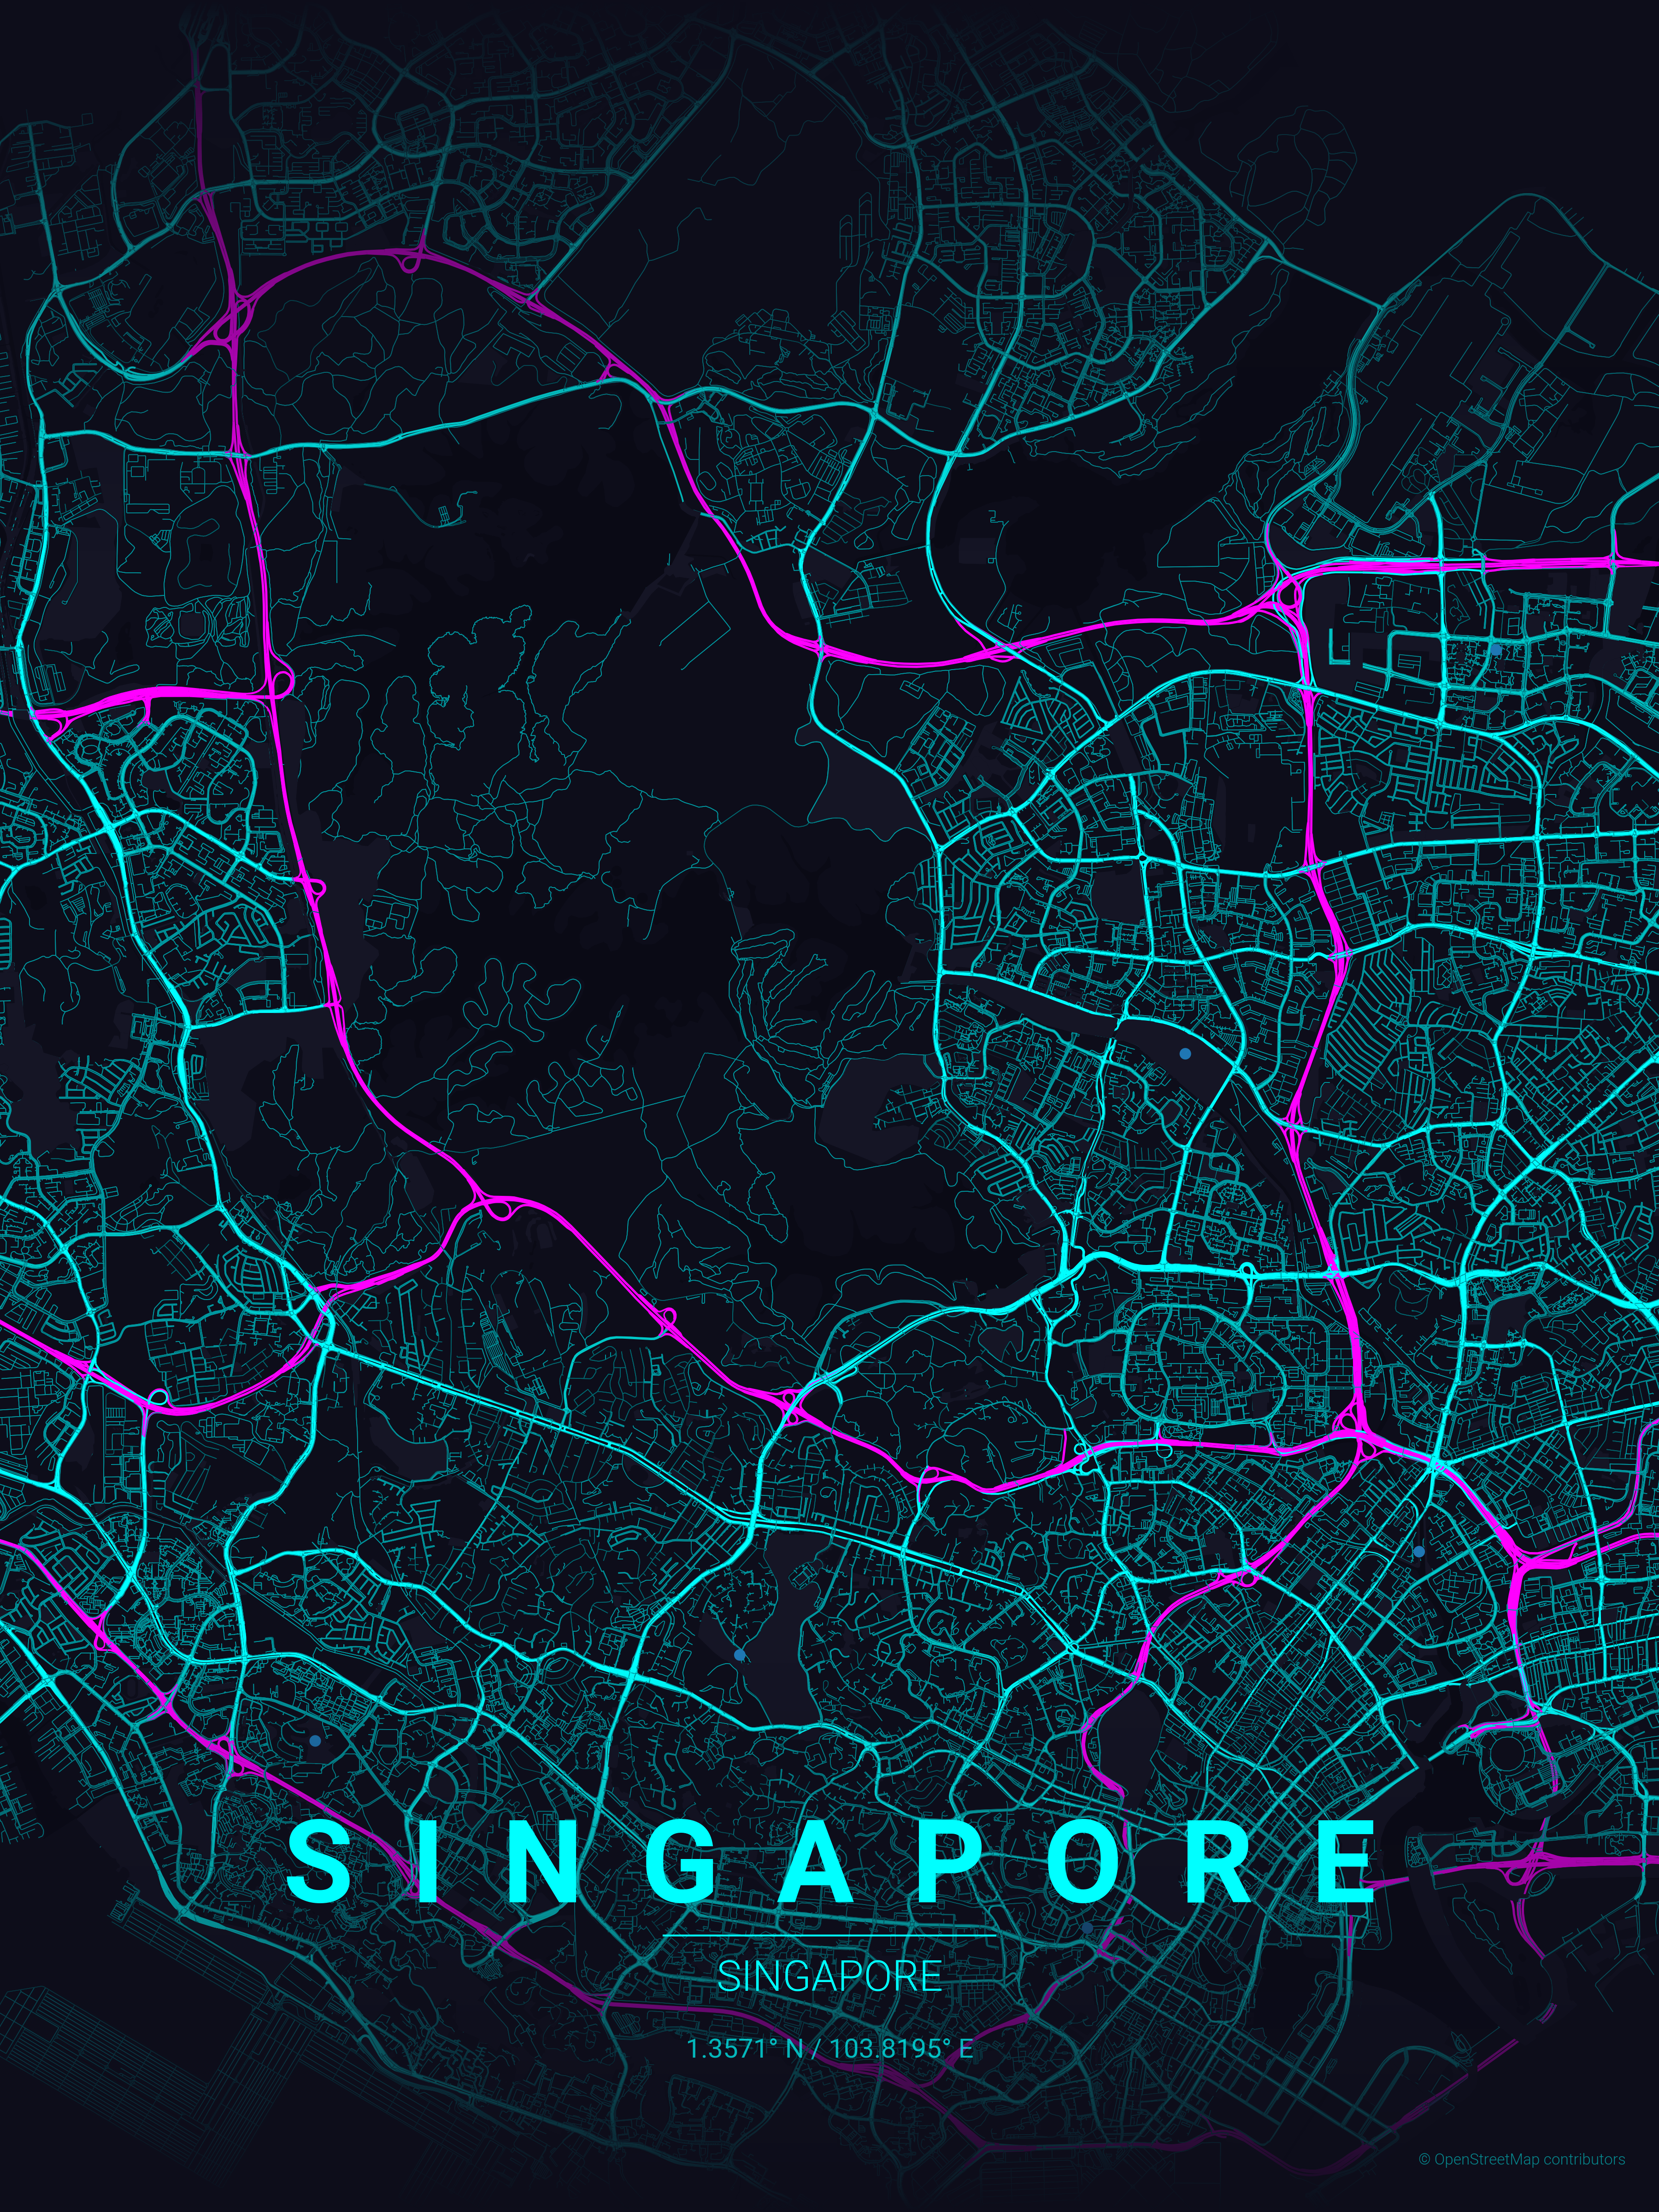
Transform your favorite cities into beautiful, minimalist designs. MapToPoster lets you create and export visually striking map posters with code.
12 weeks, 26 lessons, 52 quizzes, classic Machine Learning for all
Full-stack observability · Metrics · Logs · Traces · Flows · Topology · Infrastructure · APM · NPM · DBM · RUM · Synthetics · Cloud · AI SRE · OpenTelemetry · SNMP · NetFlow/IPFIX/sFlow · IPMI · Redfish · 2000+ integrations
Python Data Science Handbook: full text in Jupyter Notebooks
Matplotlib is an amazing visualization library in Python for 2D plots of arrays. Matplotlib is a multi-platform data visualization library built on NumPy arrays and designed to work with the broader SciPy stack. It was introduced by John Hunter in the year 2002. One of the greatest benefits of visualization is that it allows us visual access to huge amounts of data in easily digestible visuals. Ma
The open and composable observability and data visualization platform. Visualize metrics, logs, and traces from multiple sources like Prometheus, Loki, Elasticsearch, InfluxDB, Postgres and many more.
MIT Deep Learning Book in PDF format (complete and parts) by Ian Goodfellow, Yoshua Bengio and Aaron Courville
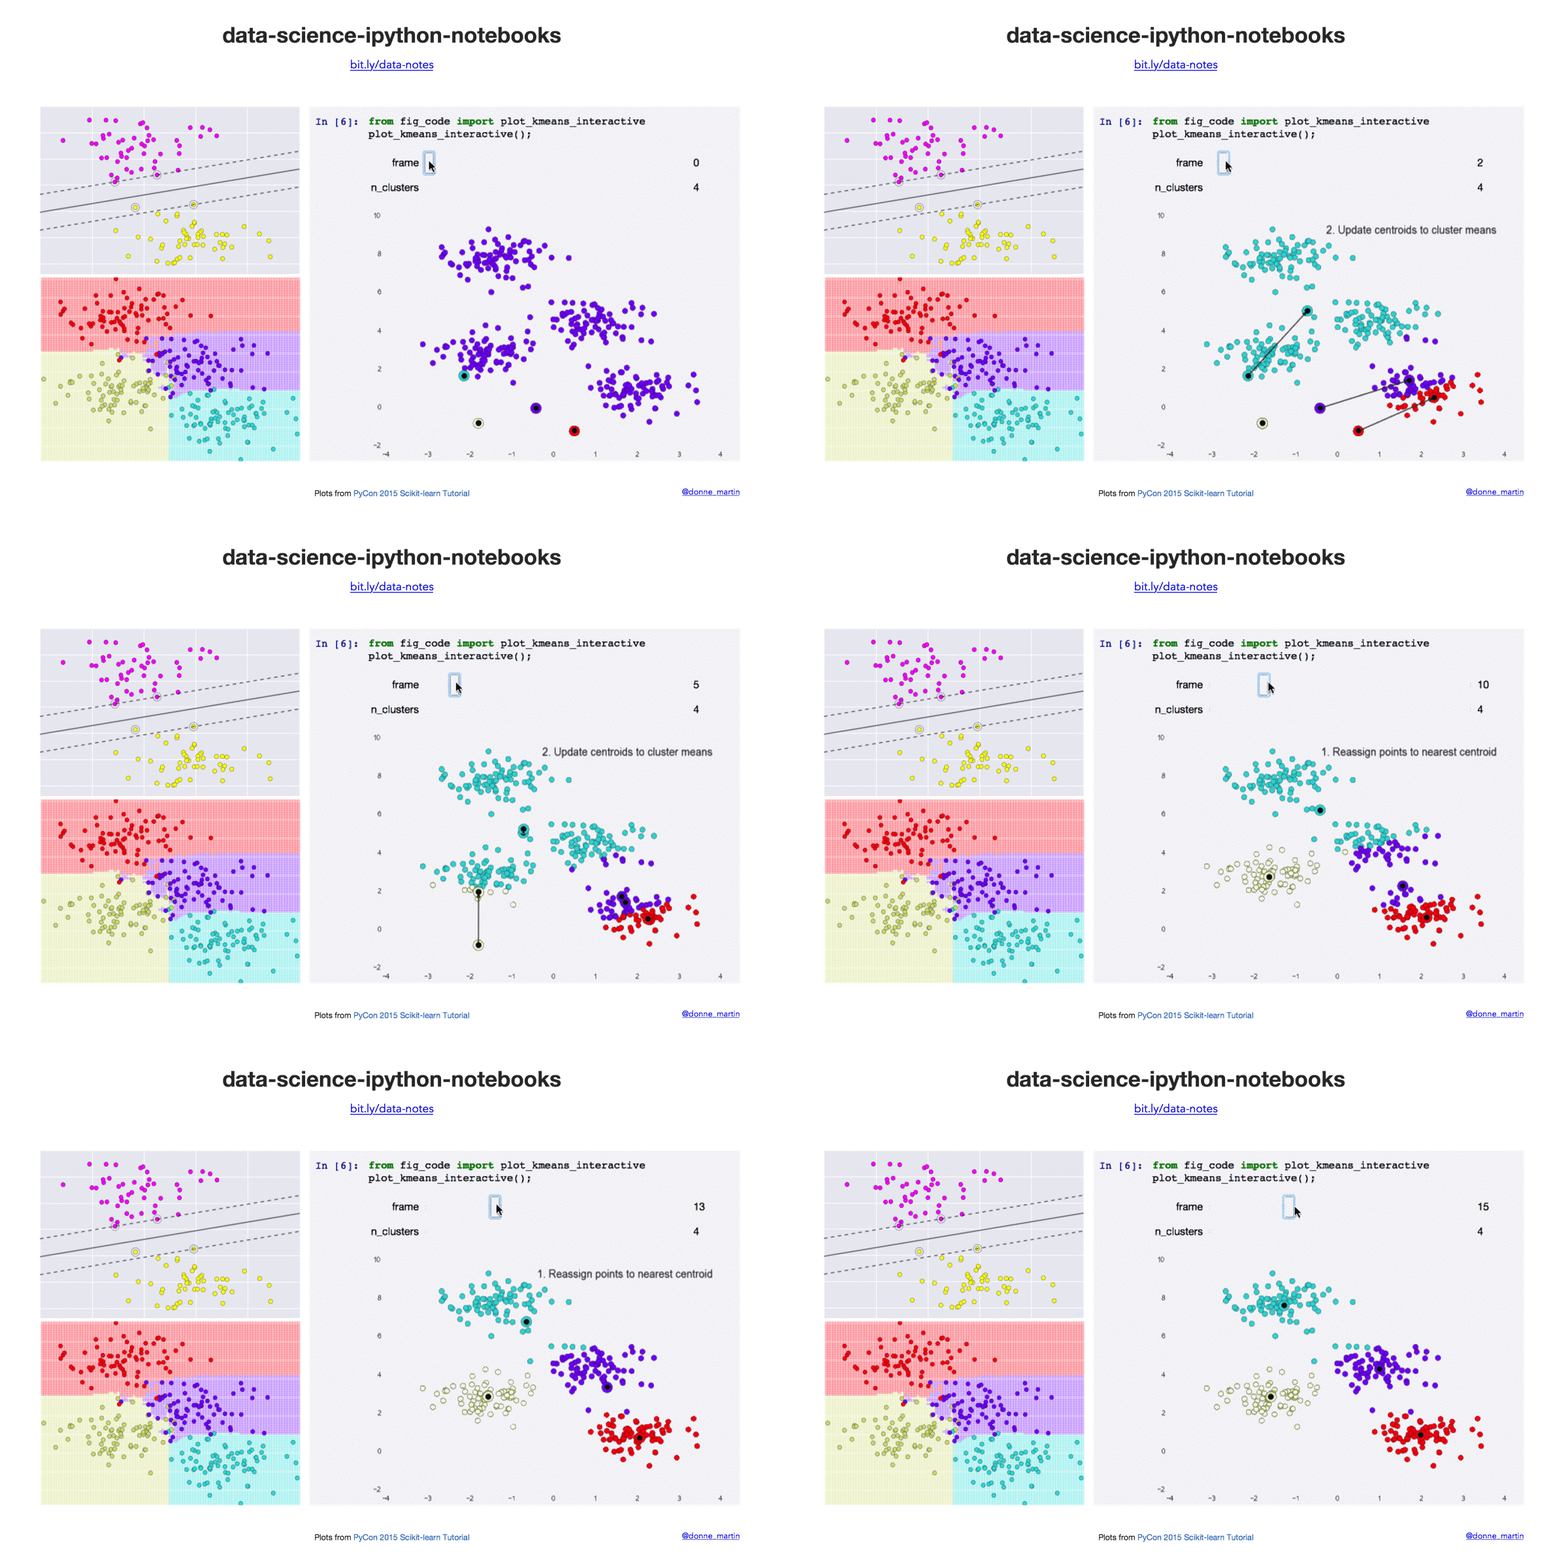
Data science Python notebooks: Deep learning (TensorFlow, Theano, Caffe, Keras), scikit-learn, Kaggle, big data (Spark, Hadoop MapReduce, HDFS), matplotlib, pandas, NumPy, SciPy, Python essentials, AWS, and various command lines.
| Name | Stars | License | Language | Last change | In common | Compare |
|---|---|---|---|---|---|---|
| kmario23/Introduction-to-NumPy-Matplotlib-TensorFlow | 23 | None declared | Jupyter Notebook | 8 y ago | ||
| d3/d3 | 114k | ISC | Shell | 3 wk ago | data-visualization | Compare |
| Avik-Jain/100-Days-Of-ML-Code | 52k | MIT | Unknown | 3 y ago | linear-algebra | Compare |
| Asabeneh/30-Days-Of-Python | 79k | None declared | Python | 7 wk ago | matplotlib, numpy | Compare |
| originalankur/maptoposter | 14k | MIT | Python | 4 mo ago | matplotlib-pyplot | Compare |
| microsoft/ML-For-Beginners | 92k | MIT | Jupyter Notebook | 2 wk ago | Same need | Compare |
| netdata/netdata | 82k | GPL-3.0 | Go | 7 h ago | data-visualization | Compare |
| williamfiset/algorithms | 19k | MIT | Java | 12 d ago | linear-algebra | Compare |
| jakevdp/PythonDataScienceHandbook | 50k | MIT | Jupyter Notebook | 2 y ago | matplotlib, numpy | Compare |
| milaan9/11_Python_Matplotlib_Module | 228 | MIT | Jupyter Notebook | 4 y ago | data-visualization, matplotlib, matplotlib-pyplot | Compare |
| grafana/grafana | 78k | AGPL-3.0 | TypeScript | 4 h ago | data-visualization | Compare |
| janishar/mit-deep-learning-book-pdf | 14k | None declared | Java | 10 mo ago | linear-algebra | Compare |
| donnemartin/data-science-ipython-notebooks | 29k | None declared | Python | 3 y ago | matplotlib, numpy | Compare |