Alternatives to plotters-rs/plotters

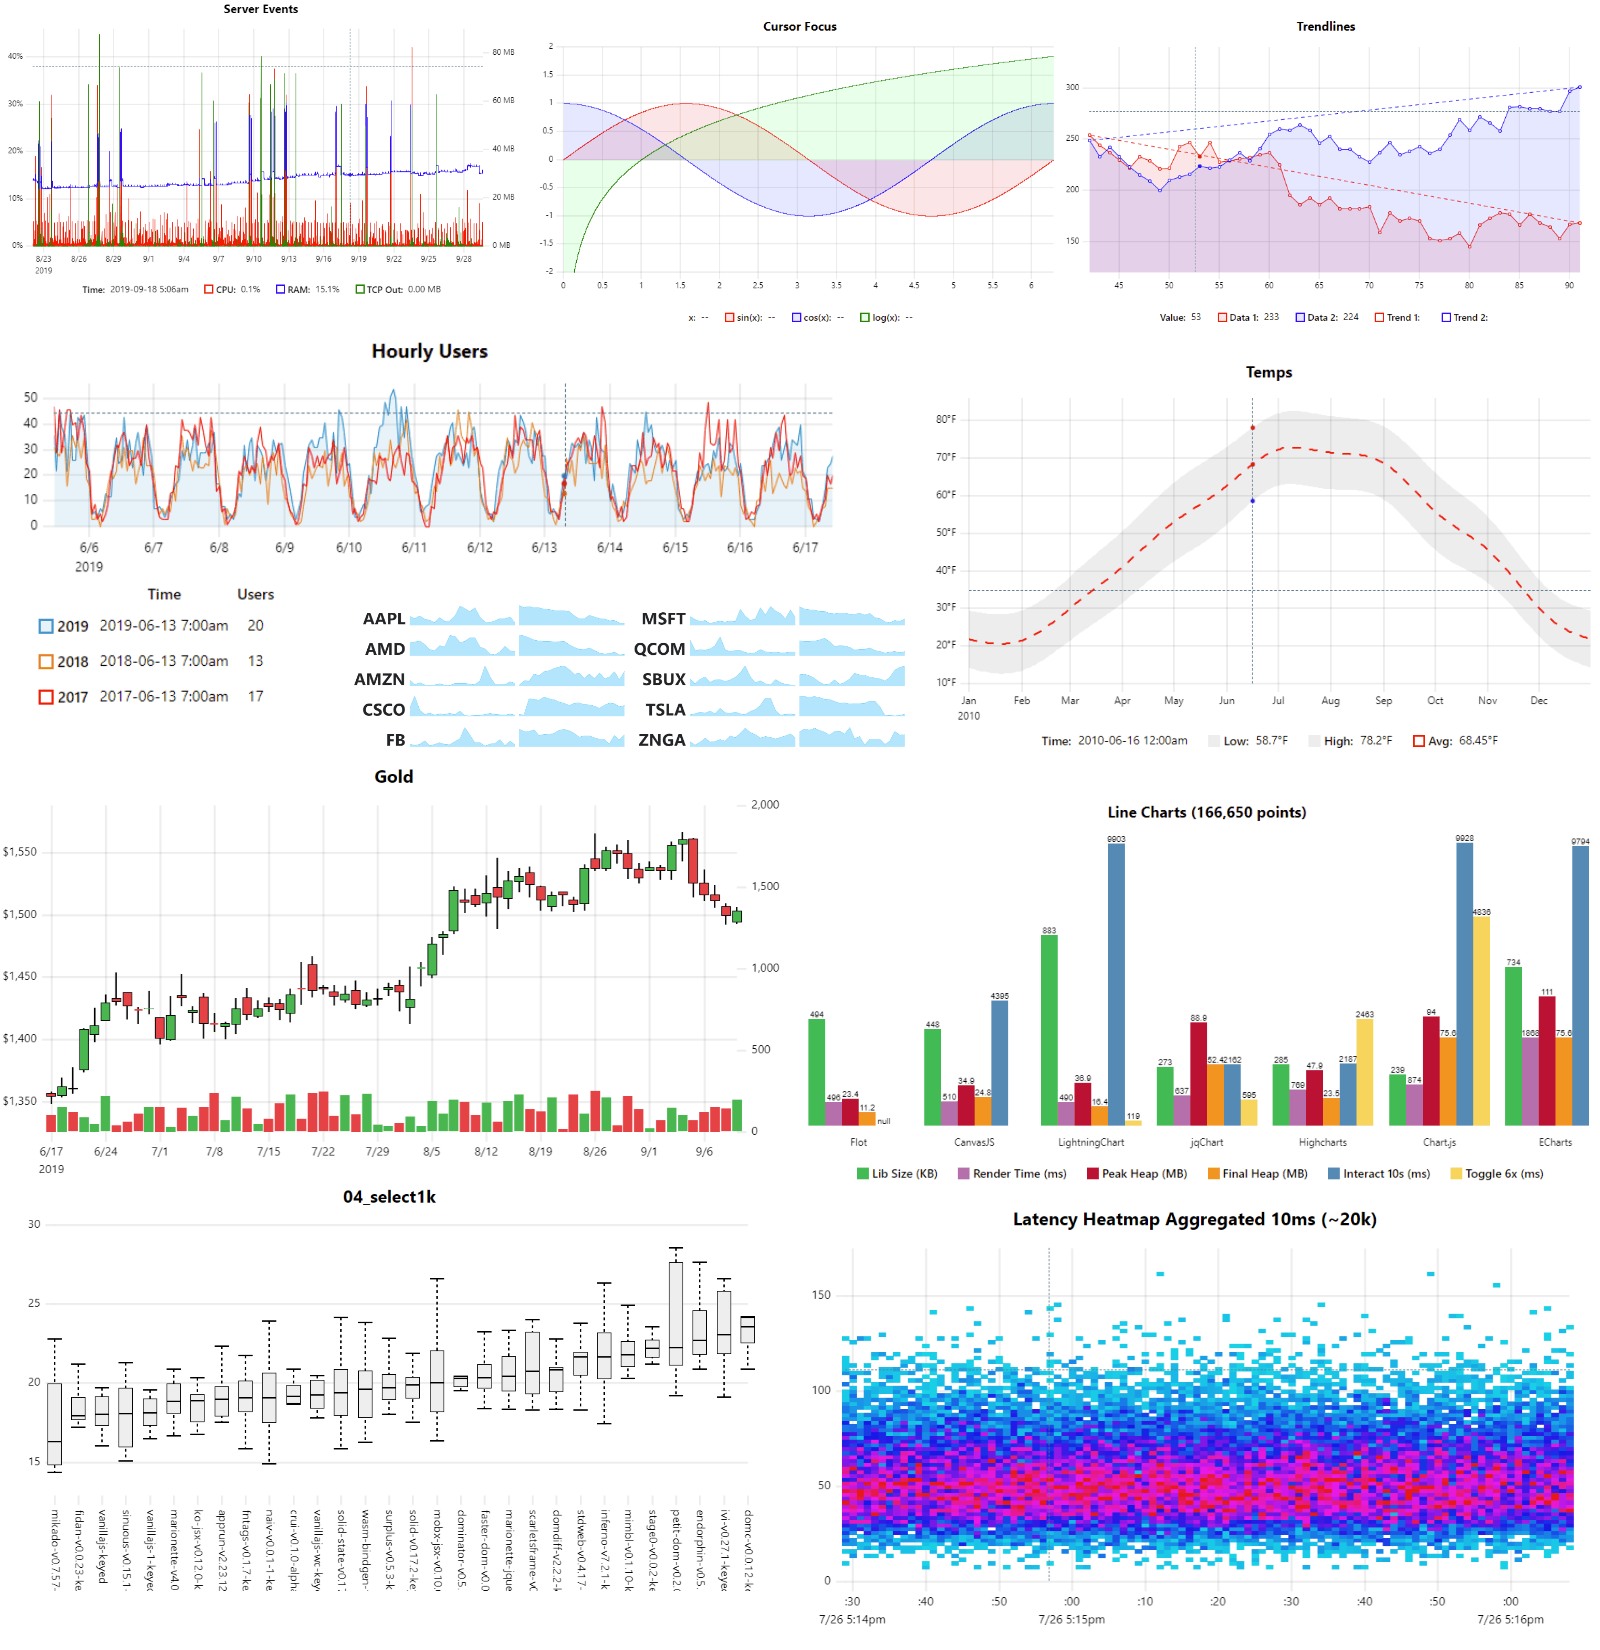


ML-For-Beginners
12 weeks, 26 lessons, 52 quizzes, classic Machine Learning for all
- 92k
- Jupyter Notebook
- MIT
- 2 wk ago

d3
Bring data to life with SVG, Canvas and HTML. :bar_chart::chart_with_upwards_trend::tada:
- 114k
- Shell
- ISC
- 3 wk ago



30-Days-Of-Python
The 30 Days of Python programming challenge is a step-by-step guide to learn the Python programming language in 30 days. This challenge may take more than 100 days. Follow your own pace. These videos may help too: https://www.youtube.com/channel/UC7PNRuno1rzYPb1xLa4yktw
- 79k
- Python
- 7 wk ago

netdata
Full-stack observability · Metrics · Logs · Traces · Flows · Topology · Infrastructure · APM · NPM · DBM · RUM · Synthetics · Cloud · AI SRE · OpenTelemetry · SNMP · NetFlow/IPFIX/sFlow · IPMI · Redfish · 2000+ integrations
- 82k
- Go
- GPL-3.0
- 9 h ago


AAChartKit-Swift
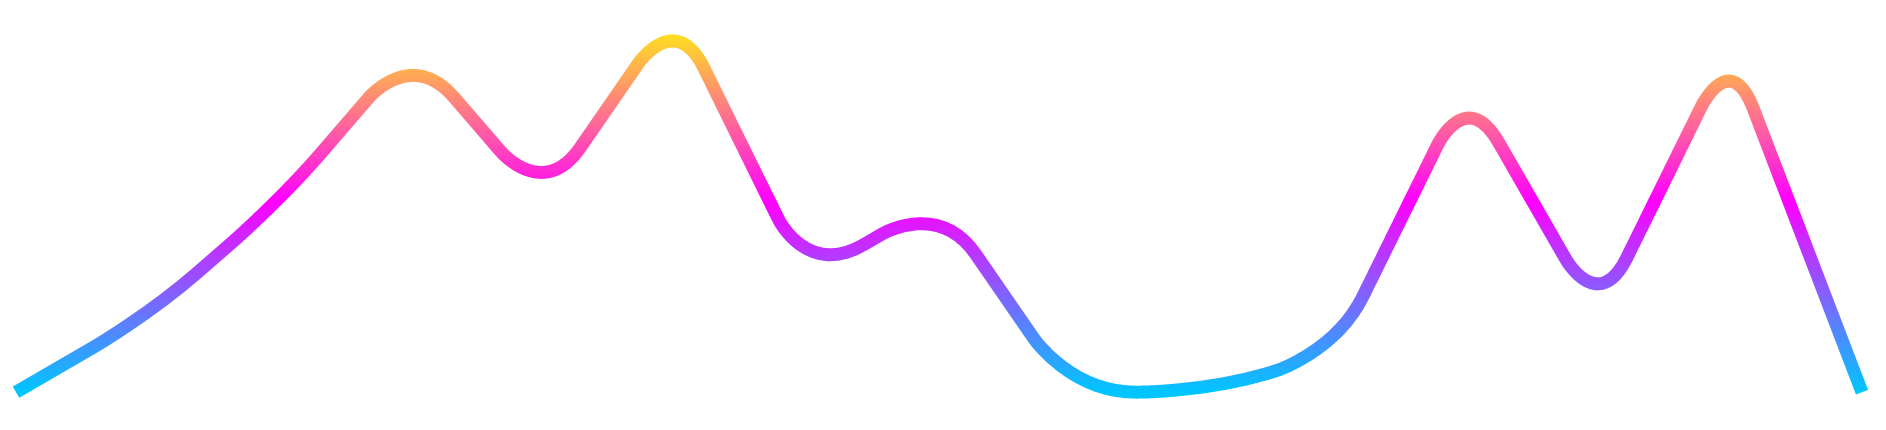
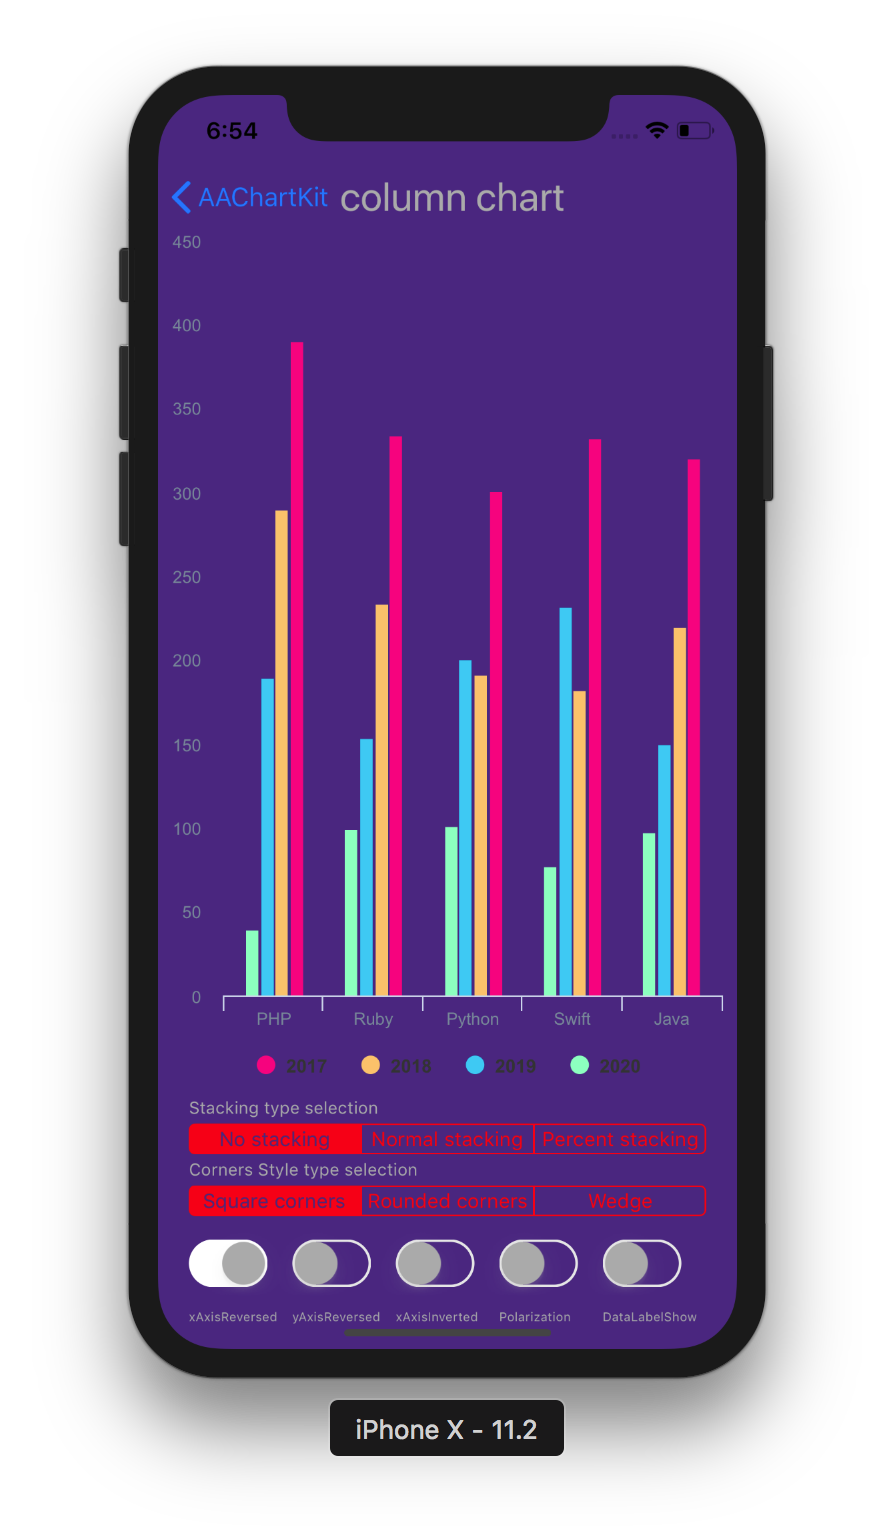
📈📊📱💻🖥️An elegant modern declarative data visualization chart framework for iOS, iPadOS and macOS. Extremely powerful, supports line, spline, area, areaspline, column, bar, pie, scatter, angular gauges, arearange, areasplinerange, columnrange, bubble, box plot, error bars, funnel, waterfall and polar chart types. 极其精美而又强大的现代化声明式数据可视化图表框架,支持柱状图、条形图、折线图、曲线图、折线填充图、曲线填充图、气泡图、扇形图、环形图、散点图、雷达图、混合图等各种
- 2.5k
- Swift
- MIT
- 2 wk ago

scientific-visualization-book
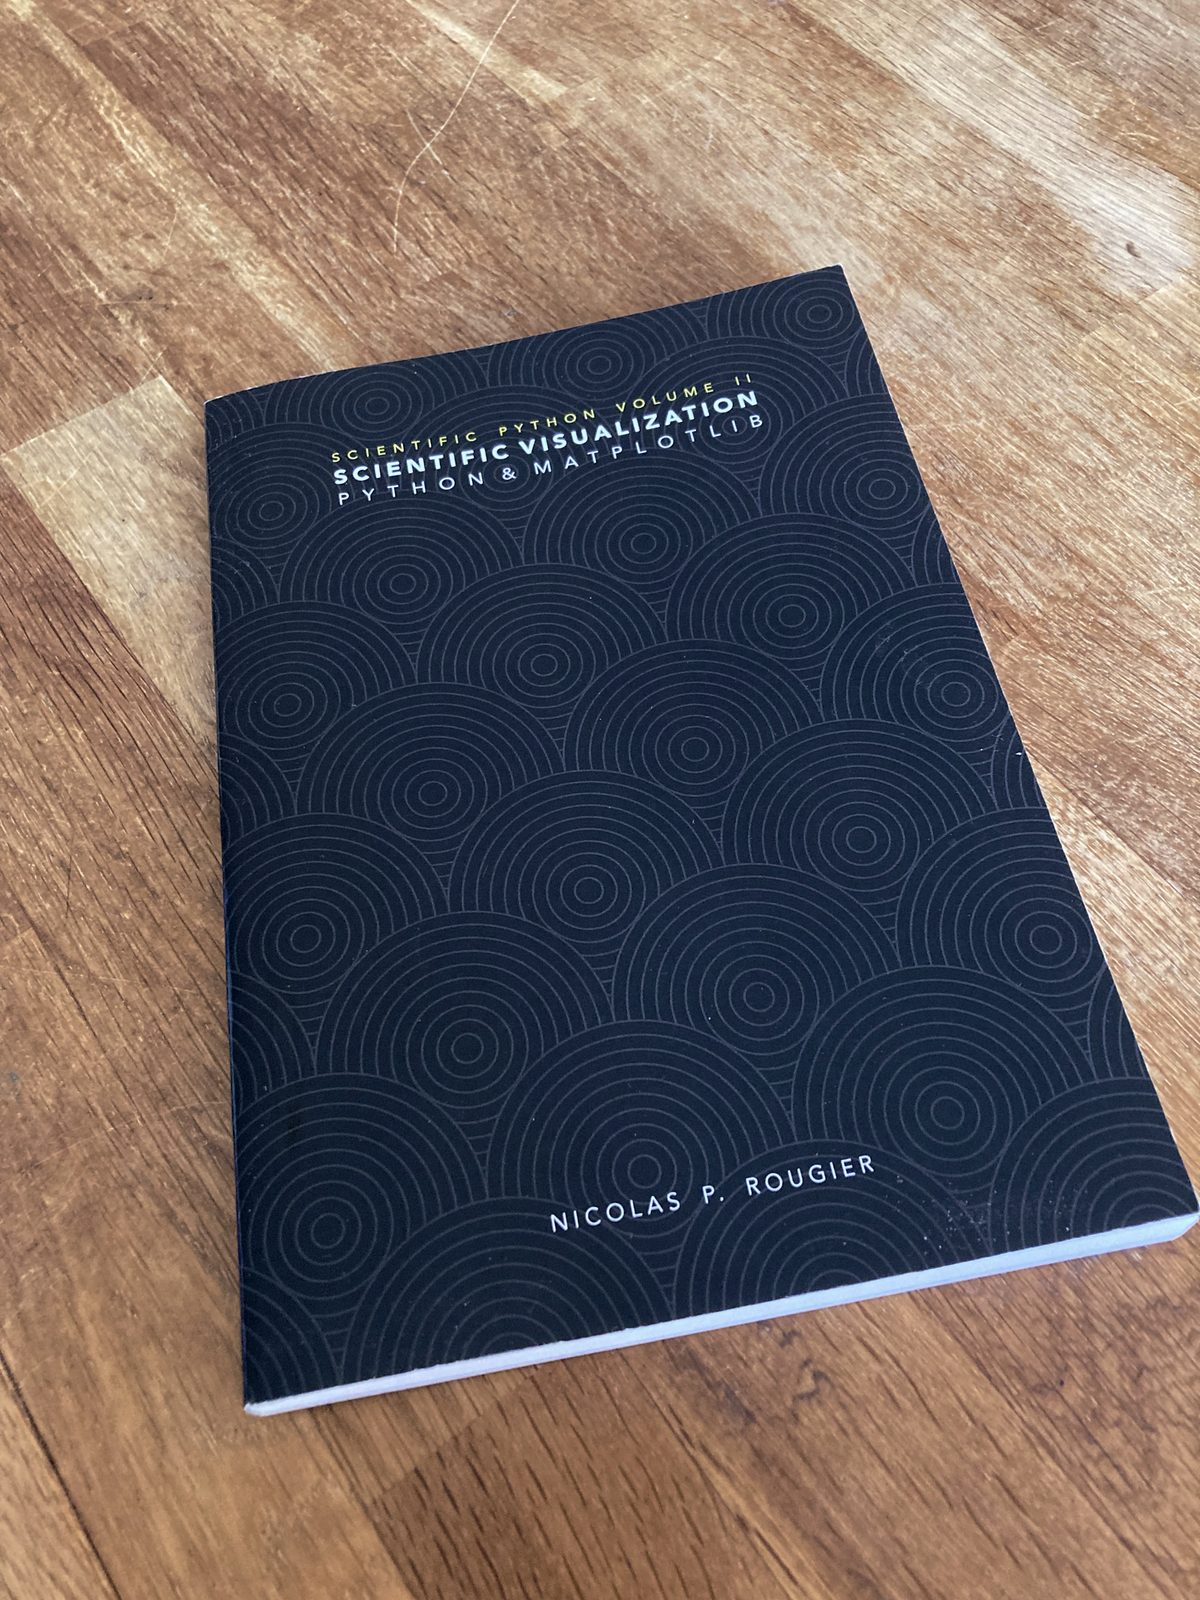
An open access book on scientific visualization using python and matplotlib
- 12k
- Python
- 11 mo ago

Side by side
| Name | Stars | License | Language | Last change | In common | Compare |
|---|---|---|---|---|---|---|
| plotters-rs/plotters | 4.7k | MIT | Rust | 7 mo ago | ||
| prometheus/prometheus | 68k | Apache-2.0 | Go | 18 h ago | graphing | Compare |
| leeoniya/uPlot | 11k | MIT | JavaScript | 4 h ago | plot, plotting | Compare |
| matplotlib/matplotlib | 23k | None declared | Python | 7 h ago | plotting | Compare |
| microsoft/ML-For-Beginners | 92k | MIT | Jupyter Notebook | 2 wk ago | Same need | Compare |
| d3/d3 | 114k | ISC | Shell | 3 wk ago | visualization | Compare |
| didvc/lpchart | 1 | BSD-3-Clause | Go | 3 mo ago | data-plotting | Compare |
| bokeh/bokeh | 20k | BSD-3-Clause | TypeScript | 2 d ago | plotting, visualization | Compare |
| Asabeneh/30-Days-Of-Python | 79k | None declared | Python | 7 wk ago | Same need | Compare |
| netdata/netdata | 82k | GPL-3.0 | Go | 9 h ago | Same need | Compare |
| unsplash/react-trend | 2.5k | MIT | JavaScript | 7 y ago | graphing | Compare |
| AAChartModel/AAChartKit-Swift | 2.5k | MIT | Swift | 2 wk ago | plot | Compare |
| rougier/scientific-visualization-book | 12k | None declared | Python | 11 mo ago | plotting | Compare |