d3
Bring data to life with SVG, Canvas and HTML. :bar_chart::chart_with_upwards_trend::tada:
- 114k
- Shell
- ISC
- 3 wk ago
Bring data to life with SVG, Canvas and HTML. :bar_chart::chart_with_upwards_trend::tada:
Apache ECharts is a powerful, interactive charting and data visualization library for browser
12 weeks, 26 lessons, 52 quizzes, classic Machine Learning for all
The 30 Days of Python programming challenge is a step-by-step guide to learn the Python programming language in 30 days. This challenge may take more than 100 days. Follow your own pace. These videos may help too: https://www.youtube.com/channel/UC7PNRuno1rzYPb1xLa4yktw
Full-stack observability · Metrics · Logs · Traces · Flows · Topology · Infrastructure · APM · NPM · DBM · RUM · Synthetics · Cloud · AI SRE · OpenTelemetry · SNMP · NetFlow/IPFIX/sFlow · IPMI · Redfish · 2000+ integrations
A powerful 🚀 Android chart view / graph view library, supporting line- bar- pie- radar- bubble- and candlestick charts as well as scaling, panning and animations.
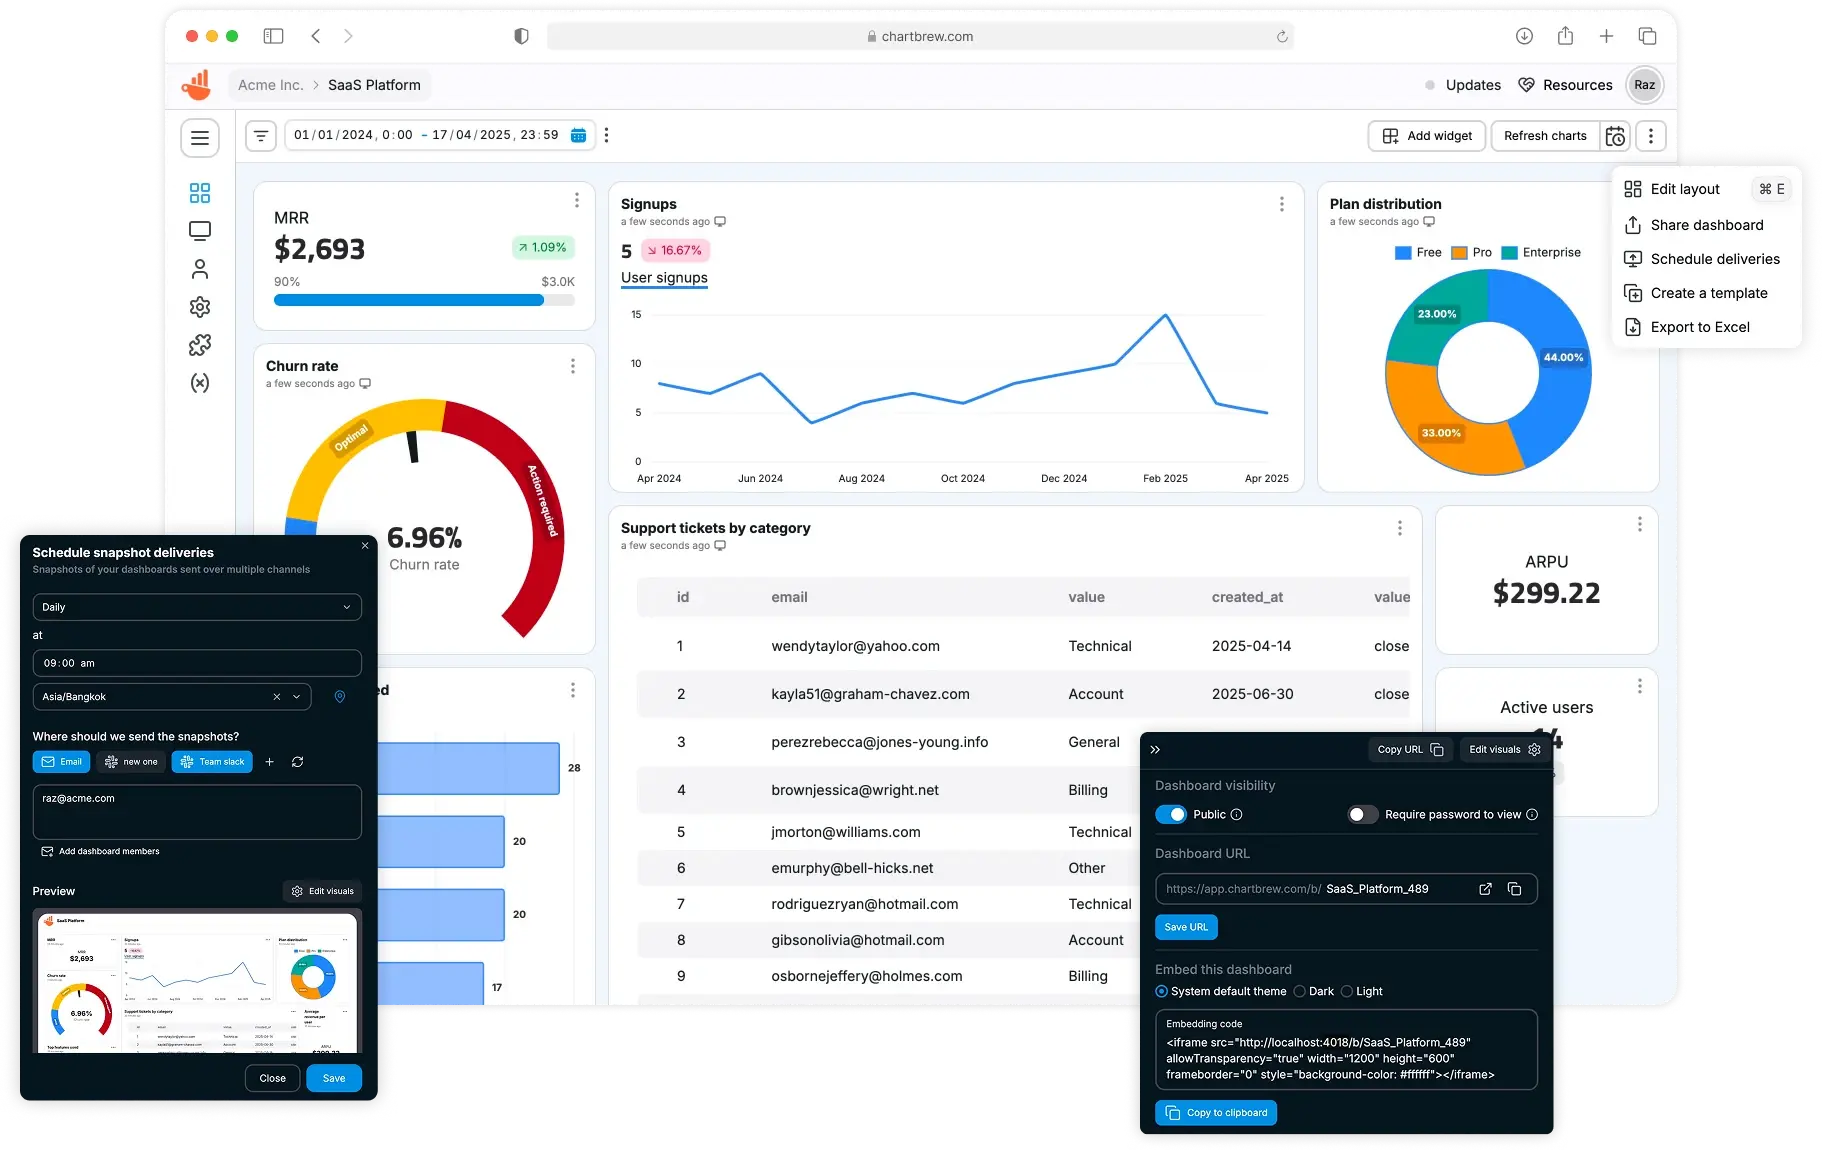
Open-source reporting platform to build and share live dashboards from APIs, SQL and NoSQL databases, with powerful AI assistant, scheduling, and embeddable charts 📈📊
| Name | Stars | License | Language | Last change | In common | Compare |
|---|---|---|---|---|---|---|
| reactchartjs/react-chartjs-2 | 6.9k | MIT | TypeScript | 22 h ago | ||
| d3/d3 | 114k | ISC | Shell | 3 wk ago | chart, charts, data-visualization | Compare |
| apache/echarts | 68k | Apache-2.0 | TypeScript | 6 wk ago | charting-library, charts, data-visualization | Compare |
| microsoft/ML-For-Beginners | 92k | MIT | Jupyter Notebook | 2 wk ago | Same need | Compare |
| chartjs/Chart.js | 68k | MIT | JavaScript | 4 d ago | chart | Compare |
| recharts/recharts | 28k | MIT | TypeScript | 2 d ago | chart, charting-library, react | Compare |
| ankane/chartkick | 6.5k | MIT | Ruby | 4 wk ago | chartjs, charts, visualization | Compare |
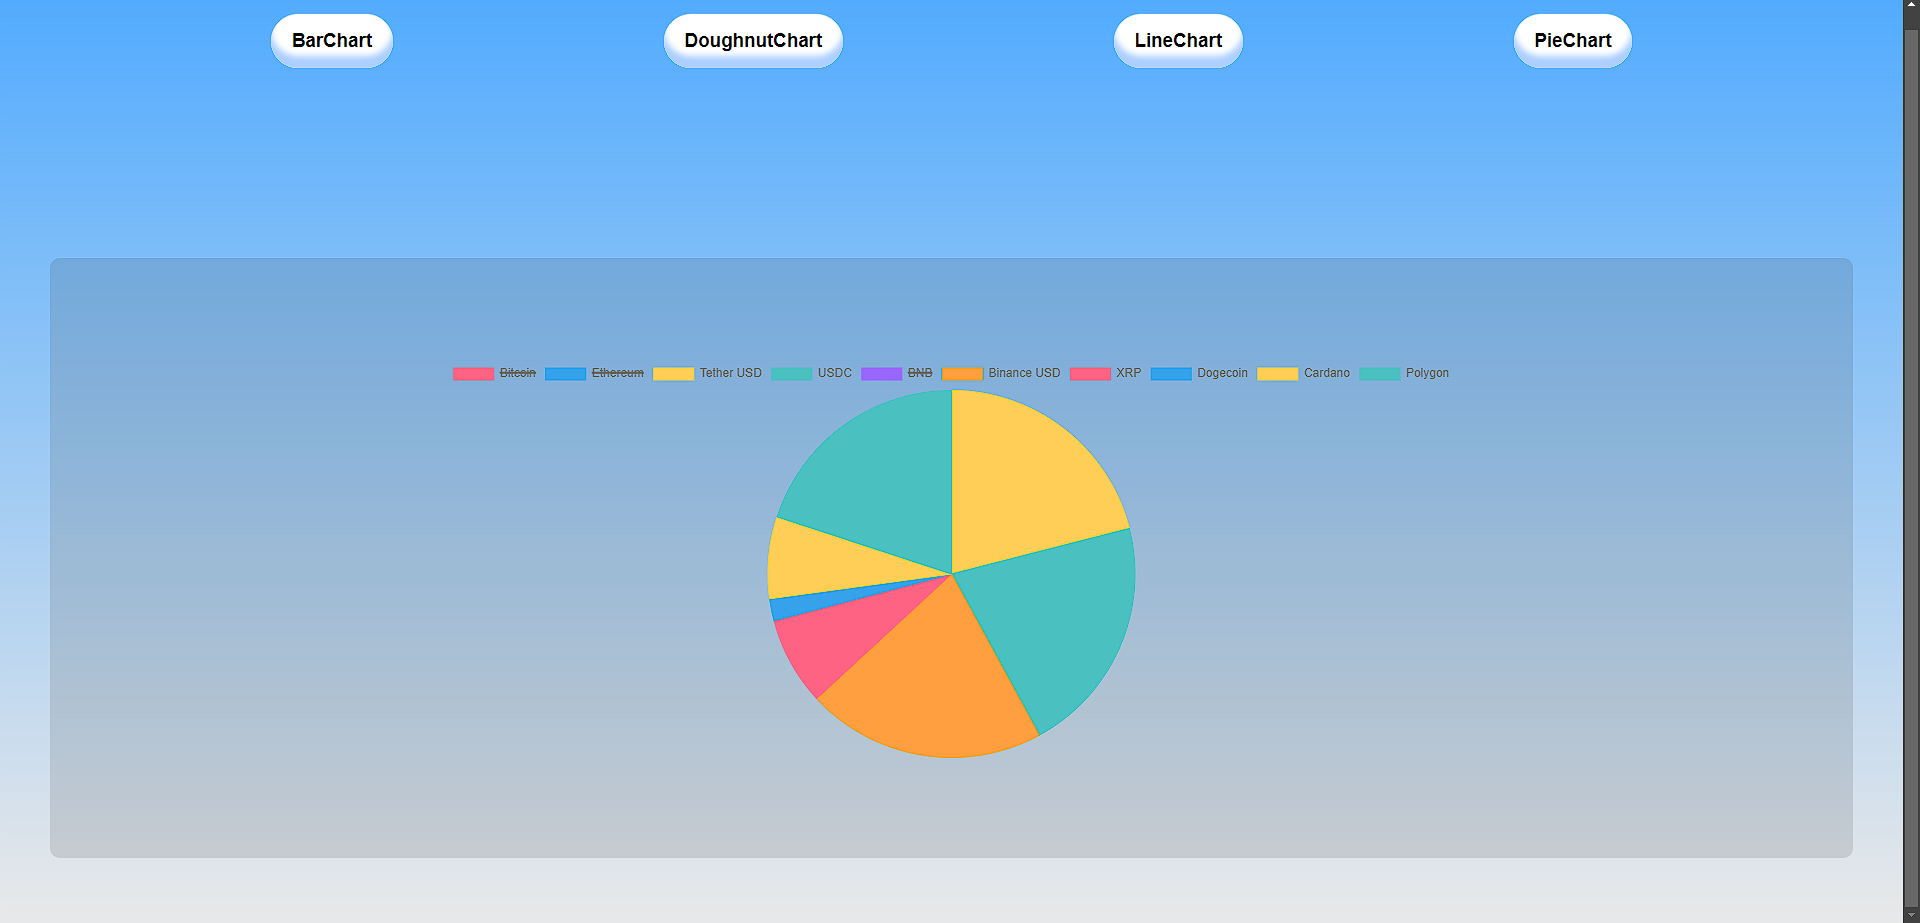
| Ivan-Corporation/chartjs-react-with-api | 0 | None declared | JavaScript | 4 y ago | chartjs, chartjs-2, react | Compare |
| Asabeneh/30-Days-Of-Python | 79k | None declared | Python | 8 wk ago | Same need | Compare |
| netdata/netdata | 82k | GPL-3.0 | Go | 14 h ago | data-visualization | Compare |
| PhilJay/MPAndroidChart | 38k | Apache-2.0 | Kotlin | 6 wk ago | chart | Compare |
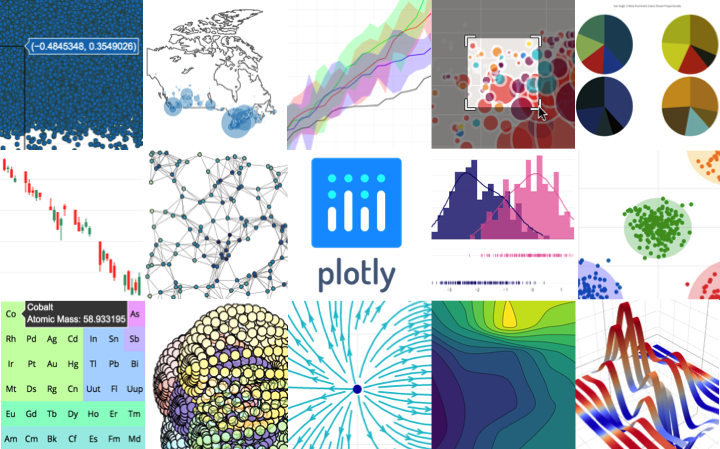
| plotly/plotly.js | 18k | MIT | JavaScript | 1 d ago | charting-library, charts, data-visualization | Compare |
| chartbrew/chartbrew | 4.1k | None declared | JavaScript | 8 d ago | chartjs, charts, data-visualization | Compare |