perspective
A data visualization and analytics component, especially well-suited for large and/or streaming datasets.
- 12k
- Rust
- Apache-2.0
- 1 h ago
A data visualization and analytics component, especially well-suited for large and/or streaming datasets.
An open source alternative to Tableau. Embeddable visual analytic
Browser-based data analytics & BI with DuckDB-WASM. Privacy-first: your data stays local; no server required.
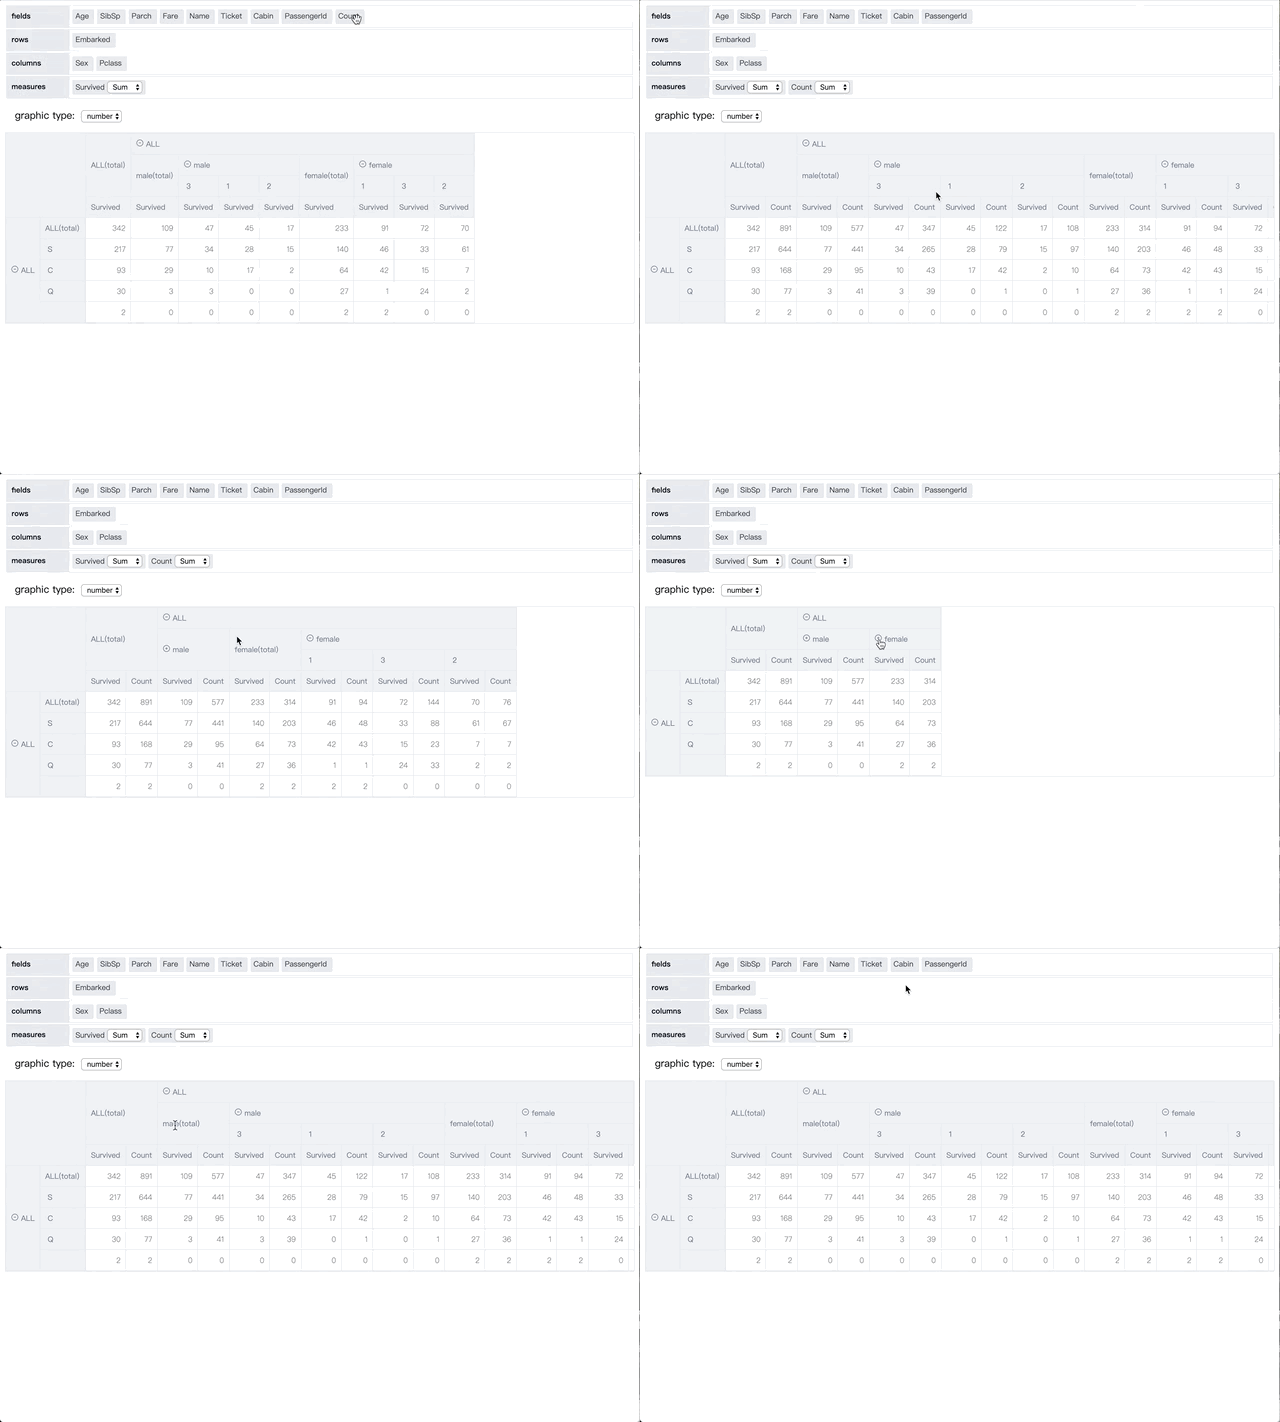
light and fast implementation of web pivot table / pivot chart components.
Explore and learn Syncfusion Blazor components using large collection of demos, example applications and tutorial samples
AI-powered natural-language BI platform: NL→SQL→dashboard plus a power-user SQL editor, root-cause, proactive AI digest, agentic copilot, semantic/trust layer, workspaces + RBAC + row-level security, embedded analytics + white-label, FP&A scenario planning. FastAPI + React.
A 100% client-side pivot grid engine for Angular and React. Supports millions of rows. Delivers professional grade performance.— MIT licensed.
Complete Financial Analytics Dashboard built with .NET 9 Blazor and Syncfusion. Features draggable/resizable Dashboard Layout, interactive Pivot Table, real-time charts, KPI cards, and a rich DataGrid. Full source from Syncfusions live webinar – ready to clone and run!
This application demonstrates the integration of the Syncfusion React Pivot Table with a Next.js server for remote data binding and CRUD operations.