practical-python-data-viz-guide
Resources for teaching & learning practical data visualization with python.
- 111
- Jupyter Notebook
- MIT
- 21 mo ago
Resources for teaching & learning practical data visualization with python.
A Jupyter Notebook written in Python to download Jira issues, boards, sprints, projects and epics data. Data is stored in a Pandas dataframe and visualized with Plotly Express.
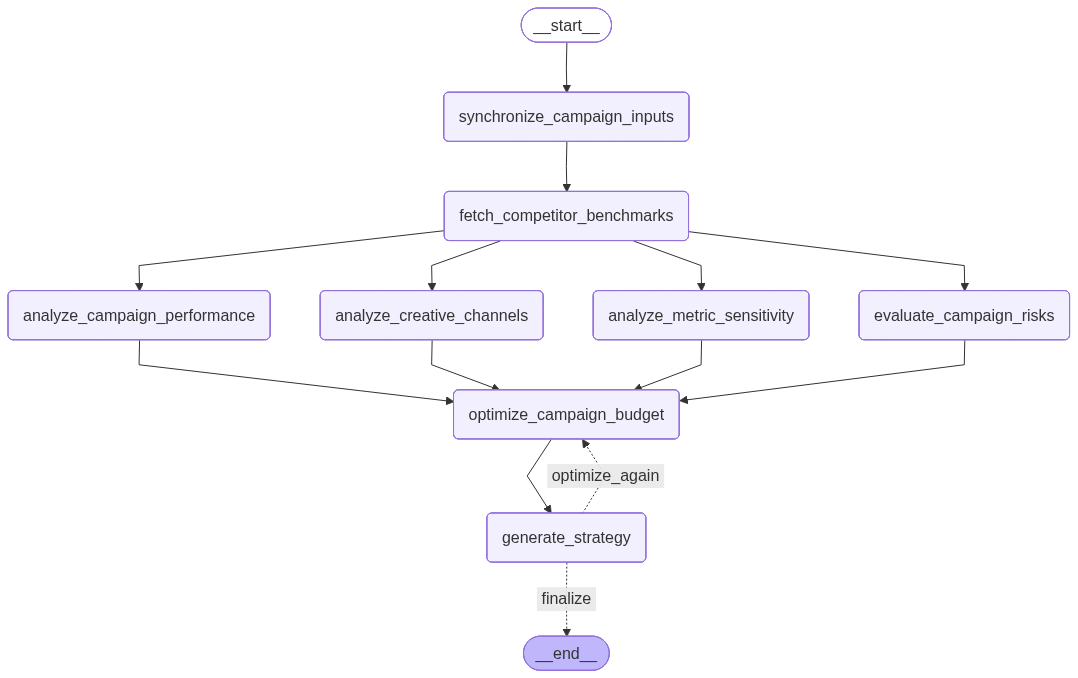
Successfully developed AdAstra Marketing Intelligence Campaign Optimization Engine, a next-generation AI system using LangGraph that transforms raw campaign data into strategic, revenue-driven decisions. It blends KPI diagnostics, CVXPY optimization, and intelligent budget reallocation to deliver measurable lift in ROAS, efficiency, and growth.
💠 Global Population Analysis 💠 This project visualizes Global Population Data using Python. It covers data cleaning, transformation, and exploratory analysis. Includes static (Matplotlib/Seaborn) and interactive (Plotly) visualizations. Auto-generates insights in Markdown and a PowerPoint report.Helps uncover trends and global population pattern.
My complete course for data analysis with python. From Statistics to the end