tidyr




spotify-artists-analysis
An exploratory data analysis and data visualization project using data from Spotify Web API
- 89
- R
- MIT
- 8 y ago

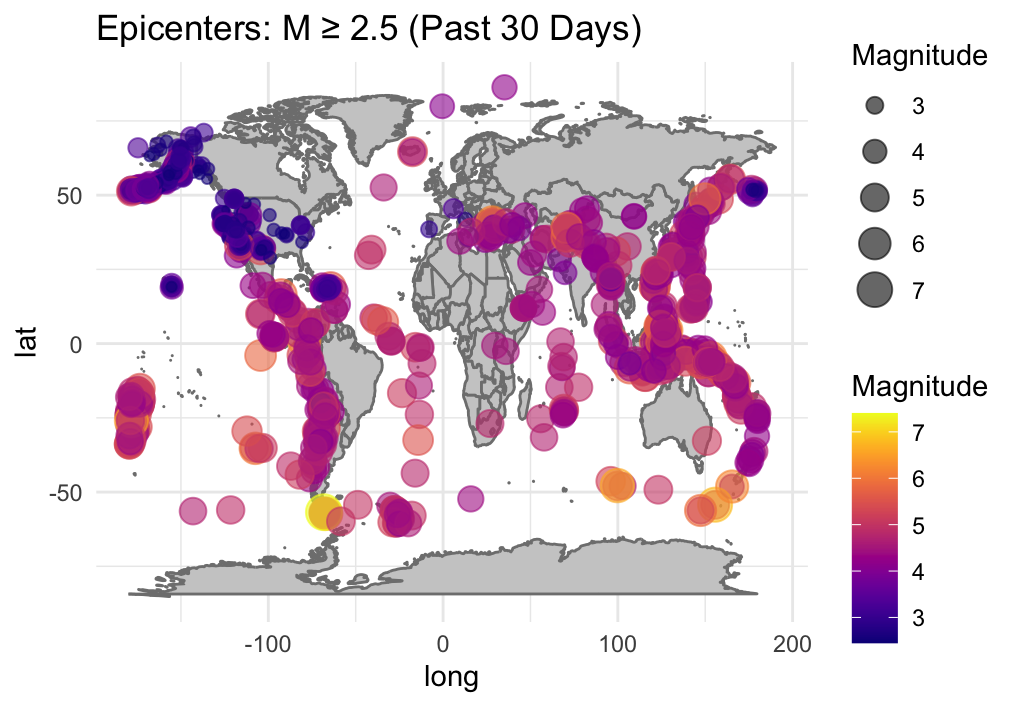
Earthquake-R-Analysis
🌏 A project for visualizing and analyzing global earthquakes (M ≥ 2.5, last 30 days) using a single R script that automates data download, cleaning, and plotting. Generates 15 sequential plots covering spatial, temporal, and statistical patterns, including regression analysis of magnitude vs. depth.
- 13
- R
- MIT
- 8 wk ago

Applied-Supervised-Learning-with-R
Use machine learning libraries of R to build models that solve problems and predict business trends
- 9
- Jupyter Notebook
- MIT
- 8 y ago



Data-Science-with-R-programming
This R script provides a comprehensive overview of data visualization and data manipulation techniques using various libraries like DPLYR, TIDRY, & Data Visualization using GGPLOT, PLOTLY etc.
- 1
- R
- 22 mo ago

