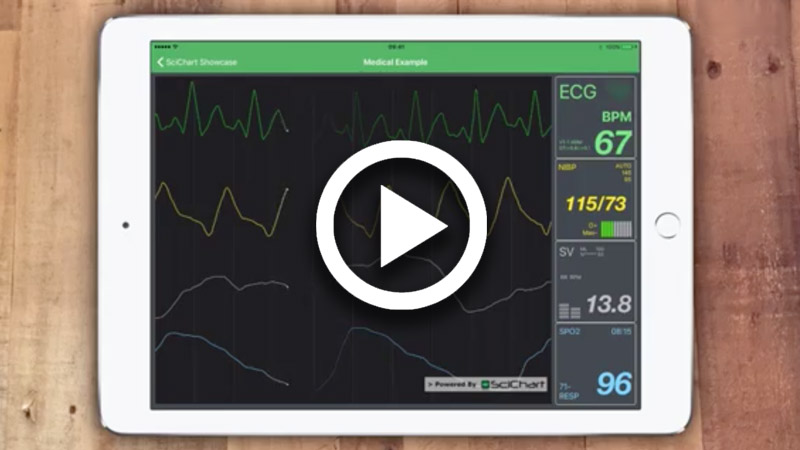
SciChart.Android.Examples
Examples, Tutorials for SciChart Android: Realtime Android Chart Controls
- 226
- Java
- MIT
- 2 mo ago
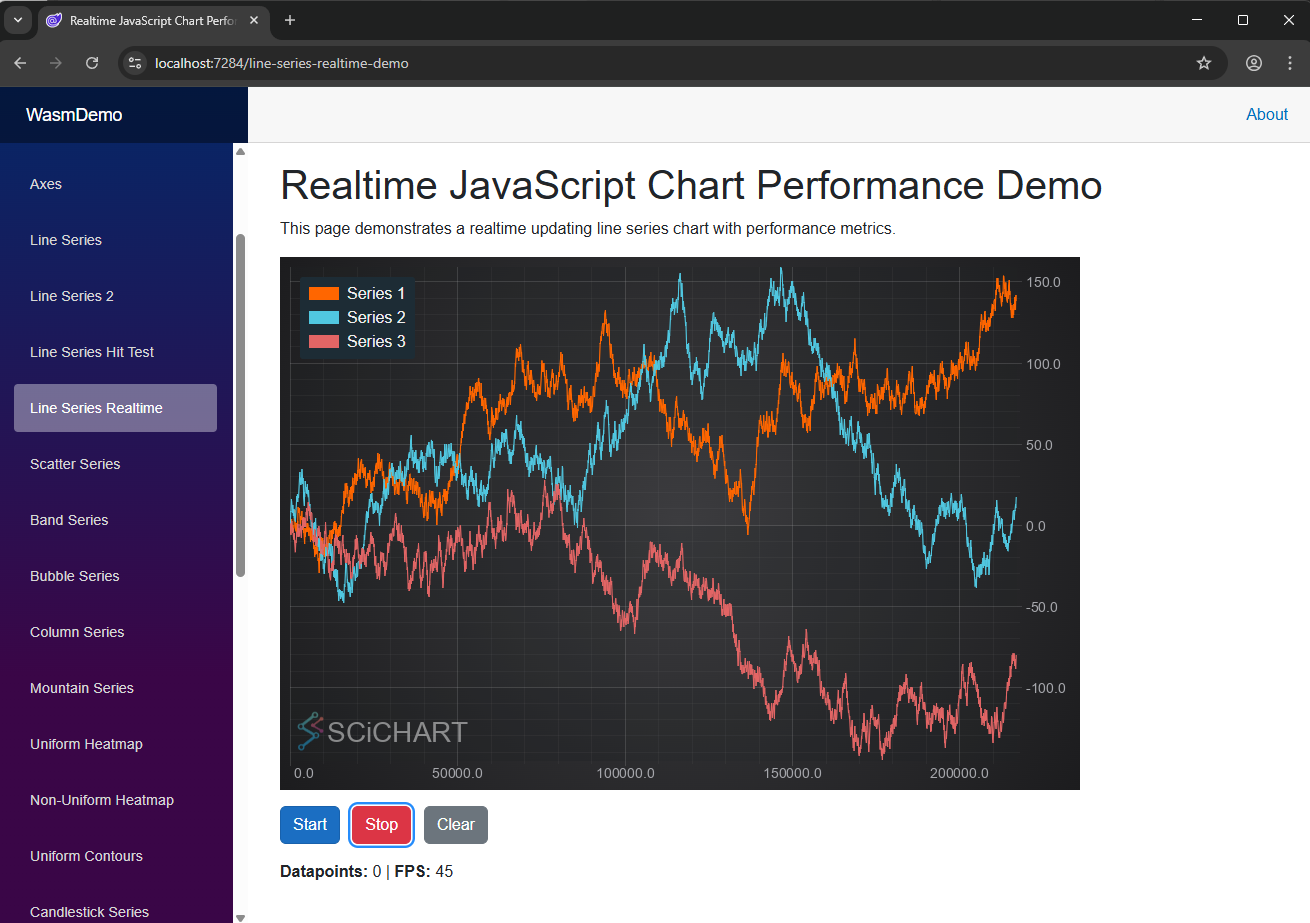
The maintainer has not written a description at the source.
Repo ABTSoftware/SciChart.Blazor.Examples, read from GitHub 1 min ago. ABTSoftware has not joined Take My Repo.
ABTSoftware/SciChart.Blazor.Examples is a public repo on GitHub by ABTSoftware. It declares no license on GitHub. Public does not mean open source: without a license, nobody is granted the right to reuse it. It is written mainly in C#, has 0 stars and last changed on 2026-10-06. Nobody has reviewed it on Take My Repo yet, which says nothing about its quality. Read from GitHub on 2026-11-22.
The current version of these examples targets SciChart.Blazor 6, based on SciChart.js 6. To find the examples for version 5, use the v5.x branch.
See the Change Log for the latest updates.

SciChart.Blazor.dll is hosted on our beta Nuget feed for now. You'll need to add a package source to https://www.myget.org/F/abtsoftware-bleeding-edge/api/v3/index.json
Either:
dotnet nuget add source https://www.myget.org/F/abtsoftware-bleeding-edge/api/v3/index.json --name "ABT Bleeding Edge"
Most of examples are in WasmDemo. In order to run:
cd WasmDemodotnet runFor running ServerDemo:
cd ServerDemodotnet runNote: if you see an example not updated, please do Empty Cache and Hard Reload in your browser
Steps to create a Wasm Demo from scratch
dotnet new blazorwasm -o MyBlazorWasmAppdotnet nuget add source https://www.myget.org/F/abtsoftware-bleeding-edge/api/v3/index.json --name "ABT Bleeding Edge"dotnet nuget list sourcedotnet add package SciChart.Blazor_imports.razor file
@using static Microsoft.AspNetCore.Components.Web.RenderMode@using SciChart.Blazor.ComponentsDemo.razor@page "/demo"
@rendermode InteractiveWebAssembly
<PageTitle>Annotations</PageTitle>
<div id="demo" style="display: flex; gap: 20px; align-items: flex-start;">
<div style="width: 600px; flex-shrink: 0;">
<SciChartSurface @ref="_sciChartRef" HeightAspect="2" WidthAspect="3">
<XAxes>
<NumericAxis />
</XAxes>
<YAxes>
<NumericAxis />
</YAxes>
<MouseWheelZoomModifier />
<ZoomPanModifier />
</SciChartSurface>
</div>
</div>
SciChart.Blazor is Blazor component library that wraps SciChart.js — a high-performance WebGL charting library — enabling its use in Blazor Server and Blazor WebAssembly applications.
Current version of nuget package supports only 2D charts, Polar Charts and Pie Charts are not supported at the moment. The package is based on SciChart.js version 6.0.6.
All charts that are in the library support initial creation and data append. However, only FastLineRenderableSeries has been well tested at the moment.
dotnet add package SciChart.Blazor
In _imports.razor:
@using SciChart.Blazor.Components@page "/my-chart" <SciChartSurface HeightAspect="2" WidthAspect="3"> <XAxes> <NumericAxis /> </XAxes> <YAxes> <NumericAxis /> </YAxes> <FastLineRenderableSeries Stroke="#FF6600" StrokeThickness="2" SeriesName="My Series"> <XyDataSeries XValues="@(new double[] { 0, 1, 2, 3, 4 })" YValues="@(new double[] { 0, 1, 0.5, 1.5, 1 })" /> </FastLineRenderableSeries> <MouseWheelZoomModifier /> <ZoomPanModifier /> </SciChartSurface>
| Series | Description |
|---|---|
FastLineRenderableSeries |
Line chart |
SplineLineRenderableSeries |
Smoothed spline line chart |
FastMountainRenderableSeries |
Filled mountain/area chart |
FastColumnRenderableSeries |
Bar/column chart |
FastCandlestickRenderableSeries |
Candlestick (OHLC) chart |
FastOhlcRenderableSeries |
OHLC chart |
FastBandRenderableSeries |
Band/range chart |
FastBubbleRenderableSeries |
Bubble chart |
XyScatterRenderableSeries |
Scatter chart |
FastImpulseRenderableSeries |
Impulse/stem chart |
FastErrorBarsRenderableSeries |
Error bars |
UniformHeatmapRenderableSeries |
Heatmap |
StackedColumnCollection |
Stacked columns |
StackedMountainCollection |
Stacked mountain |
| and more... |
NumericAxisCategoryAxisDateTimeNumericAxisMouseWheelZoomModifier — scroll to zoomZoomPanModifier — drag to panRubberBandXyZoomModifier — drag to zoom a regionRolloverModifier — cursor tooltipZoomExtentsModifier — double-click to fit chartXAxisDragModifier / YAxisDragModifier — drag axes to pan/scaleDataPointSelectionModifier — click to select data pointsLegendModifier — interactive chart legendGet a reference to a data series and call AppendRange:
<FastLineRenderableSeries Stroke="blue">
    <XyDataSeries @ref="_series" />
</FastLineRenderableSeries>

@code {
    XyDataSeries? _series;

    async Task AppendData()
    {
        await _series!.AppendRange(
            new double[] { 5, 6 },
            new double[] { 1.2, 0.8 }
        );
    }
}
<SciChartSurface OnSciChartSurfaceRendered="OnRendered">
    <XAxes>
        <NumericAxis OnVisibleRangeChanged="OnRangeChanged" />
    </XAxes>
    ...
</SciChartSurface>
Copyright (c) SciChart Ltd. All rights reserved.
See the SciChart licensing page for details.
ABTSoftware/SciChart.Blazor.Examples is a public repo on GitHub by ABTSoftware. Its maker has not written a description.
It declares no license on GitHub. Public does not mean open source: without a license, nobody is granted the right to reuse it.
Its maker has not tagged a system, so it is unknown here. Its README says what it needs.
Open "Take it" on its page: Take My Repo writes an install plan for your machine and hands it to your AI agent (Claude Code, Codex or Cursor), which asks you before each step. Take My Repo has not tested it on any machine.
Its last change on GitHub was on 2026-10-06. GitHub counts 1 open issue and pull requests. Take My Repo does not judge from that whether it is maintained.
Examples, Tutorials for SciChart Android: Realtime Android Chart Controls
Nobody has reviewed it on Take My Repo yet, which says nothing about its quality.
Examples, tutorials, and sandbox for SciChart WPF: High Performance Realtime Charts. 2D and 3D WPF chart examples in C# and XAML, MVVM tutorials, .NET Framework and .NET 6–9.
Examples, Showcase & Tutorials for SciChart.iOS High Performance Charting Library
Core reactive libraries, custom controls and styles for WPF UI created by SciChart
React, Angular, JavaScript example & demo suite for SciChart.js - High Performance Realtime Charts. Live demo viewable online at https://www.scichart.com/demo/react
Finance.Android aka the 'SciTrader SDK' is a free open source financial stock chart, cryptocurrency chart, trading chart library built on top of SciChart's Android Chart Library