Side
Small macro/consumer/investment analyses (EPS, PCE) kept as a scratchpad
- 0
- 3 mo ago
Repo Carlping/Side, read from GitHub 15 min ago. Carlping has not joined Take My Repo.
In short
Carlping/Side is a public repo on GitHub by Carlping. Small macro/consumer/investment analyses (EPS, PCE) kept as a scratchpad. It declares no license on GitHub. Public does not mean open source: without a license, nobody is granted the right to reuse it. It is written mainly in Jupyter Notebook, has 0 stars and last changed on 2026-08-26. Nobody has reviewed it on Take My Repo yet, which says nothing about its quality. Read from GitHub on 2026-11-22.
US excess saving and consumption
Question: did the pandemic-era stock of "excess saving" get spent, and does US consumption grow faster in the months when that stock is being drawn down?
Answer, from the data in RESULTS.md: the stock is real and
large — it peaks at about $2.2 trillion in August 2021 — but the month-to-month
link to consumption growth is not there. The correlation between consumption
growth and the drawdown flips sign depending on where the window starts
(+0.62 from 2021-01, +0.07 from 2021-07, -0.22 from 2023-01), and the
positive early reading is almost entirely one month: March 2021, when the third
stimulus payment pushed spending and saving up together. A single window would
have produced a confident but meaningless number in either direction.
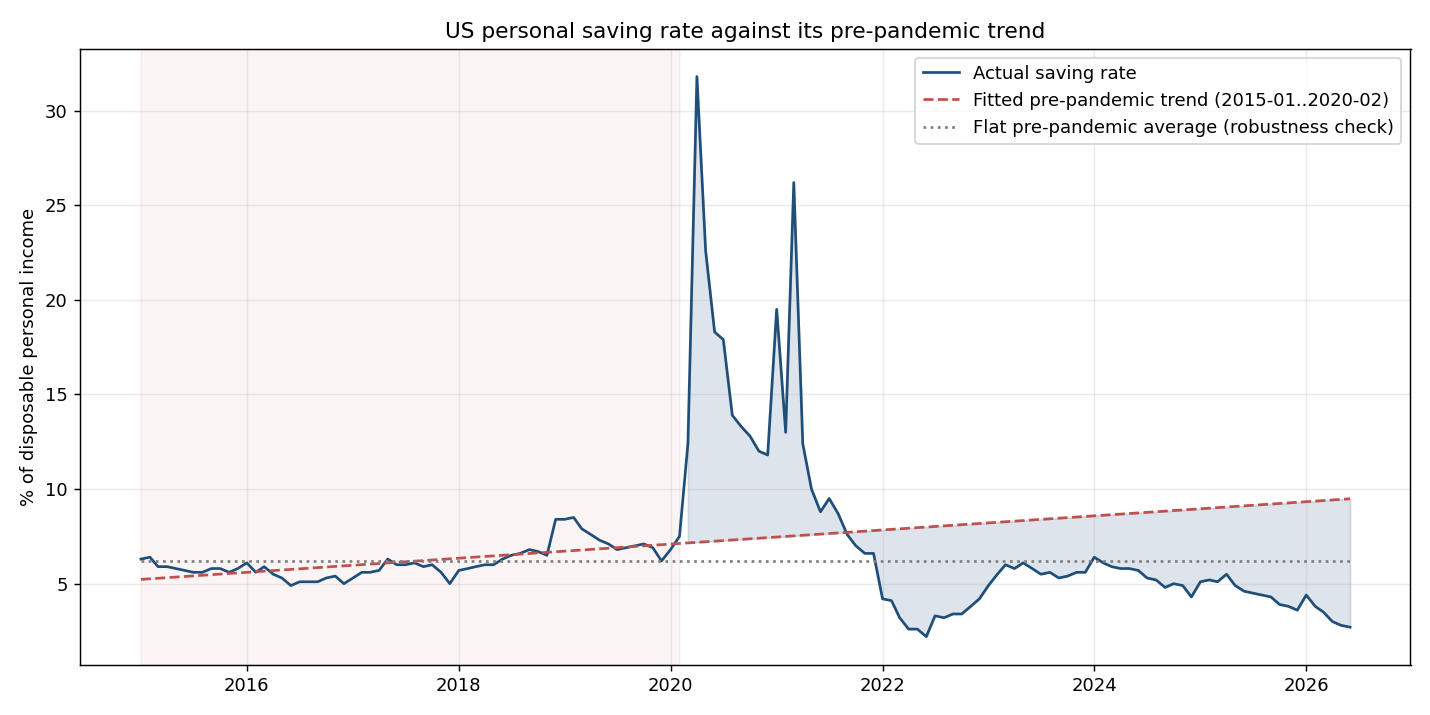
Whether the stock is now exhausted depends on an assumption the data cannot
settle: extrapolating the fitted 2015–2019 saving-rate trend says it went
negative in 2024-12, while holding the pre-pandemic average rate flat says
about $1.1 trillion is left. Both are in RESULTS.md; the honest answer is
that the counterfactual, not the data, is doing the work.
Method
- Fit an OLS line to the personal saving rate over 2015-01 … 2020-02 (the last month before US pandemic transfers). A rate, not a dollar level, so the counterfactual scales with realised income instead of assuming pre-pandemic income growth.
- Extrapolate that line and convert it to dollars with each month's realised
disposable income:
counterfactual_saving = rate / 100 * DSPI. - Monthly excess saving is
(actual_saving − counterfactual_saving) / 12, since both series are annual-rate dollars while the flow is monthly. - Cumulate from 2020-03; report the peak, the drawdown and the month it crosses zero, under both the fitted-trend and the flat-rate counterfactual.
- Correlate consumption growth with (a) the change in the excess stock and (b) the saving-rate gap, over four window start dates rather than one.
Data
Four monthly BEA series, pulled from FRED's public CSV endpoint — no API key, no manual download, so anyone can reproduce the numbers:
| Series | Meaning |
|---|---|
PCE |
Personal consumption expenditures, $bn, SAAR |
PMSAVE |
Personal saving, $bn, SAAR |
PSAVERT |
Personal saving as a % of disposable income |
DSPI |
Disposable personal income, $bn, SAAR |
Downloads are cached in data/ (git-ignored) and reused unless --refresh is passed.
Run it
pip install -e ".[dev]"
python -m pce_savings            # uses cached CSVs if present
python -m pce_savings --refresh  # re-download from FRED
pytest -q                        # unit tests, no network
This rewrites RESULTS.md, results.json and figures/. CI runs the tests and
lints on every push, and re-runs the full analysis against live FRED data monthly,
so the repository fails loudly if the pipeline or the source data breaks.
Limitations
- Accounting, not behaviour. Disposable income is spent or saved by construction, so consumption and saving are mechanically linked; a negative correlation is partly definitional and none of this identifies causation.
- The counterfactual dominates the level. As shown above, "is it gone?" is answered by the baseline assumption, not by the data.
- Aggregates hide distribution. Excess saving is concentrated in higher-income households, so an aggregate stock says little about the households whose spending is most sensitive to it.
- BEA revises. Personal income and saving are revised for years; re-running this on a later vintage will move the numbers.
- Monthly Pearson correlation on trending series is a weak test; a proper answer would use a distributed-lag or error-correction specification.
繁體中文摘要
研究問題:疫情期間累積的「超額儲蓄」是否已經花完,以及美國消費支出是否在超額 儲蓄被消耗的月份成長得更快?
結果:超額儲蓄確實存在且龐大(2021 年 8 月達到約 2.2 兆美元高點),但與消費成長
的月度關聯不成立——相關係數會隨樣本起點翻轉正負(2021-01 起 +0.62、2022-01
起 -0.11、2023-01 起 -0.22),而早期的正相關幾乎全來自 2021 年 3 月一次紓困
發放,當月消費與儲蓄同時跳升。至於「花完了嗎」,取決於反事實假設而非資料本身:
沿用 2015–2019 擬合趨勢會得到 2024 年 12 月即由正轉負,改用疫情前平均儲蓄率則
還剩約 1.1 兆美元。兩種算法都寫在 RESULTS.md。
資料全部來自 FRED 公開 CSV 端點(不需要 API key),python -m pce_savings 就能
從零重現所有數字與圖表;分析的算術部分有單元測試,CI 每月會用最新資料重跑一次。
Repository history
archive/PCE-2023-bea-excel.ipynb is the earlier version of this question: it
read a manually downloaded BEA spreadsheet with hard-coded column offsets, so it
could not be reproduced by anyone else and never reached an answer. It is kept
verbatim as a record and is excluded from lint. An unfinished valuation scratch
file (EPS.py) was deleted rather than published half-working.
Questions
What is Side?
Carlping/Side is a public repo on GitHub by Carlping. Small macro/consumer/investment analyses (EPS, PCE) kept as a scratchpad.
Is Side open source?
It declares no license on GitHub. Public does not mean open source: without a license, nobody is granted the right to reuse it.
Does Side run on macOS, Windows or Linux?
Its maker has not tagged a system, so it is unknown here. Its README says what it needs.
How do I install Side?
Open "Take it" on its page: Take My Repo writes an install plan for your machine and hands it to your AI agent (Claude Code, Codex or Cursor), which asks you before each step. Take My Repo has not tested it on any machine.
Is Side still maintained?
Its last change on GitHub was on 2026-08-26. Take My Repo does not judge from that whether it is maintained.
What do people who ran Side say?
Nobody has reviewed it on Take My Repo yet, which says nothing about its quality.
Similar repos
dbg-macro
A dbg(…) macro for C++