failproofai
Observability and enforcement for AI agent harnesses. Capture every run and runtime reliability with policy enforcement.
- 10k
- TypeScript
- 15 h ago
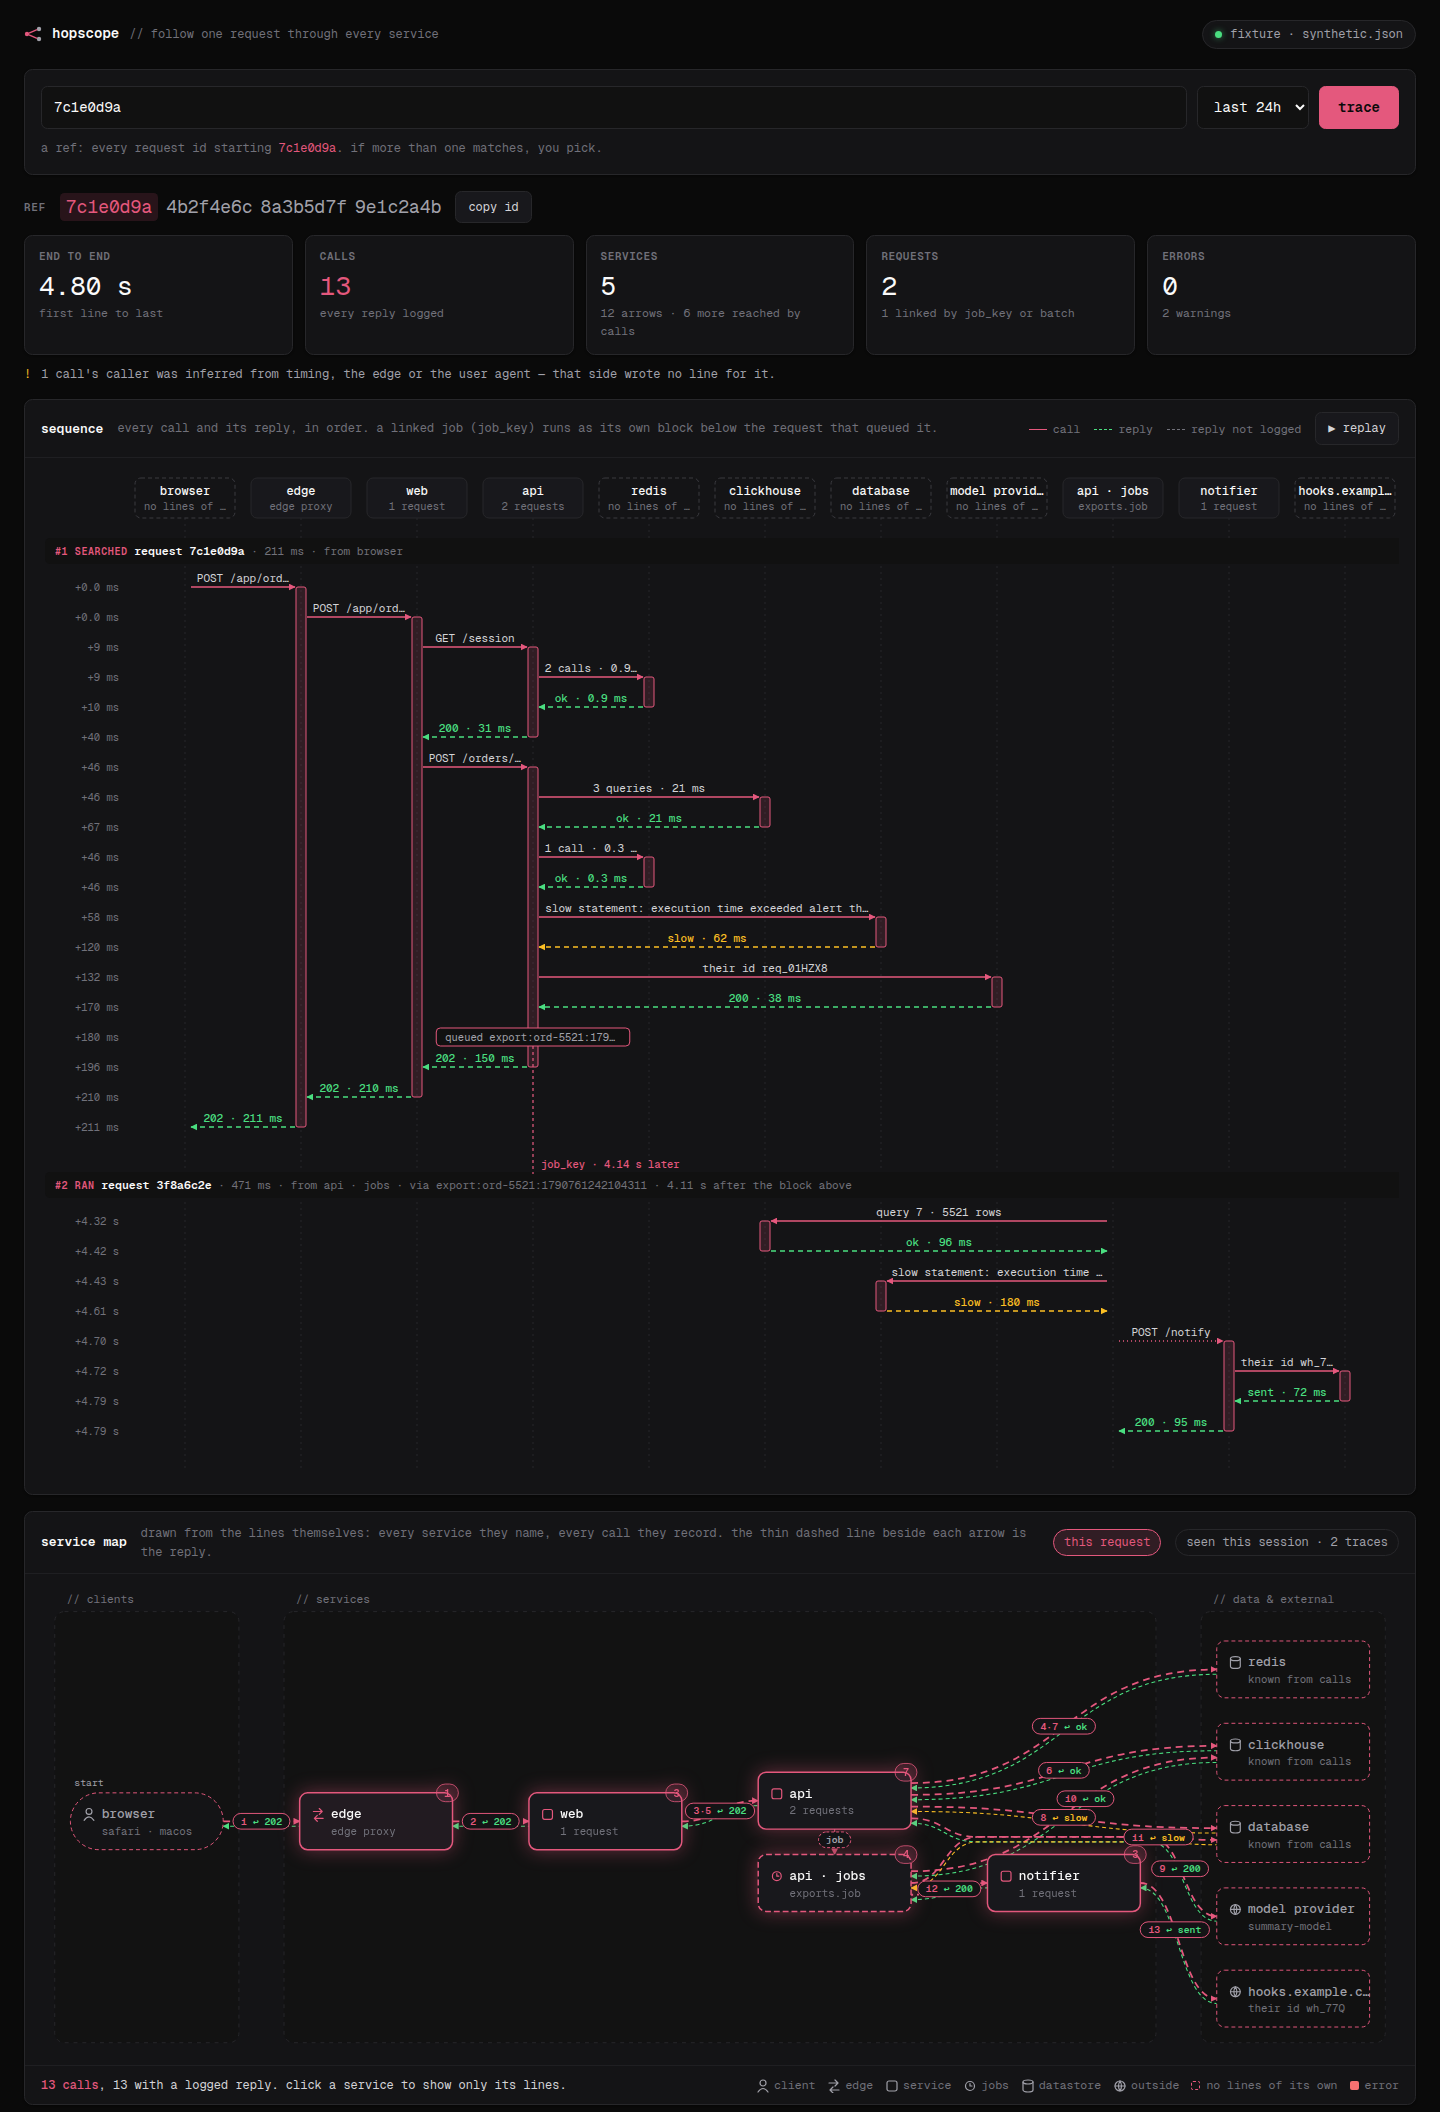
Follow one request id across your services, from your logs: every call and its reply, on a map that draws itself.
Repo FailproofAI/hopscope, read from GitHub 34 min ago. FailproofAI has not joined Take My Repo.
FailproofAI/hopscope is a public repo on GitHub by FailproofAI. Follow one request id across your services, from your logs: every call and its reply, on a map that draws itself. It declares the MIT license on GitHub. It is written mainly in JavaScript, has 0 stars and last changed on 2026-09-30. Nobody has reviewed it on Take My Repo yet, which says nothing about its quality. Read from GitHub on 2026-11-22.
Paste a request id. Watch where it went — and how the answer came back.
The map draws itself from your logs. hopscope is a small local web app: give
it a request id — or the ref 4bf92f35 a user read off an error, a job_key, or an
upload's batch_id — and it pulls every log line carrying that id, then rebuilds
what happened. Every service the lines name becomes a box, every call they record
an arrow with its reply (status and time), laid out left to right from where the
request started. No diagram to draw, no service list to keep up to date: point it
at your logs and trace.
127.0.0.1; refuses any other Host header.SELECT … FROM Log per step against New Relic — with your API
key over New Relic's API, or through your own newrelic CLI — and nothing else.A request id only pays off if you can follow it. With one id on every line, a
single query returns the whole story — but as a flat list of lines from a dozen
services, out of order (an edge proxy logs when the response leaves, i.e. last),
with the background work it queued living under different ids. hopscope puts
the lines back in call order, pairs every call with its reply, follows the links
to the queued work, and draws the services it all passed through.
No clone, no install — one command (needs Node 20+):
NEW_RELIC_API_KEY=NRAK-… NEW_RELIC_ACCOUNT_ID=1234567 npx github:FailproofAI/hopscope
It starts on http://127.0.0.1:7878 and opens your browser. Paste a request id, a
ref, a job_key or a batch_id and press enter. Or open straight onto one:
npx github:FailproofAI/hopscope 4bf92f35
New Relic access — either of:
NRAK-…) that can query your
account's logs, in NEW_RELIC_API_KEY. Set NEW_RELIC_ACCOUNT_ID too, unless the
key can see exactly one account. EU accounts: NEW_RELIC_REGION=EU.hopscope runs your own
newrelic CLI, which signs in with its
own profile (newrelic profile add once). hopscope never sees that key.| option | default | |
|---|---|---|
[id] |
— | a request id, ref, job_key or batch_id to open straight away |
--account |
$NEW_RELIC_ACCOUNT_ID, then the only account the key sees, then the CLI's default profile |
New Relic account id |
--profile |
— | newrelic CLI profile name (CLI mode) |
--config |
none | rename, relabel, re-kind, pin or regroup boxes (optional — see below) |
--port |
7878, or the next free one |
port on 127.0.0.1 |
--no-open |
— | don't open a browser (also skipped when CI is set) |
?q=<id>&range=24h in the URL deep-links a trace; add &map=session to open on
everything seen this session. From a checkout, node bin/hopscope.mjs does the
same as npx.
| input | example | searches |
|---|---|---|
| request id | 4bf92f3577b34da6a3ce929d0e0e4736 |
both spellings (plain and dashed-UUID), and as a batch id |
| UUID | 4bf92f35-77b3-4da6-a3ce-929d0e0e4736 |
same as above |
| ref / prefix | ref 4bf92f35, 4bf92f35 |
any id starting with it; if several match you pick one |
| traceparent | 00-4bf9…4736-00f067aa0ba902b7-01 |
its trace id |
| job key | export:42, task:<uuid>, <kind>:<id…> |
the request that queued the job, and every request that ran or picked it up |
| batch id | 32 hex | every upload attempt of that batch |
Anything else is refused before a query is built — every value that reaches NRQL
has passed an allowlist (hex, dashes, and [A-Za-z0-9._:-] for job keys).
Boxes. A line's box is the service that wrote it: the first of
k8s.container.name, service.name, service_name, container_name, component,
app (or a pod name, with its replica-set hash stripped). A box that wrote nothing
but was reached — an edge forwarded to it, a service called it, a tally counted
calls to it — is drawn dashed. What kind of box it is comes from its lines:
| kind | recognised by |
|---|---|
| client | where the request started: a browser or a CLI by the user agent the first service saw (browser, python client, curl, go client, …), an uploader by batch_id + machine_id, a signed-in user by a user/session attribute, else client |
| edge | an access-log line: Traefik's (RequestPath, DownstreamStatus, Duration, ServiceName) or an Envoy/nginx-shaped one (upstream_cluster/upstream_host, status, duration) |
| service | anything that answers requests (… request received / … request completed) — the default |
| jobs | work queued by a job_key and run later under its own request id: its lines go to a box of their own, api · jobs, joined to the box that queued it by a dashed job arrow |
| datastore | a store a service logged calling (clickhouse query …, redis slow call, slow statement → database), a tally on a completion line (ch_queries + ch_ms → clickhouse, redis_calls → redis, pg_…/db_…), or a store writing in its own format (ClickHouse {query_id} lines) |
| outside | a model provider (provider_request_id, behind an LLM gateway such as LiteLLM when the line names one), a third party (upstream_request_id, the host of its url), an email relay (smtp_host) |
Layout. Columns follow the calls: clients, then the edge, then services by how many hops in, then data stores and outside services. A jobs box sits under the box that queued it. Within a column boxes are ordered by where their neighbours are, and packed into rows so nothing overlaps. Arrows that skip a column are routed through its gaps. The whole layout is deterministic: the same trace draws the same.
This request / seen this session. The map shows the current trace; the toggle
switches to the union of every trace since hopscope started — the system filling
in as you trace, with the current request lit on top. It lives in memory only.
job_key (work this request queued
or picked up) and every batch_id (other attempts of the same upload). One query.A call is only drawn from what was logged, and its reply only from a line that recorded it. A call whose reply nobody logged is drawn grey and dashed — "no reply logged" — never guessed. A caller that wrote no line of its own is named from the best evidence and marked inferred.
| hop | from these lines |
|---|---|
| client → edge → service | the edge's access line: StartUTC + Duration (ns), DownstreamStatus; OriginDuration, OriginStatus, ServiceName for the edge → service leg |
| a service answering | … request received / … request|route completed|finished|abandoned with status and latency_ms (or elapsed_ms, duration_ms); route: "POST /x" works too |
| service → service | a line with the call's url (status, elapsed_ms) when the caller logged it; otherwise the callee's request, attributed to the box whose own request was open around it (or the box the edge forwarded to) |
| service → datastore | <store> query … lines (elapsed_ms, query_id = <request_id>-<n>) and the store's own {<request_id>-<n>} lines; the rest from tallies on the completion line (<p>_queries or <p>_calls + <p>_ms), one nested call per store |
| slow calls | slow statement (elapsed_secs), <store> slow call (elapsed_ms) |
| gateway → provider | <gateway> … (status, provider_request_id) |
| third parties | upstream_request_id (+ url), smtp_host |
GET /api/trace returns them as calls, and the drawn map as map:
{
  "id": "…#4", "group": "<request id>", "request_id": "…", "parent": "…#2", "depth": 2,
  "from": "web", "to": "api", "method": "POST", "path": "/queries/run",
  "t_start": 1790773640158, "t_end": 1790773640403, "latency_ms": 245,
  "status": 400, "ret": "client",          // ok · client (4xx or slow) · error · unknown
  "callee_ms": 231,                        // the callee's own view of the same call
  "summary": { "ch_queries": 1, "ch_ms": 170 },
  "inferred": false                        // true: the caller wrote no line for it
}
| attribute | meaning |
|---|---|
request_id |
32 lowercase hex (a W3C trace id) or a dashed UUID — the id of one request; also read from request_X-Request-Id, TraceId, request_id=… in plain text, and ClickHouse {<id>-<n>} |
job_key |
<kind>:<id> — a stable name for one queued job, logged by the request that queued it and by the worker that ran it |
batch_id, machine_id |
one upload batch (the same across retries), and the machine it came from |
pass |
on background work: which job or periodic task |
status, latency_ms / elapsed_ms |
a reply and how long it took |
url, provider_request_id, upstream_request_id, query_id |
a call out: to another service, a model provider, a third party, a datastore |
| service name | k8s.container.name, service.name, service_name, … (configurable) |
ref marked), end-to-end time, calls (and how many have
no logged reply), services, requests and errors.200 · 52 ms (green ok, amber client error or slow, red failure, grey not
logged). Calls nest inside the call that made them. Work handed on by a
job_key runs as its own block below, joined to the line that queued it.3·5 ↩ 202) and a thin dashed reply line beside it.
Replay sends a packet out along each call and back along its reply, in step with
the sequence.Nothing needs configuring. When you want to rename, merge, relabel or pin boxes,
pass --config my.json — see examples/nodes.example.json:
{
  "serviceFields": ["k8s.container.name", "service.name"], // which attribute names the service
  "rename": { "api-canary": "api" },                         // fold services into one box
  "labels": { "api": "orders api" },                         // what a box says
  "kinds": { "gateway": "edge" },                            // when the lines don't make it plain
  "groups": { "services": "prod · eu-west-1" },              // frame labels: clients · services · data
  "positions": { "api": { "x": 300, "y": 80 } },             // pin boxes; pin all to fix the layout
  "tallies": { "sql": "postgres" },                          // <prefix>_queries → which store
  "rules": [{ "node": "db", "service": "^api$", "msg": "^slow query" }] // move matching lines to a box
}
The UI follows the FailproofCloud dashboard's design language (dark surfaces,
hairline borders, one pink accent, status colour only for what a reply said),
rebuilt in plain HTML, CSS and SVG — no framework, no build step. It is set in
Geist Mono (SIL Open Font License 1.1; bundled in public/fonts/, licence in
public/fonts/OFL.txt). Nothing is loaded from the internet at runtime.
127.0.0.1 only and answers only to a localhost / 127.0.0.1 Host
header, so a web page you visit cannot DNS-rebind to it and query your logs.NEW_RELIC_API_KEY the key goes only in the
API-Key header of calls to New Relic's GraphQL API (never a URL, never a log);
without it, hopscope runs your newrelic CLI via execFile (no shell) and holds
no credentials at all. Either way it only runs SELECT … FROM Log — it never writes.node --test # id parsing and injection attempts, boxes and kinds, round trips, layout, config
Layout: bin/ CLI · src/ids.mjs input parsing · src/sources/newrelic.mjs New Relic ·
src/mapping.mjs line → box · src/calls.mjs calls and replies · src/trace.mjs
following links, boxes and arrows · src/layout.mjs where each box goes ·
src/topology.mjs conventions and config · src/server.mjs the local server and
session map · public/index.html the whole UI.
FailproofAI/hopscope is a public repo on GitHub by FailproofAI. Follow one request id across your services, from your logs: every call and its reply, on a map that draws itself.
It declares the MIT license on GitHub.
Its maker has not tagged a system, so it is unknown here. Its README says what it needs.
Open "Take it" on its page: Take My Repo writes an install plan for your machine and hands it to your AI agent (Claude Code, Codex or Cursor), which asks you before each step. Take My Repo has not tested it on any machine.
Its last change on GitHub was on 2026-09-30. Take My Repo does not judge from that whether it is maintained.
Nobody has reviewed it on Take My Repo yet, which says nothing about its quality.
Observability and enforcement for AI agent harnesses. Capture every run and runtime reliability with policy enforcement.
Runtime for building and managing AI agents and Workflows. Easy to learn, fast to build, High Performance, Reliable by design, Intuitive UI, Production Ready.
Architectural standards and best practices for building reliable AI Agents and LLM workflows. Defining the framework for AI Reliability Engineering (AIRE).
Browser-driven Hacker News automation for failproofai, run from Claude Code via browser-use over CDP. Sibling to claude-reddit.
Jev Buildathon: four imperfect agents to steer with Jev evals and policies