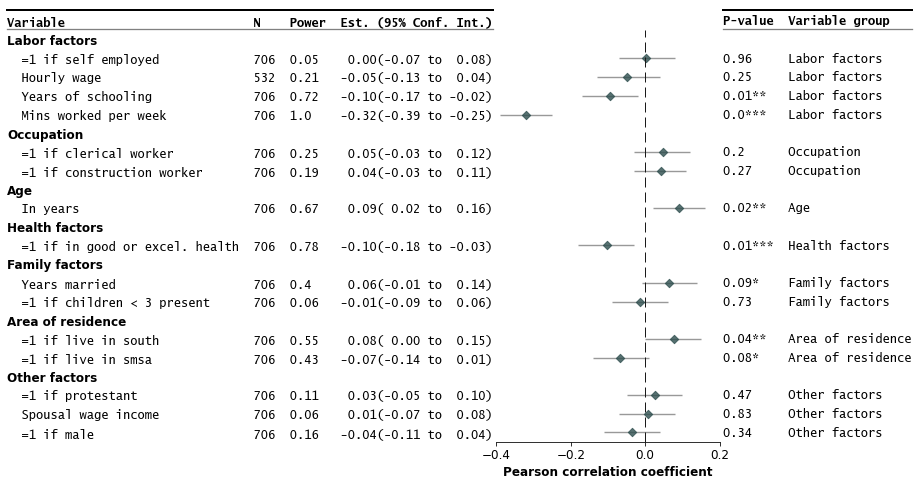
A Python package to make publication-ready but customizable coefficient plots.
Repo LSYS/forestplot, read from GitHub 22 h ago. LSYS has not joined Take My Repo.
Full Changelog: v0.4.0...v0.4.1
forestplot is a Python package to make publication-ready but customizable coefficient plots.
To install via PyPI:
pip install forestplotQuickstart:
import forestplot as fp df_mmodel = pd.read_csv("../examples/data/sleep-mmodel.csv").query( "model=='all' | model=='young kids'" ) fp.mforestplot( dataframe=df_mmodel, estimate="coef", ll="ll", hl="hl", varlabel="label", capitalize="capitalize", model_col="model", color_alt_rows=True, groupvar="group", table=True, rightannote=["var", "group"], right_annoteheaders=["Source", "Group"], xlabel="Coefficient (95% CI)", modellabels=["Have young kids", "Full sample"], xticks=[-1200, -600, 0, 600], mcolor=["#CC6677", "#4477AA"], # Additional kwargs for customizations **{ "markersize": 30, # override default vertical offset between models (0.0 to 1.0) "offset": 0.35, "xlinestyle": (0, (10, 5)), # long dash for x-reference line "xlinecolor": ".8", # gray color for x-reference line }, )
Full Changelog: v0.3.3...v0.4.0
varlabel (closes #76, closes #81).varlabel (closes #76, closes #81) and PyCharm (closes #80).forestplot is a Python package to make publication-ready but customizable coefficient plots.
To install via PyPI:
pip install forestplotQuickstart:
import forestplot as fp df = fp.load_data("sleep") # companion example data fp.forestplot(df, # the dataframe with results data estimate="r", # col containing estimated effect size ll="ll", hl="hl", # columns containing conf. int. lower and higher limits varlabel="label", # column containing variable label ylabel="Confidence interval", # y-label title xlabel="Pearson correlation" # x-label title )
Full Changelog: v0.3.2...v0.3.3
forestplot is a Python package to make publication-ready but customizable coefficient plots.
To install via PyPI:
pip install forestplotQuickstart:
import forestplot as fp df = fp.load_data("sleep") # companion example data fp.forestplot(df, # the dataframe with results data estimate="r", # col containing estimated effect size ll="ll", hl="hl", # columns containing conf. int. lower and higher limits varlabel="label", # column containing variable label ylabel="Confidence interval", # y-label title xlabel="Pearson correlation" # x-label title )
Full Changelog: v0.2.2...v0.3.2
No user-facing changes.
Pandas append API in the backend is deprecated and so replaced by concat. This should accommodate newer versions of Pandas, like the recent v2.0 release.
forestplot is a Python package to make publication-ready but customizable coefficient plots.
To install via PyPI:
pip install forestplotQuickstart:
import forestplot as fp df = fp.load_data("sleep") # companion example data fp.forestplot(df, # the dataframe with results data estimate="r", # col containing estimated effect size ll="ll", hl="hl", # columns containing conf. int. lower and higher limits varlabel="label", # column containing variable label ylabel="Confidence interval", # y-label title xlabel="Pearson correlation" # x-label title )
Full Changelog: v0.2.2...v0.3.1
Main user-facing change is that no drawing of CI (confidence intervals) is now possible.
ll and hl options are no longer requiredforestplot is a Python package to make publication-ready but customizable coefficient plots.
To install via PyPI:
pip install forestplotQuickstart:
import forestplot as fp df = fp.load_data("sleep") # companion example data fp.forestplot(df, # the dataframe with results data estimate="r", # col containing estimated effect size ll="ll", hl="hl", # columns containing conf. int. lower and higher limits varlabel="label", # column containing variable label ylabel="Confidence interval", # y-label title xlabel="Pearson correlation" # x-label title )
No CI:
fp.forestplot(df, # the dataframe with results data estimate="r", # col containing estimated effect size varlabel="label", # column containing variable label )
See the README for more customizations.
Full Changelog: v0.2.2...v0.3.0