
PySimpleGUI-Photo-Colorizer
Transform black and white images (or your webcam) into beautifully colored images using Deep Learning. Uses OpenCV and Numpy to Colorize your photo or webcam video. GUI provided by PySimpleGUI.
- 178
- Python
Use a REPL while your program executes. Watch what's happening, change variables, execute code
Repo PySimpleGUI/LiveREPL, read from GitHub 1 min ago. PySimpleGUI has not joined Take My Repo.
PySimpleGUI/LiveREPL is a public repo on GitHub by PySimpleGUI. Use a REPL while your program executes. Watch what's happening, change variables, execute code. It declares the GPL-3.0 license on GitHub. It is written mainly in Python, has 16 stars and last changed on 2022-04-24. Nobody has reviewed it on Take My Repo yet, which says nothing about its quality. Read from GitHub on 2026-11-18.
It's 2019 and this project is still actively developed.

A "live debugger". It was developed to help debug PySimpleGUI based programs, but it can be used to debug any program including non-GUI programs. PySimpleGUI is the only requirement.
With this "debugger" you can:
All of this is done using separate windows from your primary application.

Installation is via pip:
pip install LiveREPL
or if you need to upgrade later:
pip install --upgrade --no-cache-dir LiveREPL
Note that you MUST install the debugger using pip rather than downloading. It depends on other packages and the pip install will make sure they are installed properly.
So, don't forget: You must pip install LiveREPL in order to use it.
There are 3 lines of code to add to a program in order to make it debugger ready - The import, a "show debugger window" call, and a "refresh debugger windows" call.
It's your application's job to periodically call a "refresh" function. The more frequently you call the refresh, the more quickly your commands/actions will be executed. If you refresh once a second, then it could be
import LiveREPL
import time

# LiveREPL.show_debugger_window()    # Uncomment if you want to immediately display the debug window

counter = 0     # Some variable for you to watch / changing
# Using a loop in order to call the debugger refresh function on a periodic basis
while True:
  LiveREPL.refresh_debugger()
    time.sleep(.1)          # Simulating doing a bunch of work
    # Using the counter to trigger the debug window display. You can use something else as your trigger.
    if counter == 20:
      LiveREPL.show_debugger_window()
    # do something with a variable that we can see/modify
    print(counter)
    counter += 1
You can use LiveREPL with any of the PySimpleGUI ports. The only requirement is that you call the refresh function periodically. Adding it to your PySimpleGUI event loop is a good way of doing that. Make sure you are not blocking on your Window.read() calls by adding a timeout.
Here is an entire program that is debugged using LiveREPL:
import PySimpleGUI as sg
# import PySimpleGUIQt as sg        # can use with the Qt port too
import LiveREPL  # STEP 1

"""
    Demo program that shows you how to integrate the PySimpleGUI Debugger
    into your program.
    This particular program is a GUI based program simply to make it easier for you to interact and change
    things.

    In this example, the debugger is not started initiallly. You click the "Debug" button to launch it
    There are THREE steps, and they are copy and pastes.
    1. At the top of your app to debug add
            import LiveREPL
    2. When you want to show a debug window, call one of two functions:
        LiveREPL.show_debug_window()
        LiveREPL.show_popout_window()
    3. You must find a location in your code to "refresh" the debugger.  Some loop that's executed often.
        In this loop add this call:
        LiveREPL.refresh()
"""
sg.change_look_and_feel('BlueMono')
layout = [
    [sg.T('A typical PSG application')],
    [sg.In(key='_IN_')],
    [sg.T('        ', key='_OUT_', size=(30, 1))],
    [sg.Radio('a', 1, key='_R1_'), sg.Radio('b', 1, key='_R2_'), sg.Radio('c', 1, key='_R3_')],
    [sg.Combo(['c1', 'c2', 'c3'], size=(6, 3), key='_COMBO_')],
    [sg.Output(size=(50, 6))],
    [sg.Ok(), sg.Exit(), sg.Button('Debug'), sg.Button('Popout')],
]

window = sg.Window('This is your Application Window', layout)

counter = 0
timeout = 100

while True:  # Your Event Loop
    event, values = window.read(timeout=timeout)
    if event in (None, 'Exit'):
        break
    elif event == 'Ok':
        print('You clicked Ok.... this is where print output goes')
    elif event == 'Debug':
      LiveREPL.show_debugger_window()  # STEP 2
    elif event == 'Popout':
      LiveREPL.show_debugger_popout_window()  # STEP 2
    counter += 1
    # to prove window is operating, show the input in another area in the window.
    window['_OUT_'].update(values['_IN_'])

    # don't worry about the "state" of things, just call this function "frequently"
    LiveREPL.refresh_debugger()  # STEP 3 - refresh debugger

window.close()
There are 2 primary GUI windows the debugger has to show.
The main debug window is displayed by calling:
LiveREPL.show_debugger_window()
This will display the Primary / Main Debug Window, starting on its "Variables" Tab. The main debug window has 2 tabs one for variable watches the other for REPL and expression watches.

Like all of the LiveREPL debugger windows, this window is refreshed every time your application calls the refresh function LiveREPL.refresh_debugger()
Here you can see up to 8 of your variables and one custom expression. You select which of your variables to see using the "Choose Variables To Auto Watch" buttton. This will bring up this selection window:
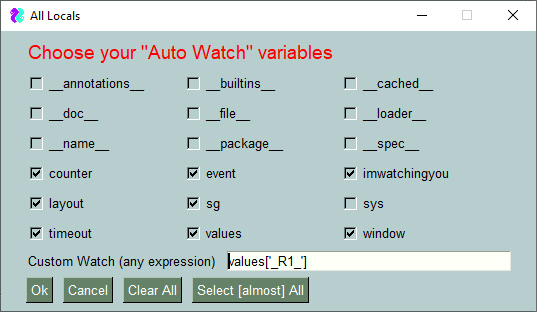
Use this window to check the variables you want to "watch" on the debug screen. This is also where you type in your custom watch.
The is the REPL portion of the debugger You can also examine objects in detail on this page using the "Obj" button. This feature is currently broken / crippled. Will be turning attention to it shortly

The "Popout Debug Window" is the small "Popout" window that floats on top of your other windows and is located in the upper right corner of your display.

Note that this popout window is created in the upper right corner of your screen.
If you right click this window's text (anything that is text), you'll bring up the right click menu which can be used to close the window or to open the main debug window.

This Popout window is displayed in either of these 2 manners:
LiveREPL.show_debugger_popout_window()The most important call you need to make is a LiveREPL.refresh() call.
If debugginer a PySimpleGUI based application, this "refresh" call that must be added to your event loop. Your window.Read call should have a timeout value so that it does not block. If you do not have a timeout value, the debugger will not update in realtime.
If you are debugging a non-PySimpleGUI program, no problem, just put this call somewhere that it will be called several times a second. Or say once a second at minimum. This frequency will determine how quickly the variable values will change in your debug windows.
Add this line to the top of your event loop:
LiveREPL.refresh_debugger()
Your task is to devise a way for your appliction to call the needed 2 or 3 functions.
If you're making a GUI program, then make a hotkey or a button that will call LiveREPL.show_debugger_window() and you're off to the races! You can use the main debugger window to launch the smaller "Popout" variable window.
Or maybe call LiveREPL.show_debugger_popout_window() after the action gets started in your program and then forget about it, glancing up at the window in the corner of your desktop for the current values of all your variables.
Have been working on a version that is integrated direcetly into PySimpleGUI itself (only the tktiner version) that is not officially up and running.
Rebranding to LiveREPL
Why 2.0? So soon? Well, yea. Been working my ass off on this project and a LOT has happened in a short period of time. Major new functionality AND it breaks the APIs badly. That was a major reason for 2.0. Completely different set of calls.
imwatchingyou.show_debug_window()imwatchingyou.show_popout_window()imwatchingyou.refresh()imwatchingyou.show_popout_window()refresh() will automatically refresh the list of available varaiables along with the valuesdebug sole global variable into a class variablemike from PySimpleGUI.org
GNU Lesser General Public License (LGPL 3) +
Copyright 2021 PySimpleGUI
PySimpleGUI/LiveREPL is a public repo on GitHub by PySimpleGUI. Use a REPL while your program executes. Watch what's happening, change variables, execute code.
It declares the GPL-3.0 license on GitHub.
Its maker has not tagged a system, so it is unknown here. Its README says what it needs.
Open "Take it" on its page: Take My Repo writes an install plan for your machine and hands it to your AI agent (Claude Code, Codex or Cursor), which asks you before each step. Take My Repo has not tested it on any machine.
Its last change on GitHub was on 2022-04-24. Take My Repo does not judge from that whether it is maintained.
Nobody has reviewed it on Take My Repo yet, which says nothing about its quality.
PySimpleGUI application / utility to resize your images and encode them to Bas64 format.
A windows front-end for MicroPython development. Provides code uploading and device control to uPython projects.