
superset
Apache Superset is a Data Visualization and Data Exploration Platform
- 76k
- Python
- Apache-2.0
- 5 h ago
A Python library for moderation, mediation and conditional process analysis.
Repo QuentinAndre/pyprocessmacro, read from GitHub 18 min ago. QuentinAndre has not joined Take My Repo.
QuentinAndre/pyprocessmacro is a public repo on GitHub by QuentinAndre. A Python library for moderation, mediation and conditional process analysis. It declares the MIT license on GitHub. It is written mainly in Python, has 105 stars and last changed on 2026-09-29. Nobody has reviewed it on Take My Repo yet, which says nothing about its quality. Read from GitHub on 2026-11-22.
The Process Macro for SAS and SPSS, and its associated files, are copyrighted by Andrew F. Hayes. The original code must not be edited or modified, and must not be distributed outside of http://www.processmacro.org.
Because PyProcessMacro is a complete reimplementation of the Process Macro, and was not based on the original code, permission was generously granted by Andrew F. Hayes to distribute PyProcessMacro under a MIT license.
This permission is not an endorsement of PyProcessMacro: all potential errors, bugs and inaccuracies are my own, and Andrew F. Hayes was not involved in writing, reviewing, or debugging the code.
The Process Macro by Andrew F. Hayes has helped thousands of researchers in their analysis of moderation, mediation, and conditional processes. Unfortunately, Process was only available for proprietary softwares (SAS and SPSS), which means that students and researchers had to purchase a license of those softwares to make use of the Macro.
Because of the growing popularity of Python in the scientific community, I decided to implement the features of the Process Macro into an open-source library, that researchers will be able to use without relying on those proprietary softwaress. PyProcessMacro is released under a MIT license.
In the current version, PyProcessMacro replicates the following features from the original Process Macro v2.16:
tests/test_models_accuracy.py). The 42 models that PROCESS 5 still defines are also compared to the
output of PROCESS for R 5.0 (see tests/test_process5.py); section 1.I says which defaults changed between
PROCESS 2 and PROCESS 3 and how to match either.The following changes and improvements have been made from the original Process Macro:
family="negbin", the outcome Y is estimated by negative binomial regression (section
1.J). This is not a PROCESS feature.mcx and mcw options and its four coding systems
(section 1.K); the groups may be numbers, strings or a pandas Categorical.In the current version, the following features have not yet been ported to PyProcessMacro:
normal, varorder, ...). PyProcessMacro will issue a warning to tell you if an option you are
trying to use is not implemented.Version 2.0 corrects several statistics and tightens input handling. Reported numbers change in these ways:
*_index_summary() methods raise NotImplementedError for those models.Behaviour that used to be silent now speaks up:
modval, or a keyword argument that is neither a variable nor an option, raises an error
instead of being ignored.jn, effsize, mc, normal, ...) raise a visible UserWarning.pyprocessmacro.ConvergenceError. Bootstrap resamples
that fail are counted, and the bootstrap stops with an error if more resamples fail than were requested.Removed and added:
plot_direct_effects() and plot_indirect_effects() are removed; use plot_conditional_direct_effects()
and plot_conditional_indirect_effects().cov_type selects the OLS covariance estimator ("standard", "HC0", "HC1", "HC2" or "HC3");
hc3=True remains as shorthand for "HC3".seed=None draws a different bootstrap sample on every run, and seed=0 is accepted.Process.dv names the outcome variable (iv is kept for compatibility).See CHANGELOG.md.
Various doc and bug fixes In particular, the Moderated Mediation index (MM_index_summary()) was not displayed.
Bug fix on plot_conditional_(in)direct effects An error warning was unnecessarily generated for some variable names. This has now been fixed.
Bug fix on newer numpy version A recent numpy version was causing PyProcessMacro to crash on non-float data. Thanks to William Harding for the bug report and for the fix.
Bug fix for standard error estimate in all models
PyProcessMacro was, by default, using the HC3 estimator for the variance-covariance matrix instead of the standard (non-robust) estimator.
This has now been changed. To continue using the HC3 estimator, specify hc3=True when initializing the Process instance.
Thanks to Zoé Ziani for the bug report.
Bug fix for Models 58 and 59 The number of moderators was not properly computed, and pyprocessmacro was crashing on those two models. It has now been fixed. Thanks to amrain-py for the bug report.
Bug fix in the Index of Moderated Moderated Mediation In the summary, the Index of Moderated Moderated Mediation was reported as a zero-width confidence interval.
Added support for floodlight analysis (Johnson-Neyman region of significance).
The methods floodlight_direct_effect() and floodlight_indirect_effect() can now be used to find the range of values
at which an effect is significant. See the documentation for more information on those methods.
Added methods: spotlight_direct_effect() and spotlight_indirect_effect().
Those methods can be used to compute the conditional (in)direct effects of the models at various levels of the moderators.
Deprecation of plot_direct_effects() and plot_indirect_effects().
Those methods have been deprecated in favor of plot_conditional_direct_effects() and
plot_conditional_indirect_effects() respectively.
The signature of the function has also changed: the argument mods_at has been renamed modval for consistency with
other functions. Under the hood, those functions are faster and are using the newly introduced
spotlight_direct_effect() and spotlight_indirect_effect() methods.
First beta release.
This section will familiarize you with the few differences that exist between Process and PyProcessMacro.
PyProcessMacro requires Python 3.11 or newer. You can install it with pip:
pip install pyprocessmacro
The basic syntax for PyProcessMacro is the following:
from pyprocessmacro import Process
import pandas as pd
df = pd.read_csv("MyDataset.csv")
p = Process(data=df, model=13, x="Effort", y="Success", w="Motivation", z="SkillRelevance",
            m=["MediationSkills", "ModerationSkills"])
p.summary()
As you can see, the syntax for PyProcessMacro is (almost) identical to that of Process. Unless this documentation mentions otherwise, you can assume that all the options/keywords from Process exist in PyProcessMacro.
A Process object is initialized by specifying a data source, the model number, and the mapping between the symbols
and the variable names.
Once the object is initialized, you can call its summary() method to display the estimation results
The standardized result tables (tidy(), glance(), augment()) are described in section 6.
You might have noticed that there is no argument varlist in PyProcessMacro. This is because the list of variables
is automatically inferred from the variable names given to x, y, m.
In Process, the controls are defined as "any argument in the varlist that is not the IV, the DV, a moderator, or a mediator." In PyProcessMacro, the list of variables to include as controls have to be explicitely specified in the "controls" argument.
The equation(s) to which the controls are added is specified through the controls_in argument:
x_to_m means that the controls will be added in the path from the IV to the mediator(s) only.all_to_y means that the controls will be added in the path from the IV and the mediators to the DV only.all means that the controls will be added in all equations.The ability to specify a different list of control for each equation is coming in the next release of PyProcessMacro.
p = Process(data=df, model=13, x="Effort", y="Success", w="Motivation", z="SkillRelevance",
            m=["MediationSkills", "ModerationSkills"],
            controls=["Control1", "Control2"],
            controls_in="all")
p.summary()
The original Process Macro automatically uses a Logistic (instead of OLS) regression when it detects a binary outcome.
PyProcessMacro prefers a more explicit approach, and requires you to set the parameter logit to True if your DV
should be estimated using a Logistic regression.
p = Process(data=df, model=13, x="Effort", y="Success", w="Motivation", z="SkillRelevance",
            m=["MediationSkills", "ModerationSkills"], logit=True)
p.summary()
It goes without saying that this will return an error if your DV is not dichotomous.
The spotlight values of the moderators follow the spotlight option (section 1.I says which PROCESS release each
rule is the default of):
spotlight="moments" (the default, and the PROCESS 2 rule): a continuous moderator is probed at M - 1SD, M and
M + 1SD, where M and SD are its mean and standard deviation.spotlight="percentiles" (the PROCESS 3 and later rule): a continuous moderator is probed at its 16th, 50th and
84th percentiles, computed as PROCESS does.spotlight="quantiles" (or quantile=True, the quantile option of PROCESS 2): the 10th, 25th, 50th, 75th and
90th percentiles."moments" and "quantiles" a
moderator with at most five distinct values is probed at each of them.In Process, custom spotlight values can be applied to each moderator q, v, z, ... through the arguments qmodval, vmodval, zmodval...
In PyProcessMacro, the user must instead supply custom values for each moderator in a dictionary
passed to the modval parameter:
p = Process(data=df, model=13, x="Effort", y="Success", w="Motivation", z="SkillRelevance",
            m=["MediationSkills", "ModerationSkills"],
            modval={
                "Motivation":[-5, 0, 5], # Moderator 'Motivation' at values -5, 0 and 5
                "SkillRelevance":[-1, 1] # Moderator 'SkillRelevance' at values -1 and 1
            })
p.summary()
When the Process object is initialized by Python, it displays various information about the model (model number, list of
variables, sample size, number of bootstrap samples, etc...). If you wish not to display this information, just add the
argument suppr_init=True when initializing the model.
p = Process(data=df, model=13, x="Effort", y="Success", w="Motivation", z="SkillRelevance",
            m=["MediationSkills", "ModerationSkills"], suppr_init=True)
p.summary()
By default, the standard errors of the OLS outcome models use the standard (homoskedastic) estimator. The
cov_type argument selects a heteroskedasticity-consistent estimator instead: "HC0", "HC1", "HC2" or
"HC3". hc3=True is shorthand for cov_type="HC3", which is what the original Process macro uses when
hc3=1 is specified. Logistic outcome models always use the inverse of the Hessian.
p = Process(data=df, model=4, x="Effort", y="Success", m=["MediationSkills"], cov_type="HC3")
In Model 6 the mediators form a chain: each mediator depends on X and on the mediators before it, and Y depends
on X and on every mediator. Pass two to four mediators in causal order. PyProcessMacro reports the specific
indirect effect through every ordered subset of mediators (three paths for two mediators, seven for three,
fifteen for four), labelled by the path, plus the total and the pairwise contrasts when total=True and
contrast=True.
p = Process(data=df, model=6, x="Effort", y="Success", m=["Attention", "MediationSkills"], total=True)
p.summary()
Model 6 has no moderators, so the spotlight, floodlight and plotting methods do not apply to it. Its estimates are checked against the PROCESS 2.16 and PROCESS 5.0 output files for Model 6, against products of statsmodels coefficients and against an independent resampler.
With effsize=True, PyProcessMacro also reports the partially standardized indirect effect (the indirect effect
divided by the standard deviation of Y) and the completely standardized indirect effect (further multiplied by the
standard deviation of X), each with a bootstrap confidence interval computed by standardizing within every resample,
as PROCESS does. The option applies to unmoderated indirect paths with a continuous outcome, that is Models 4 and 6
with logit=False.
p = Process(data=df, model=4, x="Effort", y="Success", m=["MediationSkills"], effsize=True)
p.indirect_model.effect_size_summary()
PyProcessMacro's defaults are those of PROCESS 2.16, the release its accuracy tests were written against. PROCESS 3.0 (December 2017) changed three of them, and no later release changed them again (Hayes's release notes for 3.0 to 5.0; the sources are listed in issue #90):
| PROCESS 2 (PyProcessMacro default) | PROCESS 3 and later | Option | |
|---|---|---|---|
| Bootstrap confidence intervals | bias-corrected | percentile | percent=True |
| Spotlight values of a continuous moderator | mean and one SD either side | 16th, 50th and 84th percentiles | spotlight="percentiles" |
| Conditional effects of Models 1 to 3 | always reported | reported when the interaction's p is at most 0.10 | intprobe=0.10 |
To reproduce an analysis run with PROCESS 3, 4 or 5, pass percent=True and spotlight="percentiles".
intprobe only changes whether the conditional-effects table of a moderation-only model is printed; the table
stays available from direct_model.coeff_summary(). The initialization banner and the first line of summary()
state the conventions in force and the release each is the default of, so a saved output says how its numbers
were produced. The bootstrap draws themselves cannot match PROCESS's, whose SPSS, SAS and R versions use different
random generators, so bootstrap intervals agree within Monte Carlo error only.
Models 23 to 27 and 30 to 57 (third and fourth moderators) were retired in PROCESS 3.0 and Model 74 in PROCESS
4.0, and none exists in PROCESS 5. PyProcessMacro estimates them as PROCESS 2.16 defined them, so that older
results remain reproducible, and says so in a note that is also raised as a UserWarning.
p = Process(data=df, model=7, x="Effort", y="Success", w="Motivation", m=["MediationSkills"],
            percent=True, spotlight="percentiles")
p.summary()  # starts with: Bootstrap intervals: percentile (PROCESS 3 and later default). Moderators at the ...
The PROCESS 2 defaults stay through the 2.x releases; 3.0 will switch percent and spotlight to the PROCESS 3
values.
PROCESS estimates continuous outcomes by OLS and binary outcomes by logistic regression. PyProcessMacro adds a
third estimator for the outcome Y, which PROCESS does not offer: with family="negbin", Y is a count and its
equation is a negative binomial regression (NB2, log link: the variance of Y is its mean plus alpha times the
mean squared), estimated by maximum likelihood. The mediator equations stay OLS, as in PROCESS. family="logit"
is the same as logit=True, and family="ols" is the default.
p = Process(data=df, model=4, x="Effort", y="Complaints", m=["Frustration"], family="negbin")
p.summary()
The coefficients of the Y equation are on the log-count scale, with Wald z tests, and the dispersion alpha is
reported in the model summary (its standard error is in estimation_results["alpha_se"]). As with a logistic
outcome, the direct effect is the coefficient of X in the Y equation and the indirect effect is the product of
the OLS a path and the negative binomial b path, so it lives on the log-count scale of Y. Interpret it with the
same care as PROCESS's logistic case: it multiplies a linear coefficient by one on a nonlinear scale, and a
counterfactual definition of the effects is not implemented. effsize is not available, since the standardized
effects assume a continuous outcome. The bootstrap refits the negative binomial on every resample; resamples on
which it does not converge are discarded and counted, as for logistic outcomes. glance() reports alpha and
the McFadden pseudo R-squared, augment() the predicted counts and response residuals, and to_statsmodels()
the statsmodels.NegativeBinomial refit for diagnostics. The first line of summary() says that this estimator
is an extension, so a saved output cannot be mistaken for PROCESS output.
mcx, mcw)A categorical X with three to nine groups is declared with mcx, and a categorical moderator with mcw (mcz,
mcv and mcq for the other moderator symbols of the 2.16 numbering; in Models 1 to 3 the moderator passed as
m is W). The value names PROCESS's coding system: 1 or "indicator" (dummy codes against the group with the
smallest value), 2 or "sequential", 3 or "helmert", 4 or "effect". The groups may be numbers,
strings or a pandas Categorical; they are ordered by their sorted values, and every group needs at least two
cases.
p = Process(data=df, model=7, x="Condition", w="Motivation", m=["Attention"], y="Success", mcx="indicator")
p.summary()
X is then represented by g - 1 codes X1, X2, ... whose mapping to the groups is printed at the top of the output,
and everything PROCESS reports per code is reported per code: the relative direct effects, with an omnibus test
of the direct effect (an F test under the covariance estimator in use, or a likelihood-ratio test for a binary or
count outcome), the relative conditional direct effects, the relative indirect and conditional indirect effects,
and one index of moderated mediation per code. In Models 1 to 3 the relative conditional effects come with a test
of equality of the conditional means at each value of the moderator, as PROCESS prints. A categorical moderator
is probed in each of its groups, and the index of moderated mediation is reported per code of the moderator (W1,
W2, ...). The tables carry an X column for the code, tidy() an x_code column, and
spotlight_direct_effect() and spotlight_indirect_effect() return one block per code. effsize=True reports
the partially standardized effects only, as PROCESS does for a multicategorical X.
Not available with a multicategorical variable: the indices of partial, moderated moderated and conditional
moderated mediation (models with two moderators on the indirect path), the floodlight analysis, the plots, and
contrast (which PROCESS refuses too); Model 74 does not take a multicategorical X. Every coding system and the
models 1, 4, 5, 6, 7, 8, 14 and 58 are checked against PROCESS for R 5.0 (tests/Results/v5/mc).
After the Process object is initialized, you are not limited to printing the summary. PyProcessMacro implements the
following methods that allow you to conveniently recover the different estimates of interest:
summary()This method replicates the output that you would see in Process, and displays the following information:
outcome_modelsThis command gives you individual access to each of the outcome models through a dictionary. This allows you to recover the model and parameters estimates for each outcome.
Each OutcomeModel object has the following methods:
summary() prints the full summary of the model (as Process does).model_summary() returns a DataFrame of goodness-of-fit statistics for the model.coeff_summary() returns a DataFrame of estimate, standard error, corresponding z/t, p-value, and
confidence interval for each of the parameters in the model.estimation_results gives you access to a dictionary containing all the statistical information of the
model.p = Process(data=df, model=13, x="Effort", y="Success", w="Motivation", z="SkillRelevance", m=["MediationSkills", "ModerationSkills"], suppr_init=True) model_medskills = p.outcome_models["MediationSkills"] # The model for the outcome "MediationSkills" model_medskills.summary() # Print the summary for this model df_params_med1 = model_medskills.coeff_summary() # Store the DataFrame of estimates into a variable. med1_R2 = model_medskills.estimation_results["R2"] # Store the R² of the model into a variable.
Note that the methods are called from the model_medskills object! If you call p.coeff_summary(),
you will get an error.
direct_modelWhen the Process model includes a mediation, the direct effect model can conveniently be accessed, which gives you access to the following methods:
summary() prints the full summary of the direct effects, as done in calling Process.summary().coeff_summary() returns a DataFrame of estimate, standard error, t-value, p-value, and confidence
interval for each of the (conditional) direct effect(s).p = Process(data=df, model=13, x="Effort", y="Success", w="Motivation", z="SkillRelevance", m=["MediationSkills", "ModerationSkills"], suppr_init=True) direct_model = p.direct_model # The model for the direct effect df_params_direct = direct_model.coeff_summary() # Store the DataFrame of estimates into a variable.
Note that the methods are called from the direct_model object! If you call p.coeff_summary(), you will get an
error.
indirect_modelWhen the Process model includes a parallel mediation, the indirect effect model can be accessed as well, which gives you access to the following methods:
summary() prints the full summary of the indirect effects, and other related indices, as done in
calling Process.summary().coeff_summary() returns a DataFrame of indirect effect(s) and their SE/CI for each of the mediation
pathsMM_index_summary() returns a DataFrame of indices for Moderated Mediation, and their
SE/CI, for each of the mediation paths. If the model does not compute a MM, this will return an error.PMM_index_summary() returns a DataFrame of indices for Partial Moderated Mediation, and their
SE/CI, for each of the moderators and mediation paths. If the model does not compute a PMM, this will return an error.CMM_index_summary() returns a DataFrame of indices for Conditional Moderated Mediation, and their
SE/CI, for each of the moderators and mediation paths. If the model does not compute a CMM, this will return an error.MMM_index_summary() returns a DataFrame of indices for Moderated Moderated Mediation, and their
SE/CI, for each of the mediation paths. If the model does not compute a MMM, this will return an error.p = Process(data=df, model=13, x="Effort", y="Success", w="Motivation", z="SkillRelevance", m=["MediationSkills", "ModerationSkills"], suppr_init=True) indirect_model = p.indirect_model # The model for the direct effect df_params_direct = indirect_model.coeff_summary() # Store the DataFrame of estimates into a variable.
Note that the methods are called from the indirect_model object! If you call p.coeff_summary(), you will get an
error.
Each outcome model can be handed to statsmodels, which refits the same design
matrix with the same covariance estimator and returns the statsmodels results object. From there you get
summary(), custom contrasts with t_test() and wald_test(), heteroskedasticity and influence diagnostics,
variance inflation factors, prediction intervals, and the table formatters that accept statsmodels results.
statsmodels is optional: install it with pip install pyprocessmacro[statsmodels].
p = Process(data=df, model=7, x="Effort", y="Success", w="Motivation", m=["MediationSkills"], suppr_init=True)

fit = p.outcome_models["Success"].to_statsmodels()   # a statsmodels RegressionResults
print(fit.summary())
fit.t_test("Effort + MediationSkills = 0")

fits = p.to_statsmodels()                              # every outcome model, keyed by outcome name
For a different question, statsmodels also ships statsmodels.stats.mediation.Mediation, Imai-style causal
mediation with a sensitivity analysis; it estimates a different quantity and is a useful cross-check rather than
a replacement for the PROCESS approach.
If you wish to display the conditional effects at other values of the moderator(s), you do not have to re-instantiate
the model from scratch, and can instead use the spotlight_direct_effect() and
spotlight_indirect_effect() methods.
df_direct_effects = p.spotlight_direct_effect(modval={
                                    "Motivation":[-1, 0, 1], # Moderator 'Motivation' at values -1, 0 and 1
                                    "SkillRelevance":[-5, 5] # Moderator 'SkillRelevance' at values -1 and 1
            })

df_indirect_effects = p.spotlight_indirect_effect(med_name="MediationSkills", modval={
                                    "Motivation":[-1, 0, 1], # Moderator 'Motivation' at values -1, 0 and 1
                                    "SkillRelevance":[-5, 5] # Moderator 'SkillRelevance' at values -1 and 1
            })
Instead of checking the direct and indirect effects at specific values, you might be interested in identifying under which level of a moderator the effect becomes significant.
floodlight_motiv_direct= p.floodlight_direct_effect(mod_name="Motivation")
floodlight_motiv_indirect = p.floodlight_indirect_effect(med_name="MediationSkills", mod_name="Motivation")
Calling floodlight_motiv_direct or floodlight_motiv_indirect will print out a detailed summary of the region(s) of
significance. Alternatively, you can call floodlight_motiv_direct.get_significance_regions() to get the regions of
positive/negative significance in a dictionary.
The floodlight analysis can only be conducted on one moderator at a time. When multiple moderators are present on the direct/indirect path, the floodlight analysis assumes the value of those other moderators to be zero. However, you can change this behavior by specifying a custom level for the other moderators:
floodlight_motiv_direct= p.floodlight_direct_effect(mod_name="Motivation", other_modval={"SkillRelevance": 1})
floodlight_motiv_indirect = p.floodlight_indirect_effect(med_name="MediationSkills", mod_name="Motivation",
                                                        other_modval={"SkillRelevance": 1})
Here, pyprocessmacro will conduct a floodlight analysis on the effect of MediationSkills when the level of SkillRelevance is set to 1. This is, in essence, a spotlight-floodlight analysis ;).
The original Process macro allows you to save the parameter estimates for each bootstrap sample by specifying the save
keyword. The Macro then returns a new dataset of bootstrap estimates.
In PyProcessMacro, this is done by calling the method get_bootstrap_estimates(), which returns a DataFrame containing
the parameters estimates for all variables in the model, for each outcome.
p = Process(data=df, model=13, x="Effort", y="Success", w="Motivation", z="SkillRelevance",
            m=["MediationSkills", "ModerationSkills"], suppr_init=True)

boot_estimates = p.get_bootstrap_estimates() # Called from the Process object directly.
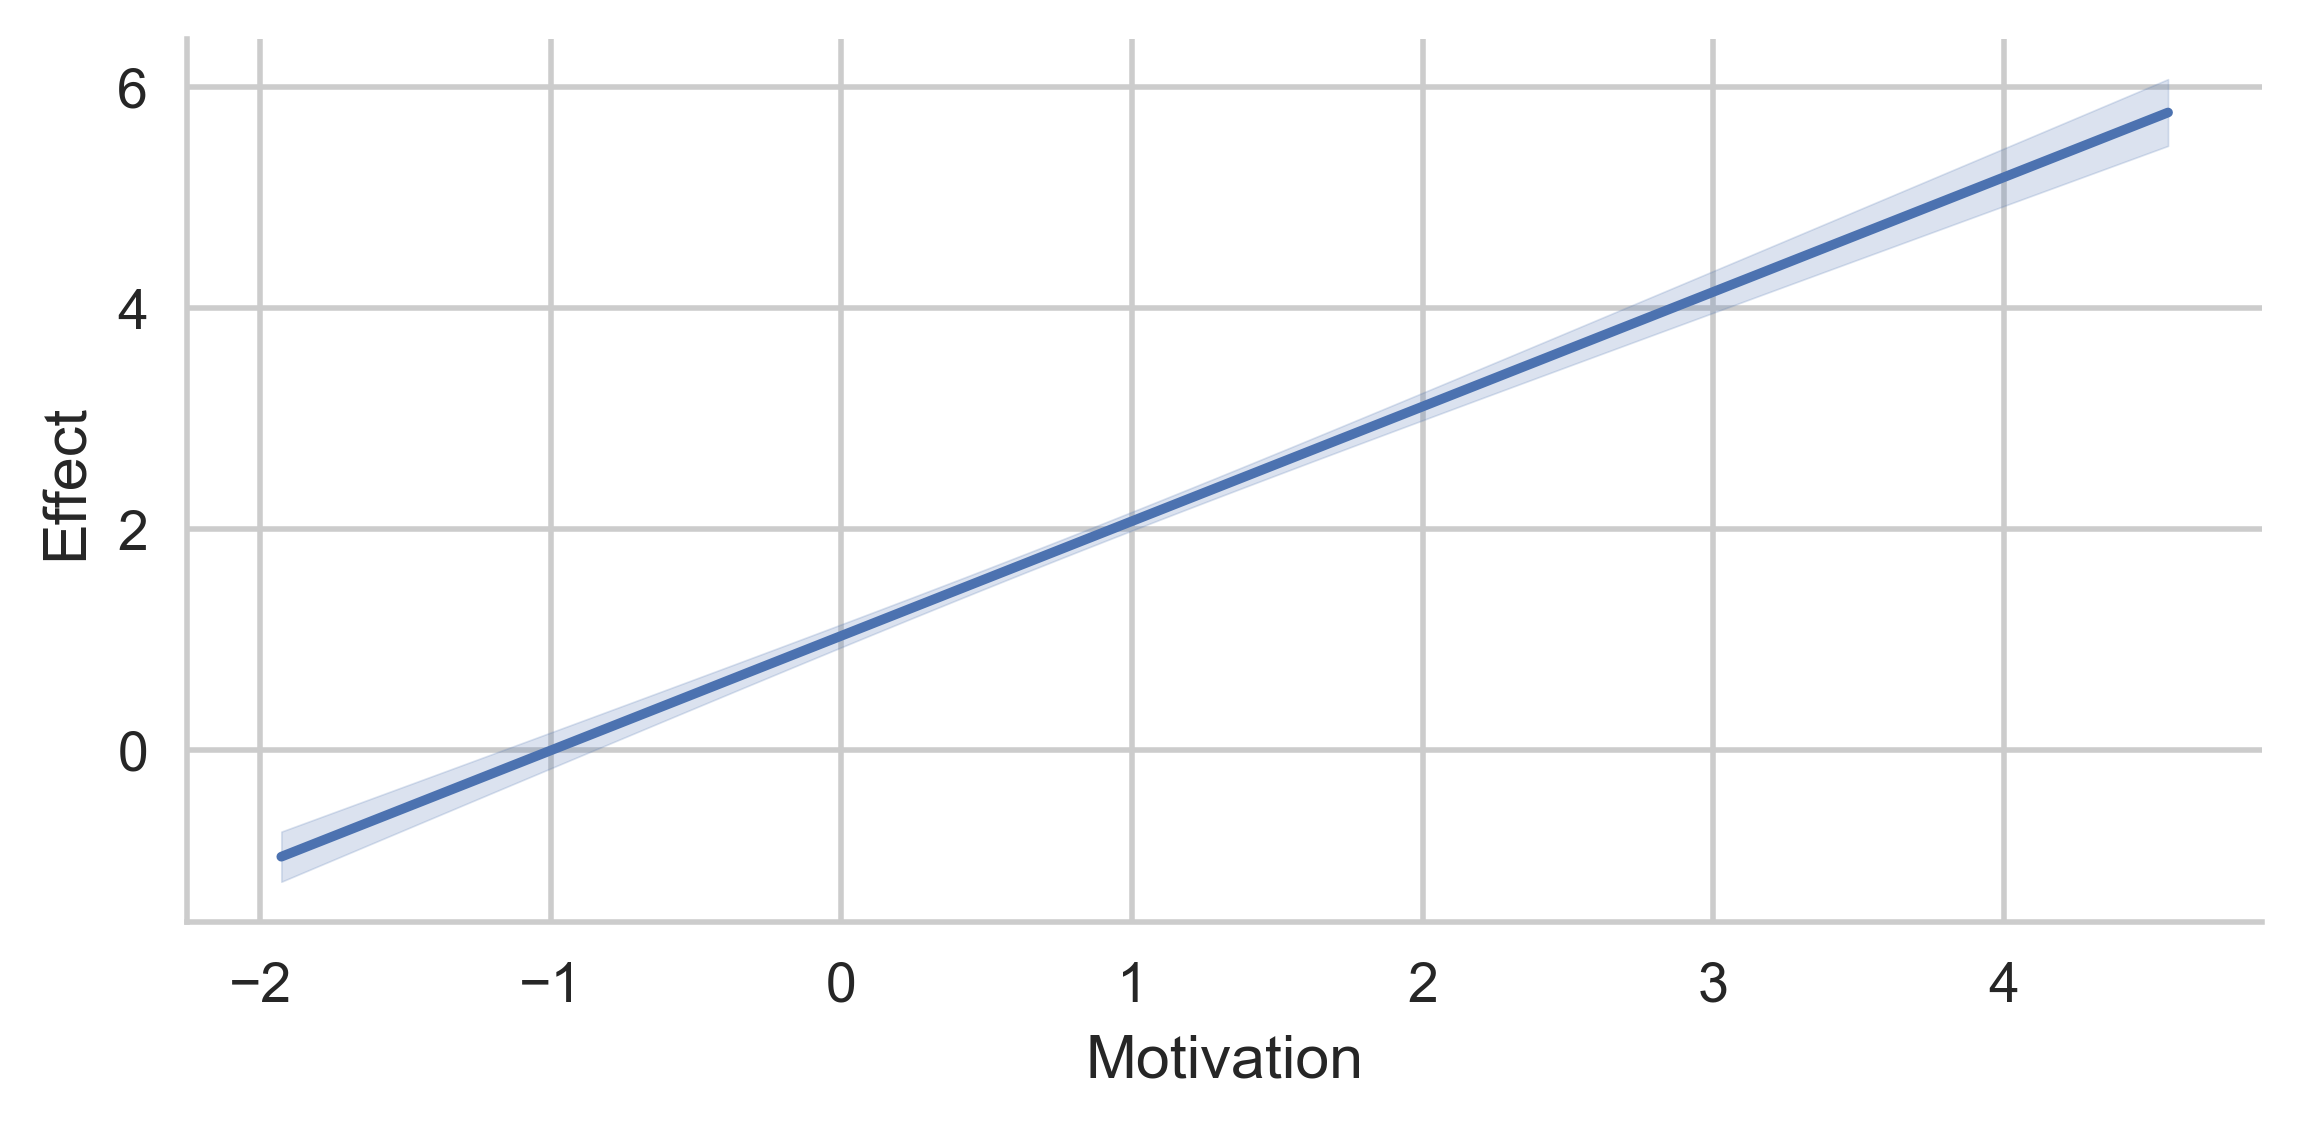
PyProcessMacro allows you to plot the conditional direct and indirect effect(s), at different values of the moderators.
The methods plot_conditional_indirect_effects() and plot_conditional_direct_effects() are identical in syntax,
with one small exception: you must specify the name of the mediator for plot_conditional_indirect_effects as a first argument.
They return a seaborn.FacetGrid object that can be used to further tweak the appearance of the plot.
When plotting conditional direct (and indirect) effects, the effect is always represented on the y-axis.
The various spotlight values of the moderator(s) can be represented on several dimensions:
x).hue).col).row)At the minimum, the x argument is required, while the hue, col and row are optional.
The examples below are showing what the plots could look like for a model with two moderators.
from pyprocessmacro import Process
import pandas as pd
import matplotlib.pyplot as plt

df = pd.read_csv("MyDataset.csv")
p = Process(data=df, model=13, x="Effort", y="Success", w="Motivation", z="SkillRelevance",
            m=["MediationSkills", "ModerationSkills"], suppr_init=True)

# Conditional direct effects of Effort, at values of Motivation (x-axis)
g = p.plot_conditional_direct_effects(x="Motivation")
plt.show()

# Conditional indirect effects through MediationSkills, at values of Motivation (x-axis) and
# SkillRelevance (color-coded)
g = p.plot_conditional_indirect_effects(med_name="MediationSkills", x="Motivation", hue="SkillRelevance")
g.add_legend(title="") # Add the legend for the color-coding
plt.show()

# Display the values for SkillRelevance on side-by-side plots instead.
g = p.plot_conditional_indirect_effects(med_name="MediationSkills", x="Motivation", col="SkillRelevance")
plt.show()

# Display the values for SkillRelevance on vertical plots instead.
g = p.plot_conditional_indirect_effects(med_name="MediationSkills", x="Motivation", row="SkillRelevance")
plt.show()

By default, the spotlight values used to plot the effects are the same as the ones passed when initializing Process.
However, you can pass custom values for some, or all, the moderators through the modval argument.
# Change the spotlight values for SkillRelevance
g = p.plot_conditional_indirect_effects(med_name="MediationSkills", x="Motivation", hue="SkillRelevance",
                            modval={"SkillRelevance": [-5, 5]})
g.add_legend(title="")
plt.show()

The display of confidence intervals for the direct/indirect effects can be customized through the errstyle argument:
errstyle="band" (default) plots a continuous error band between the lower and higher confidence interval. This
representation works well when the moderator displayed on the x-axis is continuous (e.g. age), as it allows you to
visualize the error at all levels of the moderator.errstyle="ci" plots an error bar at each value of the moderator on x-axis. It works well when the moderator
displayed on the x-axis is dichotomous or has few values (e.g. gender), as it reduces clutter.errstyle="none" does not show the error on the plot.# CI for dichotomous moderator g = p.plot_conditional_indirect_effects(med_name="MediationSkills", x="Motivation", hue="SkillRelevance", modval={"Motivation": [0, 1], "SkillRelevance":[-1, 0, 1]}, errstyle="ci")

# Error band for continous moderator
g = p.plot_conditional_indirect_effects(med_name="MediationSkills", x="Motivation", hue="SkillRelevance",
                            modval={"SkillRelevance":[-1, 0, 1]},
                            errstyle="ci")

# No representation of error
g = p.plot_conditional_indirect_effects(med_name="MediationSkills", x="Motivation", hue="SkillRelevance",
                            modval={"SkillRelevance":[-1, 0, 1]},
                            errstyle="none")

plt.show()

So far, the number of moderators supplied as arguments to the plot function was always equal to the number of moderators on the path of interest (1 for the direct path, 2 for the indirect path).
You can also "omit" some moderators, and plot "partial" conditional direct/indirect effects. In that case, the omitted moderators will assume a value of 0 when computing the direct/indirect effects. To make sure that this is intentional, pyprocessmacro will warn you when this happens.
p = Process(data=df, model=13, x="Effort", y="Success", w="Motivation", z="SkillRelevance",
            m=["MediationSkills", "ModerationSkills"], suppr_init=True)

# SkillRelevance is a moderator of the indirect path, but is not mentioned as an argument in the plotting function!
g = p.plot_conditional_indirect_effects(med_name="MediationSkills", x="Motivation")
plt.show() # This plot represents the "partial" conditional indirect effect, when SkillRelevance is evaluated at 0.

If you want the omitted moderator(s) to have a different value than 0, you must pass a unique value for each moderator
as a key in the modval dictionary:
g = p.plot_conditional_indirect_effects(med_name="MediationSkills", x="Motivation", modval={"SkillRelevance":[-5]})
plt.show() # This plot represents the "partial" conditional indirect effect, when SkillRelevance is evaluated at -5.

If you pass multiple values in modval for a moderator that is not displayed of the graph, the method will
return an error.
Under the hood, the plotting functions relies on a seaborn.FacetGrid object, on which the following objects
are plotted:
plt.plot when errstyle="none"plt.plot and plt.fill_between when errstyle="band"plt.plot and plt.errorbar when errstyle="ci"You can pass custom arguments to each of those objects to customize the appearance of the plot:
from pyprocessmacro import Process
import pandas as pd
import matplotlib.pyplot as plt

df = pd.read_csv("MyDataset.csv")
p = Process(data=df, model=13, x="Effort", y="Success", w="Motivation", z="SkillRelevance",
            m=["MediationSkills", "ModerationSkills"], suppr_init=True)

plot_kws = {'lw': 5}  # Plot:  Make the lines bolder
err_kws = {'capthick': 5, 'ecolor': 'black', 'elinewidth': 5, 'capsize': 5}  # Errors: Make the CI bolder and black
facet_kws = {'aspect': 1}  #Grid: Make the FacetGrid a square rather than a rectangle


g = p.plot_conditional_indirect_effects(med_name="MediationSkills", x="Motivation", errstyle="ci",
                            plot_kws=plot_kws, err_kws=err_kws, facet_kws=facet_kws)

Every table PyProcessMacro prints is also available in a standardized form, modelled on R's broom package:
tidy() returns one long DataFrame with one row per estimate and fixed column names: component
(outcome, direct, indirect, total, contrast, or index_mm, index_pmm, index_mmm, index_cmm),
outcome, term, moderator, one column per moderator of the model holding the spotlight value the row is
evaluated at, then estimate, std_error, statistic, p_value, conf_low, conf_high, method,
conf_level and n_boot. Pass component= to keep one kind of row.glance() returns one row of fit statistics per outcome model, including the log-likelihood, AIC and BIC.augment() returns the analysis data with .fitted_<outcome> and .resid_<outcome> columns per outcome model.p = Process(data=df, model=7, x="Effort", y="Success", w="Motivation", m=["MediationSkills"], suppr_init=True) estimates = p.tidy() # every estimate indirect = p.tidy("indirect") # only the conditional indirect effects fit = p.glance() # R², AIC, BIC, ... per outcome model residuals = p.augment(outcome="Success") # fitted values and residuals of the outcome model estimates.to_csv("process_model7.csv", index=False)
summary() returns the text it prints, so report = p.summary() keeps a copy, and a Process object displayed at
the end of a notebook cell shows its tables as HTML.
PyProcessMacro was developed by Quentin André during his PhD in Marketing at INSEAD Business School, France.
His work on this library was made possible by Andrew F. Hayes' excellent book, by the financial support of INSEAD and by the ADLPartner PhD award.
QuentinAndre/pyprocessmacro is a public repo on GitHub by QuentinAndre. A Python library for moderation, mediation and conditional process analysis.
It declares the MIT license on GitHub.
Its maker has not tagged a system, so it is unknown here. Its README says what it needs.
Open "Take it" on its page: Take My Repo writes an install plan for your machine and hands it to your AI agent (Claude Code, Codex or Cursor), which asks you before each step. Take My Repo has not tested it on any machine.
Its last change on GitHub was on 2026-09-29. GitHub counts 6 open issues and pull requests. Take My Repo does not judge from that whether it is maintained.
Nobody has reviewed it on Take My Repo yet, which says nothing about its quality.
Apache Superset is a Data Visualization and Data Exploration Platform
12 weeks, 26 lessons, 52 quizzes, classic Machine Learning for all
Bring data to life with SVG, Canvas and HTML. :bar_chart::chart_with_upwards_trend::tada:
The 30 Days of Python programming challenge is a step-by-step guide to learn the Python programming language in 30 days. This challenge may take more than 100 days. Follow your own pace. These videos may help too: https://www.youtube.com/channel/UC7PNRuno1rzYPb1xLa4yktw
Full-stack observability · Metrics · Logs · Traces · Flows · Topology · Infrastructure · APM · NPM · DBM · RUM · Synthetics · Cloud · AI SRE · OpenTelemetry · SNMP · NetFlow/IPFIX/sFlow · IPMI · Redfish · 2000+ integrations