HAIR
Infrared (IR) device admin panel for Home Assistant. Learn signals, assign to devices, create triggers, all from the GUI. Built on HA 2026.6+ infrared platform.
- 371
- Python
- MIT
- 2 d ago
Get history kWh consumption of broadlink Smart Plug Mini (tested with SP3S-EU) using the broadlink server and append later kWh measurements in .csv file format per device
Repo ZuinigeRijder/python-broadlink-smart-plug-mini, read from GitHub 1 min ago. ZuinigeRijder has not joined Take My Repo.
ZuinigeRijder/python-broadlink-smart-plug-mini is a public repo on GitHub by ZuinigeRijder. Get history kWh consumption of broadlink Smart Plug Mini (tested with SP3S-EU) using the broadlink server and append later kWh measurements in .csv file format per device. It declares the Apache-2.0 license on GitHub. It is written mainly in Python, has 0 stars and last changed on 2025-01-29. Nobody has reviewed it on Take My Repo yet, which says nothing about its quality. Read from GitHub on 2026-11-22.
python-broadlink-smart-plug-mini
Get history kWh consumption of broadlink Smart Plug Mini (tested with model SP3S-EU) using the broadlink server and append later kWh measurements to a .csv file format per device.
I have 2 times model Smart plug SP3S-EU and tested with those. Probably this also works for other broadlink SP mini models.
A short video of how csv_to_google_sheet.py can look on an Android phone, can be found here. Of course you can also view the Google Spreadsheet on your computer or tablet, e.g. Windows or Mac.
I am using 2 Smart plug SP3S-EU since 2018. The e-control App was limited in functionality/views. One of the strange things is e.g. the fact that you cannot see the month December of the year before the current year. So I was looking around if someone already had a better solution. I found the library python-broadlink, but this was only for local access to your broadlink smart plug devices (get direct power measurements). So I decided to try to sniff the e-Control app, see here.
In short, it appeared way easier to get the historical data of my smart plug mini than expected. You do not even have to login, you only need the server name and MAC address of the smart plug mini. Oops, so simple ;-)
So I started making a simple standalone python script smart_plug_mini.py which appends the history data per hour in a csv file for each device and made some parts configurable. Also the tool writes the Day, Weeks, Months and Years summaries to separate .csv files per device.
All the credits goes to python-broadlink library. This small program just outputs the information from the library of the detected smart plug devices. The MAC addresses are needed for the configuration of the real tool.
Note: Instead of using this tool, you can also look up the connected devices MAC addresses in your router, then you do not need to install the library python-broadlink.
C:\Users\Rick\git\broadlink>python python_broadlink_smart_plug_mini_info.py
device: Badkamer (Broadlink SP3S-EU 0x947a / 192.168.178.214:80 / 32:AA:31:72:63:43)
device: Lader (Broadlink SP3S-EU 0x947a / 192.168.178.234:80 / 32:AA:31:72:62:40)
Remarks for this example output:
This configuration file needs to be configured once for the smart_plug_mini.py script.
[smart_plug_mini]
local_timezone = Europe/Amsterdam
server = https://0000000000000000000000007a940000rtasquery.ibroadlink.com
device_names = Room1, Room2
device_macs = 32:AA:31:72:62:40, 32:AA:31:72:63:43
report_types = fw_spminielec_v1, fw_spminielec_v1
start_dates = 2023-01-01 00:00, 2023-01-01 00:00
time_filter = "timefilter":{}
Remarks to the configuration:
Simple Python3 script retrieve (history) kWh values for the configured Smart Plug mini devices.
Usage:
python smart_plug_mini.py
INPUTFILE:
Standard output:
OUTPUTFILES (for each configured DEVICE_NAME):
C:\Users\Rick\git\broadlink>python smart_plug_mini.py
##### Lader.csv ######################################
last line Lader.csv: 2023-02-04 12:00, 4349.84, 0.00,  0.00,  18.43,  0.02,  71.98
                  2023-02-04 12:00
date_start local: 2023-02-04 13:00:00+01:00
now local       : 2023-02-04 14:12:00+01:00
Lader: from 2023-02-04 13:00:00+01:00 to 2023-03-04 13:00:00+01:00
Opening Lader.csv
Lader.csv: 2023-02-04 13:00, 4349.84, 0.00,  0.00,  18.43,  0.02,  71.98
Lader.csv: 2023-02-04 14:00, 4349.84, 0.00,  0.00,  18.43,  0.02,  71.98
Closing Lader.csv
##### Badkamer.csv ######################################
last line Badkamer.csv: 2023-02-04 12:00, 649.65, 0.06,  0.52,  5.09,  3.13,  30.66
                  2023-02-04 12:00
date_start local: 2023-02-04 13:00:00+01:00
now local       : 2023-02-04 14:12:00+01:00
Badkamer: from 2023-02-04 13:00:00+01:00 to 2023-03-04 13:00:00+01:00
Opening Badkamer.csv
Badkamer.csv: 2023-02-04 13:00, 649.76, 0.11,  0.63,  5.20,  3.24,  30.77
Badkamer.csv: 2023-02-04 14:00, 649.76, 0.00,  0.63,  5.20,  3.24,  30.77
Closing Badkamer.csv
Some remarks from this example:
Example part of e.g. Badkamer.csv:
Date, Cumulative kWh, Delta +kWh, Days +kWh, Weeks +kWh, Months +kWh, Years +kWh
.....
2023-02-02 21:00, 647.83, 0.00,  0.49,  3.27,  1.31,  28.84
2023-02-02 22:00, 648.13, 0.30,  0.79,  3.57,  1.61,  29.14
2023-02-02 23:00, 648.13, 0.00,  0.79,  3.57,  1.61,  29.14
2023-02-03 00:00, 648.13, 0.00,  0.00,  3.57,  1.61,  29.14
2023-02-03 01:00, 648.13, 0.00,  0.00,  3.57,  1.61,  29.14
2023-02-03 02:00, 648.13, 0.00,  0.00,  3.57,  1.61,  29.14
2023-02-03 03:00, 648.13, 0.00,  0.00,  3.57,  1.61,  29.14
2023-02-03 04:00, 648.13, 0.00,  0.00,  3.57,  1.61,  29.14
2023-02-03 05:00, 648.13, 0.00,  0.00,  3.57,  1.61,  29.14
2023-02-03 06:00, 648.13, 0.00,  0.00,  3.57,  1.61,  29.14
2023-02-03 07:00, 648.51, 0.38,  0.38,  3.95,  1.99,  29.52
2023-02-03 08:00, 648.51, 0.00,  0.38,  3.95,  1.99,  29.52
2023-02-03 09:00, 648.51, 0.00,  0.38,  3.95,  1.99,  29.52
2023-02-03 10:00, 648.51, 0.00,  0.38,  3.95,  1.99,  29.52
2023-02-03 11:00, 648.51, 0.00,  0.38,  3.95,  1.99,  29.52
2023-02-03 12:00, 648.85, 0.34,  0.72,  4.29,  2.33,  29.86
2023-02-03 13:00, 648.85, 0.00,  0.72,  4.29,  2.33,  29.86
2023-02-03 14:00, 648.85, 0.00,  0.72,  4.29,  2.33,  29.86
2023-02-03 15:00, 648.85, 0.00,  0.72,  4.29,  2.33,  29.86
2023-02-03 16:00, 648.85, 0.00,  0.72,  4.29,  2.33,  29.86
2023-02-03 17:00, 648.85, 0.00,  0.72,  4.29,  2.33,  29.86
2023-02-03 18:00, 648.85, 0.00,  0.72,  4.29,  2.33,  29.86
2023-02-03 19:00, 648.85, 0.00,  0.72,  4.29,  2.33,  29.86
2023-02-03 20:00, 648.85, 0.00,  0.72,  4.29,  2.33,  29.86
2023-02-03 21:00, 648.85, 0.00,  0.72,  4.29,  2.33,  29.86
Some remarks from this example:
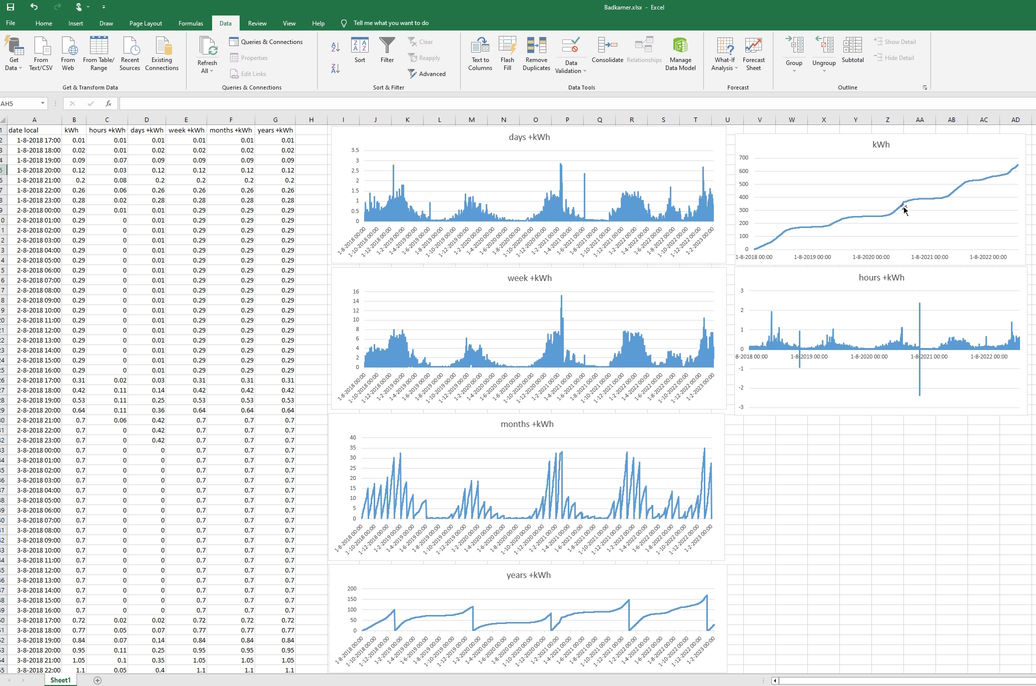
A screenshot for example spreadsheet Badkamer.xlsx which has imported a larger Badkamer.csv:
Simple Python3 script to read the smart_plug_mini.py generated csv files and write a summary for each device to a separate Google spreadsheet.
Note: you need to install the package gspread and configure gspread, see here for the configuration
Usage:
python csv_to_google_sheet.py
INPUTFILES:
Standard output:
OUTPUT SPREADSHEET:
So the smart_plug_mini.py tool runs on my Raspberry Pi server, but I want to look at the results, without having to login to my server. So another tool has been made, which copies a summary to a google spreadsheet for each device: csv_to_google_sheet.py
The Google spreadsheet contains kWh usage, including nice diagrams, when you copy the example Google spreadsheet Room.SP and rename it to DEVICE_NAME.SP):
A short video of how it can look on an Android phone, can be found here. Of course you can also view the Google Spreadsheet on your computer or tablet, e.g. Windows or Mac.
For updating a Google Spreadsheet, csv_to_google_sheet.py is using the package gspread. For Authentication with Google Spreadsheet you have to configure authentication for gspread. This authentication configuration is described here
The csv_to_google_sheet.py script uses access to the Google spreadsheets on behalf of a bot account using Service Account.
Follow the steps in this link above, here is the summary of these steps:
Example script run_smart_plug_mini_once.sh to run smart_plug_mini.py on a linux based system.
Steps:
Add the following line in your crontab -e to run it once per hour 9 minutes later (crontab -e):
9 * * * * ~/smart_plug_mini/run_smart_plug_mini_once.sh >> ~/smart_plug_mini/run_smart_plug_mini_once.log 2>&1
For the ones who also want to be able to sniff the calls from e-Control the App, this is how I did it (do it at your own risk):
I was mainly interested in the "My Energy" information from the e-Control App.
POST /dataservice/v2/device/stats HTTP/1.1
Content-Length: 386
Content-Type: text/plain; charset=UTF-8
Host: 0000000000000000000000007a940000rtasquery.ibroadlink.com
Connection: close
Expect: 100-continue

{
  "credentials": {
    "userid": "123",
    "loginsession": "456",
    "licenseid": "e9a19a0e0d099eb8288d878687b4883a"
  },
  "report": "fw_spminielec_v1",
  "device": [
    {
      "did": "0000000000000000000032aa31726240",
      "start": "2022-12-31_00:00:00",
      "end": "2023-01-31_23:59:00",
      "params": [
        "elec"
      ],
      "timefilter": {
        "timepoint": [
          "22:00:00",
          "06:00:00"
        ],
        "loffset": "29m",
        "roffset": "30m"
      }
    }
  ]
}
Following observations:
Mentioned types are:
I did not try these, only used fw_spminielec_v1.
HTTP/1.1 100 Continue

HTTP/1.1 200 OK
Server: nginx/1.4.6 (Ubuntu)
Date: Tue, 31 Jan 2023 20:52:00 GMT
Content-Type: text/plain; charset=utf-8
Content-Length: 1257
Connection: close

{
  "status": 0,
  "msg": "ok",
  "report": "fw_spminielec_v1",
  "table": [
    {
      "did": "0000000000000000000032aa31726240",
      "total": 22,
      "cnt": 22,
      "values": [
        {
          "elec": 4299.56,
          "occurtime": "2023-01-21_22:00:00"
        },
        {
          "elec": 4291.36,
          "occurtime": "2023-01-21_06:00:00"
        },
        {
          "elec": 4320.54,
          "occurtime": "2023-01-22_22:00:00"
        },
        {
          "elec": 4299.58,
          "occurtime": "2023-01-22_06:00:00"
        },
        {
          "elec": 4320.57,
          "occurtime": "2023-01-23_22:00:00"
        },
        {
          "elec": 4320.56,
          "occurtime": "2023-01-23_06:00:00"
        },
        {
          "elec": 4320.57,
          "occurtime": "2023-01-24_22:00:00"
        },
        {
          "elec": 4320.57,
          "occurtime": "2023-01-24_06:00:00"
        },
        {
          "elec": 4320.57,
          "occurtime": "2023-01-25_22:00:00"
        },
        {
          "elec": 4320.57,
          "occurtime": "2023-01-25_06:00:00"
        },
        {
          "elec": 4320.57,
          "occurtime": "2023-01-26_22:00:00"
        },
        {
          "elec": 4320.57,
          "occurtime": "2023-01-26_06:00:00"
        },
        {
          "elec": 4320.57,
          "occurtime": "2023-01-27_22:00:00"
        },
        {
          "elec": 4320.57,
          "occurtime": "2023-01-27_06:00:00"
        },
        {
          "elec": 4320.57,
          "occurtime": "2023-01-28_22:00:00"
        },
        {
          "elec": 4320.57,
          "occurtime": "2023-01-28_06:00:00"
        },
        {
          "elec": 4320.57,
          "occurtime": "2023-01-29_22:00:00"
        },
        {
          "elec": 4320.57,
          "occurtime": "2023-01-29_06:00:00"
        },
        {
          "elec": 4349.81,
          "occurtime": "2023-01-30_22:00:00"
        },
        {
          "elec": 4331.41,
          "occurtime": "2023-01-30_06:00:00"
        },
        {
          "elec": 4349.81,
          "occurtime": "2023-01-31_22:00:00"
        },
        {
          "elec": 4349.81,
          "occurtime": "2023-01-31_06:00:00"
        }
      ]
    }
  ]
}
Following observations:
POST /dataservice/v2/device/status HTTP/1.1
Content-Length: 320
Content-Type: text/plain; charset=UTF-8
Host: 0000000000000000000000007a940000rtasquery.ibroadlink.com
Connection: close
Expect: 100-continue

{
  "credentials": {
    "userid": "123",
    "loginsession": "456",
    "licenseid": "e9a19a0e0d099eb8288d878687b4883a"
  },
  "report": "fw_spminielec_v1",
  "device": [
    {
      "did": "0000000000000000000032aa31726240",
      "start": "2023-01-31_05:09:58",
      "end": "2023-02-01_05:09:58",
      "params": [
        "power"
      ],
      "timefilter": {}
    }
  ]
}
Following observations:
HTTP/1.1 100 Continue

HTTP/1.1 200 OK
Server: nginx/1.4.6 (Ubuntu)
Date: Tue, 31 Jan 2023 20:57:04 GMT
Content-Type: text/plain; charset=utf-8
Connection: close
Content-Length: 13366

{
  "status": 0,
  "msg": "ok",
  "report": "fw_spminielec_v1",
  "table": [
    {
      "did": "0000000000000000000034ea34796940",
      "total": 283,
      "cnt": 283,
      "values": [
        {
          "occurtime": "2023-01-31_05:10:00",
          "power": 0
        },
        {
          "occurtime": "2023-01-31_05:15:00",
          "power": 0
        },
        {
          "occurtime": "2023-01-31_05:20:00",
          "power": 0
        },
        {
          "occurtime": "2023-01-31_05:25:00",
          "power": 0
        },
        {
          "occurtime": "2023-01-31_05:30:00",
          "power": 0
        },
        .....
        }
      ]
    }
  ]
}
Following observations:
ZuinigeRijder/python-broadlink-smart-plug-mini is a public repo on GitHub by ZuinigeRijder. Get history kWh consumption of broadlink Smart Plug Mini (tested with SP3S-EU) using the broadlink server and append later kWh measurements in .csv file format per device.
It declares the Apache-2.0 license on GitHub.
Its maker has not tagged a system, so it is unknown here. Its README says what it needs.
Open "Take it" on its page: Take My Repo writes an install plan for your machine and hands it to your AI agent (Claude Code, Codex or Cursor), which asks you before each step. Take My Repo has not tested it on any machine.
Infrared (IR) device admin panel for Home Assistant. Learn signals, assign to devices, create triggers, all from the GUI. Built on HA 2026.6+ infrared platform.
Its last change on GitHub was on 2025-01-29. Take My Repo does not judge from that whether it is maintained.
Nobody has reviewed it on Take My Repo yet, which says nothing about its quality.
✨ Innovative and open-source visualization application that transforms various data formats, such as JSON, YAML, XML and CSV into interactive graphs.
Home Assistant integration for smart-plug appliance monitoring: detects cycles, matches programs, estimates time remaining. Supports washing machines, dryers, dishwashers and more.
A Docker container for BroadLink devices with a REST API and React UI
📗 SheetJS Spreadsheet Data Toolkit -- New home https://git.sheetjs.com/SheetJS/sheetjs
A custom integration to control Tapo devices from home assistant.
Automatic trip administration tools for Hyundai Bluelink or Kia UVO Connect users. Determining afterwards your private and/or business trips and information about those trips and usage of the car. Support for Domoticz and/or MQTT Broker (e.g. HomeAssistant, ioBroker). Best of all is the fact that it does NOT drain your 12 volt battery of the car.
Simple Python3 script to copy latest (normally once per 5 minutes) SolisCloud portal inverter update to PVOutput portal, Domoticz, and/or MQTT Broker (e.g. HomeAssistant, ioBroker).
RDW API hulpmiddelen voor de IONIQ 5, misschien dat het ook gebruikt kan worden ter inspiratie voor andere auto's. Maar kan natuurlijk ook gebruikt worden om nieuwe kentekens te vinden die nog niet op naam staan.
Python RDW API hulpmiddelen voor de IONIQ 5, misschien dat het ook gebruikt kan worden ter inspiratie voor andere auto's. Maar kan natuurlijk ook gebruikt worden om nieuwe kentekens te vinden die nog niet op naam staan.
Simple Python3 script to combine 2 PVOutput Systems continously (normally once per 5 minutes) into target PVOutput System
Hulpmiddelen voor ophalen uur/dag waardes fijnstof en samenvatting genereren van WHO/EU gemeente overschrijdingen