
bootstrap
The most popular HTML, CSS, and JavaScript framework for developing responsive, mobile first projects on the web.
- 175k
- JavaScript
- MIT
- 1 d ago
US stocks screener (Nasdaq, NYSE, Cboe) with ETFs: SEC EDGAR XBRL fundamentals (quarters, TTM, ADR and IFRS), Yahoo prices, presets, five scores, statuses, flags, DCF and weekly signals; static feed by a Bun updater
Repo daggerok/Stocks, read from GitHub 20 h ago. daggerok has not joined Take My Repo.
daggerok/Stocks is a public repo on GitHub by daggerok. US stocks screener (Nasdaq, NYSE, Cboe) with ETFs: SEC EDGAR XBRL fundamentals (quarters, TTM, ADR and IFRS), Yahoo prices, presets, five scores, statuses, flags, DCF and weekly signals; static feed by a Bun updater. It declares the MIT license on GitHub. It is written mainly in TypeScript, has 0 stars and last changed on 2026-11-21. Nobody has reviewed it on Take My Repo yet, which says nothing about its quality. Read from GitHub on 2026-11-21.
In the maintainer's words. Shown from GitHub; Take My Repo does not keep a copy.
One of the app's features lets you rank every stock of Nasdaq, NYSE and Cboe on the numbers that matter to a long-term holder: dividend yield, dividend growth, payout and FCF payout, quick and current ratios, debt to equity and net debt to EBITDA, revenue, EPS, FCF, EBITDA, CapEx, asset and debt growth, net, gross, EBITDA and FCF margins with their year-over-year change, ROIC, valuation multiples (P/E, forward P/E, P/S, forward P/S, P/FCF, EV/EBITDA, FCF/EBITDA) short-term momentum (1 to 60 trading days, 1 month, 1 quarter, week, month and quarter to date, 2 weeks to 52 weeks) and performance and total returns over 1, 3, 5 and 10 years with CAGRs. Another feature lets you tick stocks into a Watchlist, open per-stock Fundamentals, Dividends and History tabs, and copy or export the tickers. A client-side tool (Parcel + Tailwind CSS v4, built into dist) that reads the generated ./api/stocks static feed (SEC EDGAR XBRL annual filings, SEC company ticker table, Yahoo Finance prices, dividends and valuation snapshot) into a searchable stock catalog - the same look, feel and interaction model as the ETFs applications, with no runtime dependencies
bunx degit daggerok/Stocks#main ./12345 && cd $_
bun install
./scripts/update-data.ts --restore-from
bun run serve
open http://0:1234
api/stocks is not in git: ./scripts/update-data.ts --restore-from downloads the published feed from https://daggerok.github.io/Stocks/api/stocks/ into an empty api/stocks once (see Publishing). Without it the app builds and shows an empty catalog
bun run serve is the Parcel dev server (it copies api/, the base presets src/core/screener/presets, user-data/ and the scoring config src/core/scoring/config.json as scoring.json into dist first); bun run build writes the production site to dist and bun run build-github-pages does the same for the /Stocks/ public URL
The published application is available at https://daggerok.github.io/Stocks/
Every column of the catalog and of the Fundamentals, Dividends and History tabs has a type: text (ABC), number (123), percentage (%), money ($), date (D), date and time (DT) or time of day (T). The type is detected from the texts the column shows (80% of the filled cells must agree, otherwise text) and is written in the badge next to the column title: click it to cycle the type, Shift+click to return to auto-detection. Dates are read as 2024-06-15, 6/15/2024, 15.06.2024, Jun 15, 2024 or 15-Jun-2024, date and time as 2024-06-15T09:30:00Z or 2024-06-15 09:30, time as 09:30, 16:00:00 or 9:30 PM
A row of filter inputs sits under the column headers (the Filters button hides it, Clear filters empties it). Filters of different columns are combined with AND, the Search box and the Exchanges, Sectors and Hide stale controls apply on top, and Copy Tickers and the exports use the filtered rows. Filters and type overrides are remembered in the browser; filters keep working on columns that are hidden in the Columns menu (hiding a column only hides it from the table). The Columns menu lists every column one by one (Use and Ticker are listed but locked, everything else is shown by default, with search, All, Clear, Toggle and Reset) and the choice is remembered in the browser. Sticky # (next to Filters, off by default, remembered in the browser) numbers the rows by their rank in the table sorted by the current column before the column filters, so a filtered stock keeps its rank and the numbers keep gaps; the sort, the search, the Watchlist and the Exchanges, Sectors, blacklist and Hide stale choices rank again. Every export starts with the # column. The action buttons (Copy Tickers, Export .csv, Export .txt, Clear, Blacklist) sit in the ☰ menu at the right end of the toolbar: Enter, Space or the down arrow opens it, the arrows move between the items, Esc or a click outside closes it. The red Clear item opens a dialog with a checkbox for everything it can reset (selected stocks, searches, sorts, open tab, exchanges and sectors, shown columns, hide stale, column filters and types, Filters on/off, Sticky #, scroll positions, the blacklist and the screener choice; the theme, the language and own presets are kept): all ticked the first time, afterwards as left at the last OK. Enter is OK, Esc is Cancel. The ticked items go back to the first-visit view (also after a reload)
Inside one filter: a space means AND, a comma means OR, a leading ! means NOT, ? matches an empty or unavailable value and !? a value that is there; a value that is unavailable matches only ? and negated conditions. An unquoted space ends the value, so quote values that contain one (>="2024-06-15 09:30")
| Type | Examples |
|---|---|
| Text | bank contains, "two words", !bank, =exact, ^starts, ends$, /regex/, tech, health |
| Number, percentage, money | >10, >=10 <50, =22 (matches what rounds to 22), !=22, 10..50, ..50, 10.., >1B and K M B T suffixes, an optional $ or % |
| Date, date and time | >2024-06-01, 2024 (the whole year), 2024-06 (the whole month), 2024-01..2024-06, today, yesterday, -7d.. (the last 7 days), +2w, -3m, -1y |
| Time | >09:30, 09:30..16:00, =12:00 (the whole minute) |
The Screener panel above the table narrows the same table, it does not open a second one:
¬ to exclude it (NOT), ▾ to open its conditions. All of and Any of combine the chosen presets with AND or OR; the refinement chips, each labelled with its own muted "and" prefix ("and Pays a dividend", "and Up over 1 year"; RU «и») always apply on top, so "Gold + dividend yield > 0" is two clicks and "Quality growth or Growth without profit + 1-year return > 0" is four. Gold and Mine list ETFs too in the shared preset files (the hub uses them), here they show only stocks: the gold miners and the stocks of the owner's listin), comparison group, empty-value rule and on/off switch, + metric, the match mode (all or "N of M") and the funnel: how many rows can still match after each condition and where the selection empties. Edited conditions are highlighted; Reset, Save as my preset, Export (<id>.json for user-data/presets/), Import and Copy link (the preset and its schemaVersion in the link) work without a backend. The Presets column lists the presets each row passes./presets/ (built from src/core/screener/presets), own presets from ./user-data/presets/ and peer groups from ./user-data/peers.json; each folder has an index.json with its file list (a test keeps it in sync). Own presets saved in the browser win over the repo copies and are marked "not exported" until exported or committedsrc/core/scoring): the columns Archetype, Status, Why, Flags and Total score, Cheap, Quality, Safety, Dividend, Entry (0-100, colored green from 70 and red below 40). Each score is the weighted mean of sector percentiles of its metrics (a sector with fewer than 20 values compares with the whole stock market), the archetype (stable, growth, volatile) comes from ordered rules (a REIT is growth only by approximate FFO growth, isReit comes from the Yahoo industry), a flag rule may carry further or groups (the main red flag also fires on cash conversion below 0.5 while net income grows), a stop factor of the archetype gives Rejected, otherwise the weighted score against the archetype's thresholds gives Buy zone, Watch or Rejected; a buy cap (buyCaps in the config, today only small-cap: market cap below $2B, owner answer N19) turns a Buy zone score into Watch and Why names it, so a crashed micro cap never shows as a buy; a Buy zone also needs every score with 15% of the archetype weight or more (buyRequiresScores in the config, owner 2026-11-15): an empty one makes the stock at most Watch and Why says "no data for the Cheap score" (the Dividend score of a non-payer does not count, and neither does an empty Safety score of a stock in the Financial Services sector: banks and insurers have no debt metrics by design, buyRequiresScores.exempt in the config, owner N46); the Quality score is needed for a Buy zone whatever its weight (buyRequiresScores.always, owner N47, 2026-11-16: a volatile stock weighs Quality at 10%, FUTU had no Quality data after the revenue sanity and still showed as Buy zone): an empty one makes the stock at most Watch with "no data for the Quality score" in Why, the exempt list applies to it too, and it is not counted as 0 in the Total; in the Total score an empty score with 15% of the weight or more counts as 0 (owner 2026-11-15, FUTU had no Cheap score and a Total of 80 from the rest), a lighter one, a non-payer's Dividend and the exempt Safety of Financial Services are left out and the other weights scaled up (SCORING_FORMULA_VERSION in score.ts goes into the scores.json key, so a formula change in code never reuses an old snapshot); the Cheap score includes the TTM P/E in the sector and needs a quarter of its weight (minWeightShare 0.25 of the score), so a foreign filer with a P/E and one more valuation metric gets one; the Total score cell shows its sum on hover (each score times its weight, a heavy empty score as "no data × 15% = 0", a lighter one as "no data" and the scaling of the other weights); the table opens sorted by the Total score, highest first and empty last (a sort remembered in the browser stays, the Clear item "Sort order" goes back to it); the flag Irregular dividend (dividendIrregular) marks a gap year between payments; Why lists the reasons in the current language. Every weight, threshold, rule, flag and note is in src/core/scoring/config.json (served as scoring.json) and changes without code; the guide sections Five scores, Archetypes and statuses, Flags and Thresholds explain them. The outputs are also metrics the presets can filter on (status, archetype, scoreSafety, flagCount)stable-growth, owner 2026-11-14): stocks that kept growing over the horizon picked on the chip (1Y, 3Y, 5Y or 10Y, 5Y by default, remembered in the browser, reset by the Clear item "Screener horizons"): a positive total return on every horizon up to it, 5% a year or more (tr1y for 1Y, else the CAGR of the horizon) and volatility1y at most 35 (skipped when empty). The horizons are preset variants (variants and defaultVariant in the preset JSON, withVariant() in src/core/screener/variants.ts): the chosen variant adds its conditions, so the funnel, the editor, Copy link and the signals job (default horizon) see a plain preset; a new horizon drops the edits of the old one. The refinement "and Dividend growth" (rising-dividend: dividendGrowth5y above 0 and no dividend cut in 10 years). On the 2026-11-13 stock feed, 5Y: 643 stocks, with "and Pays a dividend" 584, with "and Dividend growth" 350quality-on-sale, owner answer N19): Quality and Safety scores of 55 or more, the price 15% or more below its 52-week high, market cap from $10B and status Buy zone or Watch. The drop is absolute, so it finds strong companies after a market-wide fall that the sector-relative Entry score does not reward (on the 2026-11-13 feed: 112 stocks, among them NVDA, GOOG, GOOGL, META, MU and ASML)appliesTo: ["etf"], so this page does not list them): the chips Beats the benchmark, Steady income, High income no erosion, Monthly grower, Price growth, Rotation: lagging now, Best in sector and ETF on sale, the refinements and Index family, and Yield above the benchmark, and Pullback, and Qualified dividends, and AUM from and and Costs up to; and Monthly payments (monthly-pay, payFrequency = monthly) applies to stocks too and shows here: the updater publishes paymentsPerYear and payFrequency from the Yahoo dividend events (scripts/metrics/dividends.ts, the rule of the shared ETF dividends block), so O, MAIN or STAG pass after the next data run. Two engine parts serve them: the scope benchmark compares a row's value minus the value of a named ticker of the universe ({ "metric": "dividendYield", "op": ">", "value": 0, "scope": "benchmark", "benchmark": "SPY" } is "yield above SPY's"; the editor shows a ticker box for it), and chip pickers (pickers in the preset JSON, withPickers() in src/core/screener/variants.ts): each select on a chip (Benchmark, Horizon, Yield from, Risk, Family, Depth, Sector, a level) adds the conditions and {name} variables of its option, remembered under <prefix>-screener-pickers and reset by the Clear item "Screener chip choices". The ETF row adapter (etfRow with etfClasses() over src/core/screener/etf-classes.json and qdi.json) adds expenseRatio, isGeared, indexFamily, indexVariant, the ETF sector or theme as industry and the qualified dividend keys; a wrong class is fixed in that JSONPeer groups in the Screener panel edits the groups of the peers scope: create a group, add tickers with Enter, remove them, delete a group. user-data/peers.json is the starting state, the browser copy wins and is marked "not exported" until Export peers.json (the whole file, ready to replace user-data/peers.json); Import reads such a file back. A stock without a group is compared with its industryOverview: key figures, the five scores colored, archetype, status, Why and flags. Statements: income statement, balance sheet and cash flow statement for up to five fiscal years plus TTM with the change against the year before, from the SEC layer of meta.json (a foreign issuer can switch to its USD view; an older feed falls back to the annual rows). Long-run charts: revenue, net income, operating and free cash flow and the four margins as plain SVG. Peers: market cap, revenue, net income, FCF, P/E, both PEGs, P/B and P/S of the peer group, else of the largest stocks of the industry, absolutes in USD. DCF: the FCF and EPS flows side by side (g1 for years 1-5, g2 for 6-10, WACC 9.5% and terminal growth 3% by default, WACC at or below the terminal growth rejected), bear, base and bull scenarios, the margin of safety at the price, a flag when the two values diverge by more than 30% and the capex intensity; the EPS flow base is the reported EPS or operating income after tax per share (effective tax rate within 0-50%, else 21%); edited inputs stay in the browser and export and import as user-data/dcf/<TICKER>.json. TAM: market size, growth and three market shares turned into the revenue at the horizon and the growth it needs. Research notes: a dated one-paragraph thesis, the nine-question checklist and the management promises tracker (buybacks against the shares actually retired and capex against the capex spent, from the SEC quarters). TAM, notes and promises live in the browser, export to user-data/tam/<T>.json, user-data/notes/<T>.md and user-data/promises/<T>.json and are read back from there after a commitSimilar section of the ticker page lists the 10 stocks closest to it on one metric group (Business, Dividend, Valuation, Risk from src/core/similar/config.json, served as similar.json and fetched like scoring.json, or an own set of registry keys): percentiles inside the sector when it has at least 20 rows (minSectorRows; candidates from the sector only), else among all stocks, the root mean square gap over the metrics both have (an empty metric is left out pair by pair, a stock needs half of the usable metrics in common), similarity = 100 - gap, the three largest differences per stock. Add to peer group puts the stock and the picked rows into a group, Make a filter from X turns it into an own preset of range conditions (its values ±20%)Signals in the top panel lists what changed from one data run to the next, read from api/stocks/signals.json (last 12 weeks): a stock entered or left a base or committed own preset (an exit only after two runs in a row with fresh data), a flag of the scoring config appeared or went away, the status or the archetype changed, a score moved by 15 points or more. Filters by date and type; a ticker opens its page. A stock whose source failed in the run, or that the run did not refresh, gives no signals; a change with unchanged fiscal period ends but moved SEC values is marked as restated past periods. Links: #signals opens the view, #ticker=AAPL the ticker page. The update workflow runs the updater with --signals, restores signals.json together with the feed (Actions cache, else --restore-from the site) and publishes it together with the feed; a local run with --signals does the same before bun run publish-local. --signals-issue <dir> [siteUrl] writes the text of a "Signals for " summary (signals of the last 7 days with links to the site) into <dir>; the workflow no longer opens it as an issue, since the data workflow has no schedule (owner 2026-11-14)api/stocks/scores.json next to index.json holds, for every stock, the archetype, the five scores, the Total score, status, flags, stop factors, buy caps, missing scores, Why notes and the base presets it passes, computed by the same src/core/scoring and src/core/screener code the page runs (src/core/scoring/snapshot.ts). Every update run and --publish (bun run publish-local and the workflows) write it from the local feed only; no ETF brand feed is read (since hub plan H4 the file has no ETF part, the etfs part of an older file is ignored). The page skips its own scoring and the base presets when the key of the file matches what it loaded (scoring config, peer groups, index.json generatedAt and company count); a missing or stale file, a peers overlay in the browser, an own preset, a draft or another preset horizon are computed in the browser as before. About 750 KB, 105 KB gzip; a rerun with the same inputs writes nothingEN and RU in the top panel switch the language of the whole page: the guide, the metric reference, the table headers and tooltips (name and short text of the metric registry), the screener, the toolbar, filters, the Watchlist and detail tabs, the Columns menu, the Clear dialog, the ticker page and the export labels. English is the default; every UI string goes through t() (src/core/i18n, the page chrome as ui.<English text> keys used by L() in main.tsx, static texts of index.html marked with data-i18n attributes). Guide opens every metric of the registry grouped (valuation, quality, safety, dividends, growth, price and swings, fields, scores; only the metrics that apply to stocks) with formula, short text and article, planned metrics marked, plus how presets, scopes and percentiles, empty values and the soft mode, and own data work, with a search box. The layout does not depend on the language: every control of the top panel, the toolbar and the screener head has a fixed width sized for the longer text, the preset chips sit in grids of equal cells and the ticker page tabs scroll in one row, so switching EN and RU never moves, resizes or rewraps anything (a text that does not fit ends with an ellipsis and stays in its tooltip)Run the updater with Bun:
bun test
./scripts/update-data.ts
Run ./scripts/update-data.ts -h (or --help) to print every configuration variable with its default and usage examples
GitHub Pages serves the gh-pages branch (Settings -> Pages -> Deploy from a branch). ./scripts/update-data.ts --publish (bun run publish-local) builds the site with the local api/stocks, refuses an index.json that is missing or lists no companies, and force-pushes dist to gh-pages as one parentless commit (git plumbing with its own index, no checkout of the branch, no clone): the branch never keeps the history of the feed, and unchanged files are the same blobs, so a push uploads only what changed. --no-build publishes an existing dist
Update and publish from your machine, no Actions run needed. This is the regular way to refresh the data: the data workflow has no schedule (owner 2026-11-14: Actions minutes of the free account), it runs only by hand
./scripts/update-data.ts --signals
bun run publish-local
To refresh every week, add a local cron entry (crontab -e; .local/ is in .gitignore):
0 6 * * 6 cd ~/Documents/code/private/agentic/investments/Stocks && mkdir -p .local && ./scripts/update-data.ts --signals >> .local/cron.log 2>&1 && bun run publish-local >> .local/cron.log 2>&1
cron runs with a short PATH: put PATH=/opt/homebrew/bin:/usr/local/bin:/usr/bin:/bin:$HOME/.bun/bin on the line above the entry so bun and git are found, and the Mac must be awake at that time
The feed is not committed: api/stocks/ is in .gitignore and lives on the site, in the Actions cache and in your local folder. The Update Stocks data workflow (manual runs only: gh workflow run update-data.yml)
api/stocks from the Actions cache (feed-stocks-*), then ./scripts/update-data.ts --restore-from <site> --if-newer replaces it with the published feed when the site is newer (a local publish) or the cache is empty, so the never-shrinking index and the rotation cursor (update-state.json) keep workingapi/stocks to the cache (also after a partly failed run: every stock is either fully updated or kept)bun run build-github-pages copies api into dist) and runs --publish --no-build (job permission contents: write, the token only in that step)A code change pushed to main (the GitHub Pages workflow) restores the feed the same way before it builds and publishes with the same guard, so it never replaces the site with one that has no data. The cache is evicted after 7 days without use; the site is the fallback, so a lost cache costs one download
Locally the updater still writes to api/stocks. ./scripts/update-data.ts --restore-from [url] fills an empty api/stocks from the published feed (or another .../api/stocks/ URL) and refuses to overwrite a local index.json: to start over, add -y (--yes), which removes api/stocks only after the published index.json was fetched and checked, or delete api/stocks first
Defaults live in scripts/update-data.config.json (every control as a string). An explicitly set environment variable overrides the file, even when it is empty. The Update Stocks data GitHub Actions workflow uses the same resolver (resolveControls in scripts/update-data.ts): individual workflow_dispatch inputs are blank by default and inherit the file, and the advanced input accepts a JSON object with any control (for example {"VERBOSE":"true"}). Precedence: file defaults < advanced JSON < nonblank inputs < protected Actions variable or environment. SEC_UA and USE_SYSTEM_CA are set through advanced, and SEC_UA is also taken from the protected SEC_UA repository Actions variable when it is nonblank. The workflow always writes to api/stocks only and publishes it to the gh-pages branch (see Publishing). All supplied filters use AND logic
scripts/All.txt (or, if it is missing or lists nothing, scripts/All.csv) is the owner's list. It does not narrow the feed (plan 1.1): a run without TICKERS covers every stock on EXCHANGES. The list marks the owner's stocks and puts them first in every full-universe run, so they are refreshed every week while the rotation cursor works through the rest of the universe; a stock that is not in the list is never removed because of it
All.txt: tickers separated by new lines, spaces, commas or semicolons; All.csv: the first cell of each row, a Symbol or Ticker header is ignoredNYSE:TTE -> TTE) and BRK.B, BRK/B and BRK-B are the same ticker. Then the TICKER_ALIASES table at the top of scripts/update-data.ts maps known spellings (BRKB -> BRK-B); grow it when a new spelling shows up. Without an entry, a ticker that is not in the table as written matches the one listed ticker with the same letters, an ambiguous one is reported as not foundmineTickers); a preferred share, warrant or unit in the list is updated, unlike the rest of the universeTICKERS runs exactly the given tickers, inside or outside the list, and never moves the rotation cursorisMine (true for the tickers of the list, false for all rows without a list) and index.json lists every ticker of the file, ETFs included, in mineTickers: the screener's "Mine" preset reads them| Block | Source |
|---|---|
| Universe, exchange, CIK | SEC https://www.sec.gov/files/company_tickers_exchange.json (Nasdaq, NYSE and Cboe rows; OTC and unlisted rows are ignored) |
| Annual fundamentals | SEC EDGAR XBRL https://data.sec.gov/api/xbrl/companyfacts/CIK##########.json, 10-K facts only, up to 15 fiscal years |
| Quarters and TTM | The same companyfacts, 10-K and 10-Q (us-gaap), parsed by scripts/sec/companyfacts.ts into 10 fiscal years, 40 discrete quarters and TTM, stored in meta.json under fundamentals.sec as arrays by field (newest first) with end, start, fiscalYear, period, filed and units; periods come from fact dates and durations (never fy and fp), the latest filed wins, a quarter is the 3-month fact or year-to-date minus the previous year-to-date, Q4 = fiscal year - 9 months, TTM = last fiscal year + year-to-date - the same year-to-date a year earlier, balance lines of the last quarter; share counts and per-share values filed before a split are restated with the Yahoo split ratio. An issuer that has tagged no nonzero debt line for 3 years before its latest fiscal year end is debt-free: debt 0 at every period (a missing debt fact at one date of an issuer with debt stays empty). An issuer without a diluted EPS and diluted share count in companyfacts (Visa reports both per share class) gets the diluted shares of all classes from the XBRL instance of the filing behind its TTM (scripts/sec/shares.ts, two EDGAR requests, reused from the published layer on the next run): a class whose EPS x shares equals net income is as-converted and stands for all, else the classes add up |
| Foreign issuers (ADRs) | The same companyfacts, forms 20-F, 40-F and 6-K: us-gaap tags first, then their ifrs-full synonyms (scripts/sec/tags.ts); the reporting currency is the majority unit of the latest annual filing (a USD convenience translation does not count); a period reported in both taxonomies takes the value of the latest filing (Toyota's IFRS restatement of FY2020 wins over its earlier US GAAP value), a tie keeps us-gaap. Most 20-F filers have no quarterly XBRL, so TTM is the last fiscal year (ttmIsAnnual). Amounts are converted to USD with the Yahoo chart of <CUR>USD=X (else the inverted USD<CUR>=X), loaded once per currency and run (scripts/sec/fx.ts): balance lines at the period-end rate, flows and per-share values at the period average; the USD layer is stored next to the SEC layer as fundamentals.usd with the rates applied. A foreign layer whose TTM ends more than 15 months before the last close is not used (the Yahoo fallback stays) |
| Fundamentals gap filler | Yahoo Finance fundamentals-timeseries (about 4 years): fills tags SEC does not carry (for a foreign issuer only points in its reporting currency) and covers issuers without usable SEC facts and holding-company reorganizations |
| Price history, dividends, returns | Yahoo Finance public chart API (/v8/finance/chart/{TICKER}?interval=1d&events=div,split) |
| Market cap, TTM and forward valuation, sector, analyst estimates | Yahoo Finance quoteSummary (needs a cookie and a crumb, opened once per run; a failed session leaves the forward multiples unavailable and keeps the published estimates); earningsTrend gives the current and next fiscal year EPS consensus, expected growth and the estimates 7, 30, 60 and 90 days ago, kept in meta.json market.estimates |
Each stock carries a metrics object that powers the catalog columns. Every metric of the registry that a stock has is a table column (none lives only in the screener), all visible by default: texts and flags (altmanVariant, country, isAdr, isReit, isMine as Yes or No) are text columns, athDate and the row dates fundamentalsAsOf (FY As Of) and ttmAsOf (TTM As Of) are date columns; the wide table scrolls inside its card. Percent values are plain numbers (12.5 means 12.5%), ratios are plain numbers, money is USD
| Group | Keys | Meaning |
|---|---|---|
| Valuation | marketCap, pe, forwardPe, ps, forwardPs, pFcf, evEbitda, fcfToEbitda, pb, enterpriseValue |
Yahoo TTM snapshot; forward values use the next fiscal year consensus; pFcf is market cap over TTM free cash flow; evEbitda and fcfToEbitda (cash conversion in %) use the updater's own TTM EBITDA (operating income + D&A from the SEC quarters) and own EV (market cap + debt + minority interest + preferred - cash - short-term investments of the last quarter) |
| Dividends | dividendYield, dividendRate, dividendGrowth, dividendGrowth3y, dividendGrowth5y, dividendStreak, dividendCut10y, dividendIrregular, paymentsPerYear, payFrequency, payoutRatio, fcfPayout |
paymentsPerYear counts the payments of the last 12 months, payFrequency says weekly, monthly, quarterly, semiannual, annual or irregular by the calendar months with a payment (the rule of the shared ETF dividends block); Yield from the last 12 months of ex-dates over the last close; growth from calendar-year sums of split-adjusted dividends (last complete year, 1-year growth and 3 and 5-year CAGR); scripts/metrics/dividends.ts: dividendStreak = complete calendar years in a row with a higher dividend per share (market.annualDps keeps 30 complete calendar years plus the current one, so it reaches 29 at most), dividendCut10y = a drop of more than 10% in the last 10 complete years that the next year did not recover (a stopped dividend is a cut; a special dividend or a payment moved into the next year is not), dividendIrregular = among the current calendar year and the 5 complete years before it a year without any payment lies between two years with payments (FUTU: 2024 and 2026, nothing in 2025); payout and FCF payout are dividends paid over net income and over free cash flow of the latest fiscal year |
| Estimates and own history | epsGrowthNextYearEst, epsGrowth5yEst, peg, pegGrowthSource, pegHist, forwardToTtmPe, epsRevision30d, pePct5y, pFcfPct5y, yieldVsAvg5y |
scripts/metrics/estimates.ts: peg = forward P/E / expected EPS growth in % (5-year consensus, else next fiscal year; pegGrowthSource = 5y or next-year), pegHist = P/E / 3-year CAGR of diluted EPS (SEC, split restated), forwardToTtmPe = forward P/E / P/E, epsRevision30d = current-year EPS estimate vs 30 days ago in %. scripts/metrics/history.ts: percentile of today's P/E and P/FCF in the company's own month-end series of 5 years (close x diluted shares / TTM of 4 consecutive SEC quarters, a quarter counts 60 days after its end, at least 48 of 60 months), yieldVsAvg5y = dividend yield / mean month-end trailing-12-month yield of 5 years; without a fresh chart (SKIP_YAHOO) the published values stay |
| Balance sheet | quickRatio, currentRatio, debtToEquity, netDebtToEbitda, roic |
Latest fiscal year end; quick = (cash and short-term investments + receivables) / current liabilities; netDebtToEbitda = (debt - cash - short and long-term investments of the last quarter) / TTM EBITDA; ROIC = operating income after tax / average (debt + equity - cash) |
| SEC quarters and TTM | operatingMargin, grossMarginSlope3y, operatingMarginSlope3y, cfoToNi, fcfToNi, interestCoverage, interestCoverageNote, cashRunwayMonths, altmanZ, altmanVariant, piotroskiF, niVolatility5y, fcfVolatility5y, capexToCfo, capexToRevenue, capexToRevenueDelta3y, niGrowth3y, niGrowth5y, ffoApprox, ffoPayoutApprox, ffoGrowth3y, fcfNegativeYears, cfoGrowth3y, epsNiGrowthGap3y, sharesChange3y, sharesChange5y, roe, roa, pTbv, navPerShare, pNav (banks, insurers and BDCs; navPerShare only from filers that tag it, which makes the business type BDC), balanceYoyMaxChange, balanceYoyMaxLine, marginNote |
Pure formulas in scripts/metrics/fundamentals.ts: TTM unless the name says 3y or 5y (fiscal years); slopes are least-squares over 4 fiscal years in pp per year; Altman Z is classic for manufacturing sectors and Z'' for the rest (altmanVariant), none for banks, insurers and REITs; Piotroski F is null when any of its 9 tests cannot be computed; cashRunwayMonths only for negative FCF; ffoApprox (REITs only) = NI + D&A - gains on sale of property, ffoGrowth3y its 3-year CAGR over fiscal years (the REIT archetype rule). Inputs of the stage 5 stop factors and flags: fcfNegativeYears (fiscal years in a row with negative FCF), cfoGrowth3y (operating cash flow CAGR), epsNiGrowthGap3y (EPS CAGR - NI CAGR over 3 years, pp), balanceYoyMaxChange and balanceYoyMaxLine (the balance line, at least 10% of the assets, that changed the most year over year). Banks and insurers get no EV/EBITDA, net debt to EBITDA, quick and current ratio, FCF metrics, Altman or Piotroski. The row carries ttmAsOf (end of the TTM quarter); the full formulas and texts are in the metric registry and the app's guide |
| TTM amounts | revenueTtm, netIncomeTtm, fcfTtm |
Revenue, net income and free cash flow (operating cash flow - capex) of the trailing twelve months in USD from the SEC layer (a foreign issuer: its USD view); a loss is negative; no SEC layer gives null, banks and insurers have no fcfTtm. The peers table on the ticker page reads them (a row without them falls back to market cap / P/S and the fiscal-year margins) |
| Growth | revenueGrowth, epsGrowth, fcfGrowth, ebitdaGrowth, capexGrowth, assetsGrowth, debtGrowth and the same with 3y and 5y |
1-year change relative to the absolute previous value; 3 and 5-year CAGR need two positive endpoints and consecutive fiscal years; EPS of a 10-K filer is the split-restated diluted EPS of the SEC layer (the same EPS pegHist reads), so a split between the endpoints does not read as a collapse |
| Margins | netMargin, grossMargin, ebitdaMargin, fcfMargin, and ...Delta, ...Delta3y |
Latest fiscal year over revenue; deltas are percentage-point changes versus 1 and 3 fiscal years. No margin above 100% is published (withRevenueSanity in scripts/metrics/fundamentals.ts, owner 2026-11-15): a profit line above revenue (net, gross, EBITDA or operating margin above 100%, or TTM net income above TTM revenue) empties every ratio over revenue (these margins, their deltas, operatingMargin, both margin slopes, capexToRevenue and its 3-year delta), FCF above revenue empties the FCF margins, cfoToNi and fcfToNi; marginNote says which (revenue below profit, FCF above revenue) earlier |
| Performance | perf1d, perf3d, perf1w, perfWtd, perf2w, perf20d, perf1m, perfMtd, perf40d, perf60d, perf1q, perfQtd, perf4m, perf6m, perf52w, perfYtd, perf1y, perf3y, perf5y, perf10y |
Cumulative price change from unadjusted closes up to performanceAsOf: 1d to 60d, 1w (5 candles) and 2w (10 candles) are rolling windows of N daily candles back from the last one; 1m and 1q take the candle closest to the same day 1 and 3 months earlier (a Saturday takes Friday, a Sunday Monday); Wtd, Mtd, Qtd and Ytd start at the last close before the current calendar week (Monday to Sunday), month, quarter (Q1 Jan-Mar, Q2 Apr-Jun, Q3 Jul-Sep, Q4 Oct-Dec) or year; 4m, 6m, 52w, 1y and longer go back to the last close on or before the same date that many weeks, months or years earlier (a month back from the 31st is the end of the shorter month) |
| Total return | ytd, tr1y, tr3y, tr5y, tr10y, cagr3y, cagr5y, cagr10y, siAnn |
Cumulative and annualized return from dividend and split-adjusted closes; siAnn is since listing |
| Market | price, week52High, week52Low, beta, sharesOutstanding |
Yahoo Finance; when the quoteSummary snapshot fails, week52High and week52Low are the highest and lowest close of the last 52 weeks of the chart |
| Price and swings | pctFrom52wHigh, athPrice, athDate, athBasis, pctFromAth, volatility1y, sigmaFromMean60d, high60d, low60d |
Pure formulas in scripts/metrics/swing.ts over the full daily chart (the published history keeps daily rows for 31 days only), from closes adjusted for splits but not for dividends (Yahoo close, not adjclose): pctFrom52wHigh = (price / week52High - 1) x 100; athPrice is the highest close of the downloaded history with its athDate, athBasis names that history (daily closes since <first date>, the listing with the default HISTORY_RANGE of max), pctFromAth = (price / athPrice - 1) x 100; volatility1y = sample stdev of the last 252 daily log returns x sqrt(252) x 100 (needs 253 closes); sigmaFromMean60d = (price - mean of the last 60 closes) / their sample stdev; high60d and low60d are the highest and lowest of the last 60 closes. Too short a history or no spread gives null, never 0 |
| Foreign issuers | isAdr, country, ttmIsAnnual |
country is the Yahoo assetProfile.country; isAdr is true for an issuer outside the US whose latest annual SEC report is a 20-F (no source flags an ADR as such, so New York registry shares such as ASML count too, 40-F filers do not); ttmIsAnnual is true when TTM is the last fiscal year because the issuer files no quarterly XBRL |
| Provenance | returnsBasis, performanceAsOf |
Mandatory: how the returns were computed and the ISO date of the last price they are as of |
Caveats:
performanceAsOf lags the others measures a different window, so rank them with Hide stale or a Return As Of filter0; the one exception is a dividend yield of 0, which honestly means no payment in the last 12 monthsnetDebtToEbitda describe the latest fiscal year of the 10-K (fundamentalsAsOf); the SEC quarter metrics describe the trailing twelve months up to ttmAsOf; the row carries fundamentalsBasis (SEC, SEC with Yahoo gap fill, the 20-F or 40-F of a foreign issuer in us-gaap or ifrs-full with or without the gap fill, or Yahoo only)fundamentals.checks in meta.json, failures in the log and the step summary with a metric coverage table per sector): assets = liabilities + equity, gross profit = revenue - cost of revenue, four quarters = fiscal year (1% each, reported only); SEC TTM revenue more than 20% away from the Yahoo snapshot revenue is reported (revenue definitions differ, banks and insurers most of all); only a ratio above 5 or below 1/5 (SCALE_ERROR_RATIO, a unit or scale error such as ×1000) withholds that run's SEC values and keeps the published ones (marked withheld in the step summary)index.json and every meta.json carry schemaVersion; the feed only gains fieldsttmIsAnnual) whose fiscal year ended more than 12 months before the last close has no pe, ps, pFcf, pb and evEbitda (and nothing derived from that P/E, such as forwardToTtmPe)evEbitda and netDebtToEbitda (and a foreign issuer's enterpriseValue) have a value; a REIT without operating income still has no EBITDA. EPS of an issuer without a diluted EPS tag is net income over the SEC diluted shares of all classes (DCF on the ticker page), never over Yahoo's sharesOutstandingpe, ps, pFcf, pb, enterpriseValue and evEbitda as market cap over the SEC amounts in USD (P/E = market cap / TTM net income), never price over EPS: EPS in a 20-F is per ordinary share, the price per ADR, and the ADR ratio is not in the SEC data. Growth and margins stay in the reporting currency so the exchange rate cannot bend a trend; forwardPe, forwardPs, pePct5y and pFcfPct5y stay empty for them. The run log and the step summary count the ADRs by source (ADR fundamentals: N ADRs, SEC ifrs-full, SEC us-gaap, Yahoo fallback, none). The scale check of an annual-only TTM allows 50% (Yahoo's revenue is a real TTM, growth alone moves them apart)Revenue (TWD)) and in the subtitle, with no $ on the amountsEQUITY (ETFs, funds) is skipped; so is a security without a market cap (SPAC units and warrants, baby bonds, preferred shares) and a CIK that has no SEC company facts and no Yahoo statements (closed-end funds, trusts)index.json (3.8 KB per row, one company per line); it stays under the 1 GB GitHub Pages size limit. A full local run (2026-11-20, CONCURRENCY=24, --signals) took 16 min for the 7,154 listings, about 7.4 stocks per second with 8 SEC requests per second as the limit, so one 25-minute run covers the whole universe (the GitHub runner can be slower; a run that hits the soft deadline saves the cursor and the next run continues, the published index grows with every run). The update job of the workflow has a 45-minute timeout for the 25-minute updater plus the cache, build and the publish; since the feed is pushed to gh-pages as one parentless commit and not committed to main, the Git history of main does not grow with every runKeep this table, scripts/update-data.config.json, CONTROL_NAMES and --help in sync
| Control | Default | Meaning |
|---|---|---|
MAX_FETCHES |
0 (all) |
Batch size: with a positive value the updater stops after that many stocks and the next full-universe run continues after the cursor saved in api/stocks/update-state.json (restored with the feed, see Publishing); empty or 0 is a full pass (a run that hits the 25-minute soft deadline also saves the cursor) |
REQUEST_SLEEP |
1 |
Minimum delay in seconds between request starts of one worker lane, including retries; SEC and Yahoo have their own lanes, and all SEC requests also pass one gate of 8 per second (SEC fair access allows 10 per IP); 0 turns all pacing off |
CONCURRENCY |
24 |
Number of parallel workers; each worker owns a request lane per provider (SEC, Yahoo) paced by REQUEST_SLEEP; 24 lanes refresh about 7.4 stocks per second (16 min for the whole universe locally), bound by the SEC gate |
MAX_RETRIES |
2 |
Integer >= 1; retries after the initial request; only network errors and HTTP 403/408/425/429/5xx are retried with exponential backoff |
EXCHANGES |
Nasdaq,NYSE,CBOE |
Listing exchanges to include, as named in the SEC company table |
TICKERS |
empty (all) | Space-, comma- or semicolon-separated ticker allowlist (BRK.B and BRK-B both work); blank means every stock listed on EXCHANGES; a run with TICKERS never reads or moves the rotation cursor |
MARKET_CAP |
: |
Market cap range in USD (strict min:max); each bound may use K, M, B or T, for example 10B: |
DIVIDEND_YIELD |
: |
Dividend-yield percentage range |
HISTORY_RANGE |
max |
Yahoo chart range for the price history (max, 10y, 5y, ...); a limited range is requested with explicit period1 and period2 |
HISTORY_PAGE_SIZE |
1000 |
Rows in each generated history JSON page |
SKIP_YAHOO |
false |
Keep the published market data and history while refreshing SEC fundamentals |
SEC_UA |
daggerok ETF feed daggerok@gmail.com |
SEC User-Agent override; SEC policy requires automated tools to declare a contact; the protected SEC_UA Actions variable wins when nonblank |
VERBOSE |
false |
Print per-stock retry and fallback notices |
USE_SYSTEM_CA |
auto |
TLS trust store: auto restarts the updater once with Bun's --use-system-ca when a request fails with an untrusted-certificate error; true always uses the system CA store; false never restarts. Not an individual workflow input: use advanced, the config file or the CLI environment |
PERFORMANCE_1D, _3D, _1W, _WTD, _2W, _20D, _1M, _MTD, _40D, _60D, _1Q, _QTD, _4M, _6M, _52W, _YTD, _1Y, _3Y, _5Y, _10Y |
: |
Cumulative price change ranges in % (min:max), the windows of the perf* metrics; only _YTD to _10Y are individual workflow inputs (the workflow input limit), pass the short ones in advanced, for example {"PERFORMANCE_20D": "10:"} |
TOTAL_RETURN_YTD, _1Y, _3Y, _5Y, _10Y |
: |
Cumulative total return ranges in % (min:max) |
TICKERS combines with the market cap, yield and return filters using AND logic; it does not override them. A stock without a value for an active range does not match it. Filtered or bounded runs (TICKERS, MAX_FETCHES, any range filter, SKIP_YAHOO) never shrink the feed: stocks that are not selected, are skipped by a filter or fail keep their published row and data files, and api/stocks/index.json always lists every stock that has a companies/*/meta.json. The one exception is a delisted stock: a run without TICKERS drops a row whose ticker is gone from the SEC exchange table and whose last price is older than 60 days (both conditions, so a transient gap in the table never drops a live stock) and prints it as DELISTED; its folder stays until ./scripts/update-data.ts --prune removes it (run by hand about once a quarter). The default run covers the whole universe: every Nasdaq, NYSE and Cboe listing of the SEC table except preferred shares, warrants, rights and units (tickers ending in -P*, -W*, -R*, -U*) and except securities Yahoo reports without a market cap or as funds. Narrow it with TICKERS or a MARKET_CAP floor
TICKERS="AAPL MSFT JPM XOM" ./scripts/update-data.ts
MAX_FETCHES=500 ./scripts/update-data.ts
MARKET_CAP="10B:" ./scripts/update-data.ts
DIVIDEND_YIELD="2:" TOTAL_RETURN_5Y="50:" ./scripts/update-data.ts
SKIP_YAHOO=true ./scripts/update-data.ts
./scripts/update-data.ts --signals   # the update, then api/stocks/signals.json against the index before the run
The browser app lives in src/: index.html (markup), main.tsx (TypeScript), index.css (Tailwind CSS v4 plus the app styles) and favicon.ico, built by Parcel into dist (bun run build, same setup as daggerok/csv and daggerok/options-desk) - no tsconfig.json needed. Bun runs the updater TypeScript out of the box
Verification before every publish:
bun install --frozen-lockfile
bun test
bun build --target=bun scripts/update-data.ts --outfile=/dev/null
git diff --check
bun test also covers the README controls table, the config file, --help and the workflow
src/core/ is the screener core, independent of the UI and free of DOM imports (one exception: src/core/screener-ui/, below), so the browser app and Bun scripts share it; each module keeps its *.test.ts next to the code and bun test runs them too:
src/core/i18n/: t(key, params) over the en and ru dictionaries, English fallback, the chosen language remembered in the browsersrc/core/metrics/: the metric registry, one entry for every key of metrics in this feed and in the 29 ETF brand feeds, with formula, unit, basis, source, direction and a name, short text and guide article in English and Russian; bun src/core/metrics/check-feeds.ts api/stocks ../<Brand>/api lists live feed keys without an entrysrc/core/scoring/: the stage 5 scoring over a screener universe: config.json (weights, archetype rules, statuses, stop factors, flags and Why notes in the preset format), its validation against the registry, the five scores, archetype, status, flags (score.ts) and the Why and flag texts in both languages (why.ts); load-config.ts reads the config in Bun for tests and the signals jobsrc/core/signals/: the stage 8 signals: the previous and the new index scored and screened like the page (signals.ts: preset entries and exits, flags, status, archetype, score moves, quiet stocks, two-run exits, the restatement mark, 12-week retention), the thresholds (config.ts: score move 15, two runs, 84 days), the texts and the summary body of --signals-issue (text.ts) and the repo inputs of the updater (load.ts: base presets, user-data/presets, user-data/peers.json, the scoring config)src/core/dcf/: the DCF of plan stage 7: both flows, scenarios, margin of safety, the gap flag and the inputs read from meta.json (the tests repeat three hand calculations to the cent, one of them Alphabet)src/core/research/: TAM scenarios, the notes Markdown format with the nine questions, the promises tracker against the SEC quarters, and the repo and browser copies of these filessrc/core/ticker/: the statements with year-over-year changes, the long-run chart series and the peers table rows of the ticker pagesrc/core/similar/: "Similar to X" (plan stage 6): the metric groups and starting values (config.json, schema and validator in config.ts, load-config.ts for the tests), percentiles in the sector or among a security type, the distance with pairwise exclusion of empty metrics, top hits with the main differences and the filter made from X (similar.ts)src/core/screener/: the engine (operators >, >=, <, <=, =, range, in; absolute, market, sector, industry, peers and history scopes with percentiles, the benchmark scope (value minus a named ticker's value); missing as fail or skip; soft "N of M" mode; and, or, not expressions; funnel and intersections), the row adapter (stock rows for this page, etfRow for the ETFs hub), the base presets in presets/*.json with their index.json (horizon variants and chip pickers resolved by variants.ts), the ETF classes etf-classes.json (geared, index family and variant, sector or theme, the qualified dividend estimate) and the yearly qualified dividend table qdi.json (written by the workspace tool etf-std/qdi/build.ts), own presets (canonical JSON, export file, import, share link, browser and repo copies in own.ts), peer groups (repo file plus browser overlay, export and import in peers.ts); bun src/core/screener/bench.ts measures it on a synthetic universe of 10,000 rowssrc/core/screener-ui/: the screener panel, the only core module that touches the DOM: an optional universe type switch (Stocks has one type, so none is shown), All of or Any of, the preset chips with refinements, own presets and horizons, the condition editor with the funnel, the status line, the peer group editor, preset export, import and share links. createScreenerUi(host) takes a host (ScreenerUiHost): the scored universe of the host rows and its version (the scores provider, with snapshotResult for the pass bits of scores.json), the table render, the localStorage prefix (stocks keeps the keys stocks-screener, stocks-screener-variants, stocks-screener-pickers, stocks-own-presets, stocks-peers), an optional headNote line under the head row (the hub's market state line), t() and pick(), the universe types of the switch (one type hides it; Stocks passes ['stock'], the hub ['etf']), a presetFilter (Stocks keeps the presets that apply to stocks) and the preset and peer file URLs. Its styles are screener.css next to it, imported by src/index.css. The ETFs hub mounts the same panel over its fund table: its package.json depends on "stocks": "github:daggerok/Stocks#<commit>" (Bun installs the whole repo, no build step), it imports createScreenerUi from stocks/src/core/screener-ui and @import "stocks/src/core/screener-ui/screener.css"; in its CSS, so a change here reaches the hub when it moves its pinned commituser-data/ holds the owner's public presets, peer groups, notes, TAM scenarios and promises, committed from browser exports (see user-data/README.md)
| Exchange | Where to get the data |
|---|---|
| Nasdaq | sec.gov company tickers | Stocks |
| NYSE | sec.gov company tickers | Stocks |
| Cboe | sec.gov company tickers | Stocks |
| Application | Data provider | Repository |
|---|---|---|
| ETFs | The generated ./api/<slug> static feeds of the 29 ETF brand repositories (issuer pages, SEC EDGAR N-PORT-P and Yahoo Finance) |
ETFs |
MIT - same as all sibling repositories.
This is an independent, unofficial tool; it is not affiliated with, endorsed by, or sponsored by Nasdaq, NYSE, Cboe, the U.S. Securities and Exchange Commission, Yahoo or any listed company. All trademarks, company names and tickers referenced here are the property of their respective owners. All data is reproduced from public SEC EDGAR filings and Yahoo Finance for research purposes; nothing here is investment advice
daggerok/Stocks is a public repo on GitHub by daggerok. US stocks screener (Nasdaq, NYSE, Cboe) with ETFs: SEC EDGAR XBRL fundamentals (quarters, TTM, ADR and IFRS), Yahoo prices, presets, five scores, statuses, flags, DCF and weekly signals; static feed by a Bun updater.
It declares the MIT license on GitHub.
Its maker has not tagged a system, so it is unknown here. Its README says what it needs.
Open "Take it" on its page: Take My Repo writes an install plan for your machine and hands it to your AI agent (Claude Code, Codex or Cursor), which asks you before each step. Take My Repo has not tested it on any machine.
Its last change on GitHub was on 2026-11-21. Take My Repo does not judge from that whether it is maintained.
Nobody has reviewed it on Take My Repo yet, which says nothing about its quality.
The most popular HTML, CSS, and JavaScript framework for developing responsive, mobile first projects on the web.
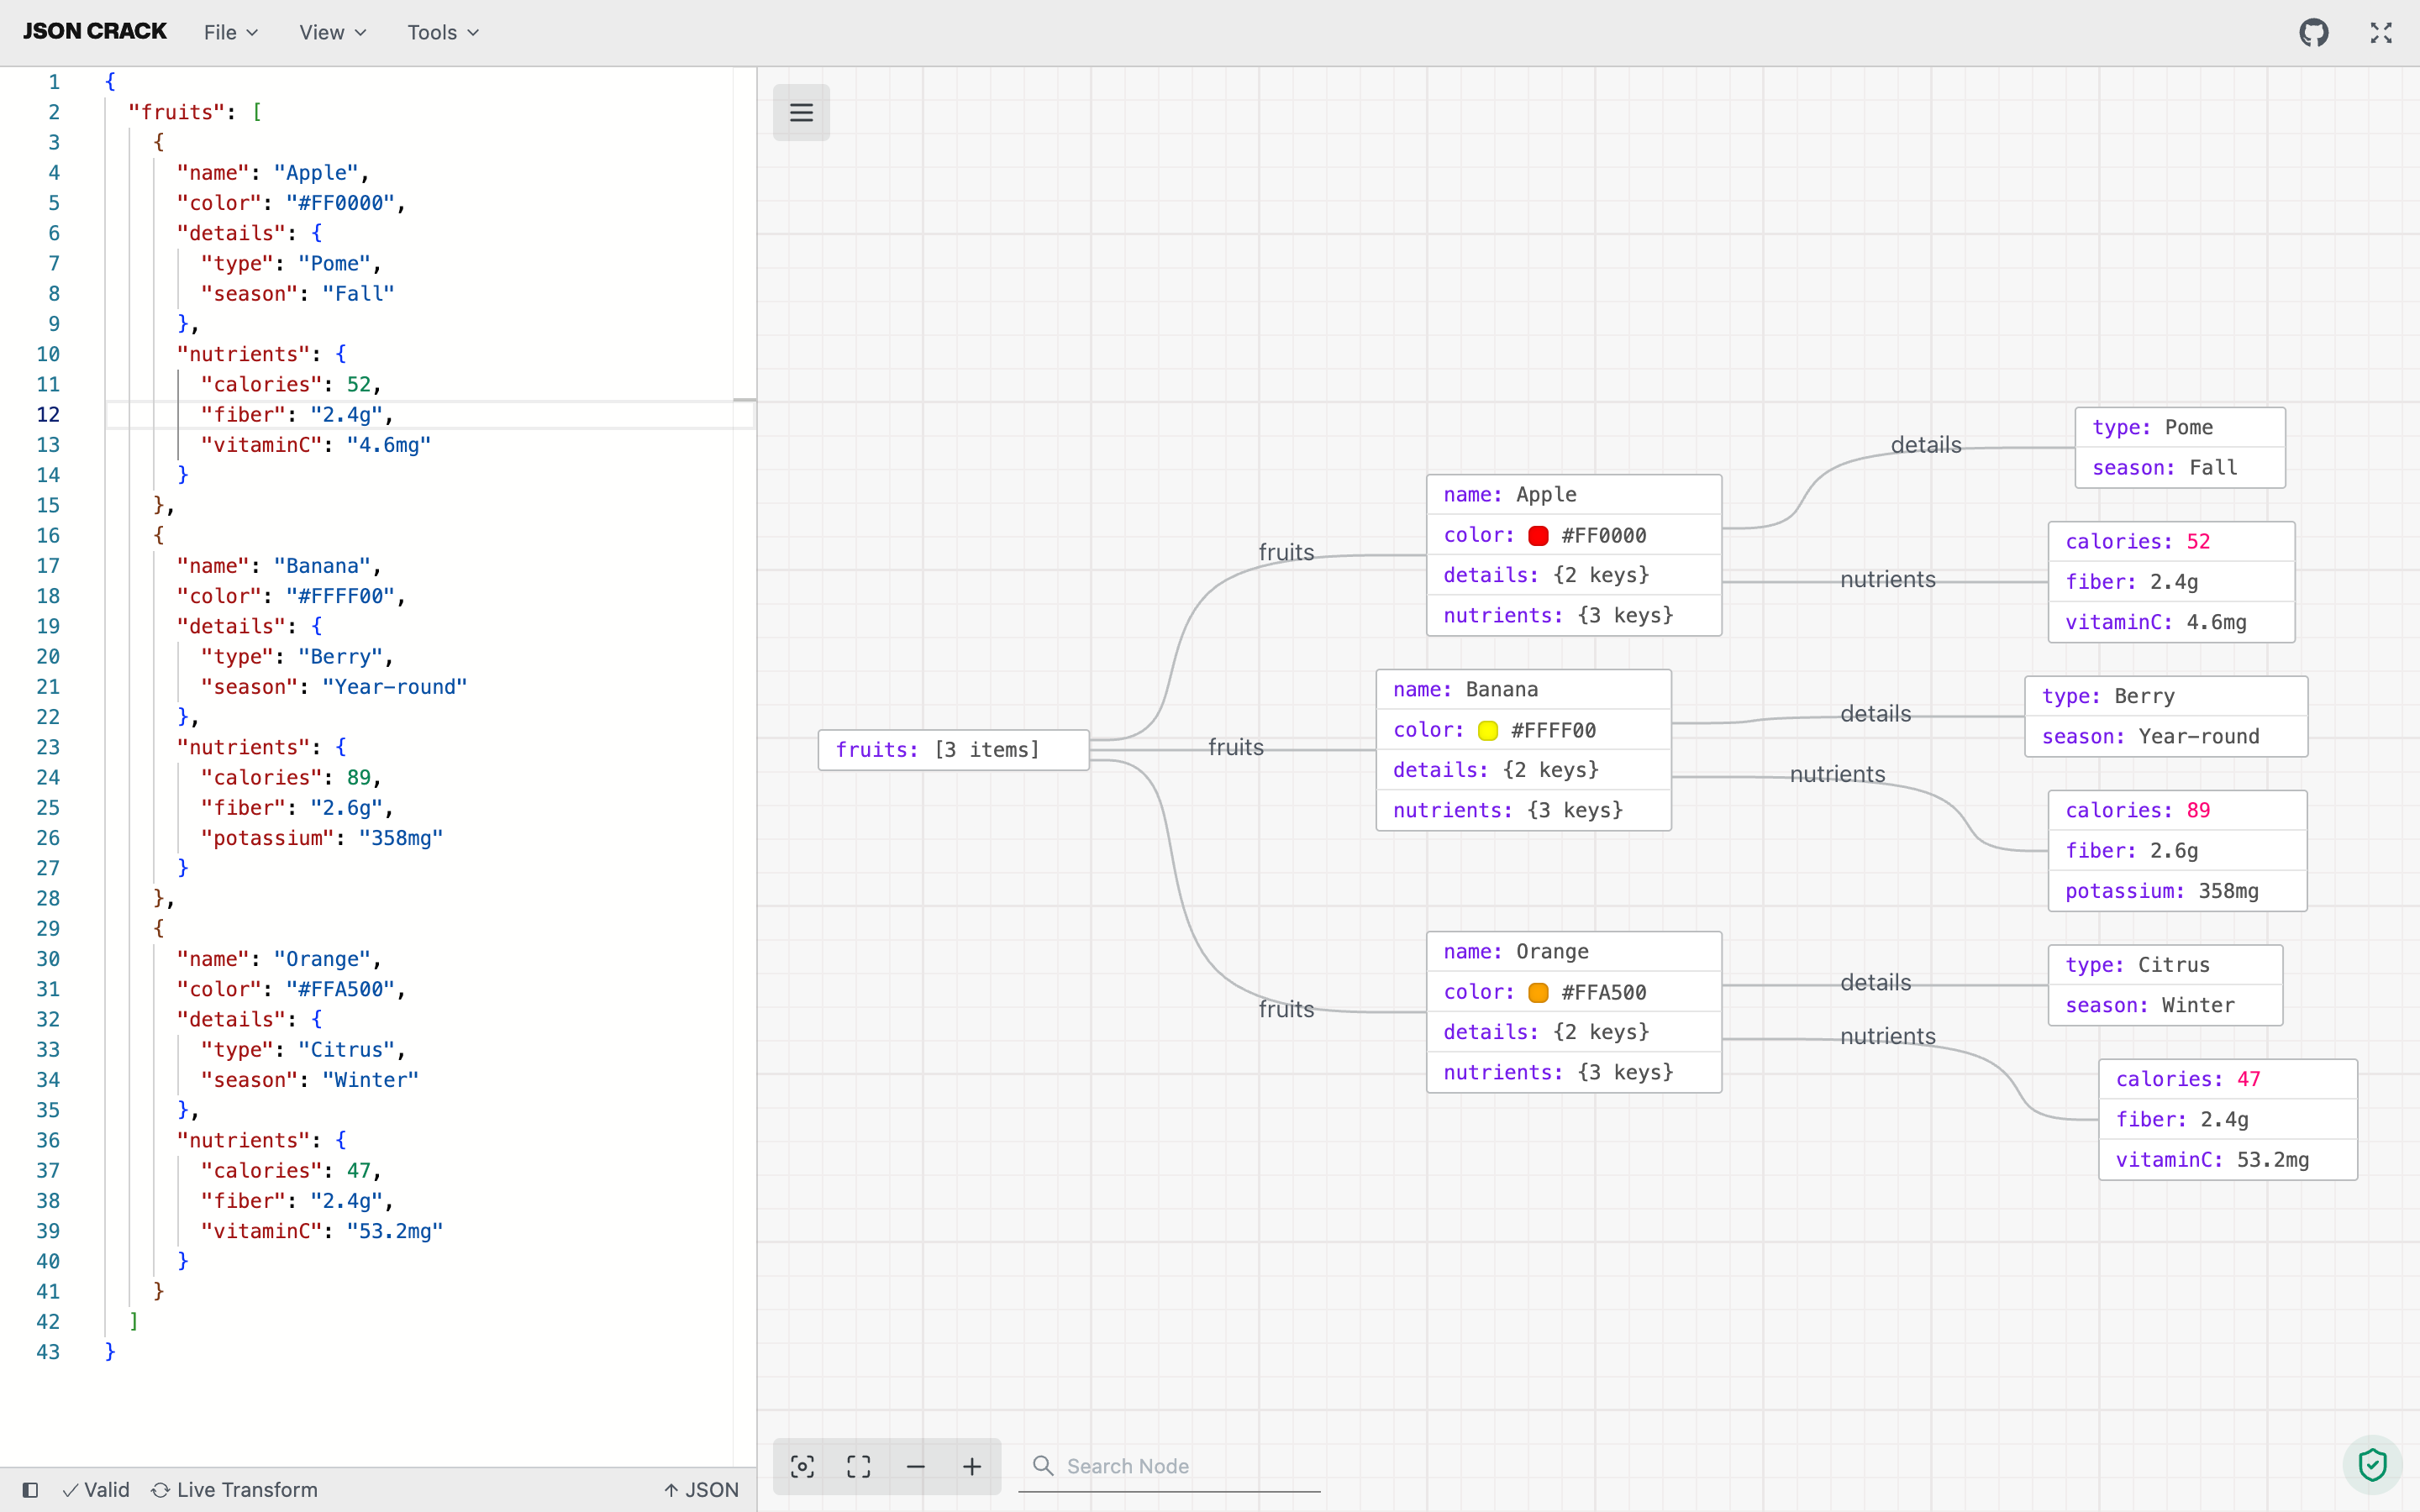
✨ Innovative and open-source visualization application that transforms various data formats, such as JSON, YAML, XML and CSV into interactive graphs.
TradingAgents: Multi-Agents LLM Financial Trading Framework

A Programmer’s Guide to Longevity | Helping everyone live a longer, healthier, happier life. Available in 8 languages.
Coding articles to level up your development skills
📗 SheetJS Spreadsheet Data Toolkit -- New home https://git.sheetjs.com/SheetJS/sheetjs
full-stack java file server with no limitation for files uploads and downloads: spring-boot + Gradle Kotlin DSL, postgres / h2, apache fileUpload, lombok, mustache, docker, jgiven, powermock, gradle, CI, bootstrap 4, bootstrap-filelinput, webjars, maven github-release-plugin, nginx, haproxy, reverse-proxy
Ionic + Nuxt.js setup https://daggerok.github.io/ionic-nuxt-app/
This repository contains simple example of using spring-boot 2.x + nuxt.js (vue / vuetify) SPA with not-found routes configured on backend and frontend.
This repository contains JavaEE examples (including JAX-RS, Wildfly Swarm, MicroProfile, Gradle, Docker, Kotlin, etc)
Kotlin coroutines Reactor Spring Boot Webflux R2DBC Postgres Flyway Maven example
This repository demonstrates how to implement custom written Distributed Lock starter based on Spring Boot and MongoTemplate with Testcontainers integration testing and fabric8 docker-maven-plugin
This page is also available as structured data, with the same sources and dates.
/api/v1/resources/gh/daggerok/StocksTake My Repo has not tested this on your machine. Requirements come from the project's own documentation.


