gl-spectrogram
:milky_way: Render spectrogram of any audio source in webgl or canvas2d
- 70
- 6 wk ago
Repo dy/gl-spectrogram, read from GitHub 21 min ago. dy has not joined Take My Repo.
In short
dy/gl-spectrogram is a public repo on GitHub by dy. :milky_way: Render spectrogram of any audio source in webgl or canvas2d. It declares no license on GitHub. Public does not mean open source: without a license, nobody is granted the right to reuse it. It is written mainly in JavaScript, has 70 stars and last changed on 2026-10-09. Nobody has reviewed it on Take My Repo yet, which says nothing about its quality. Read from GitHub on 2026-11-22.
gl-spectrogram
WebGL2 spectrogram renderer for audio editors. Each render computes what the view shows on the GPU: an FFT frame per device-pixel column, reassigned, so a steady tone draws one pixel row thin and a click one pixel column thin. Zooms, pans and frequency zooms draw sharp in the frame they happen, over an hour of 48 kHz audio.
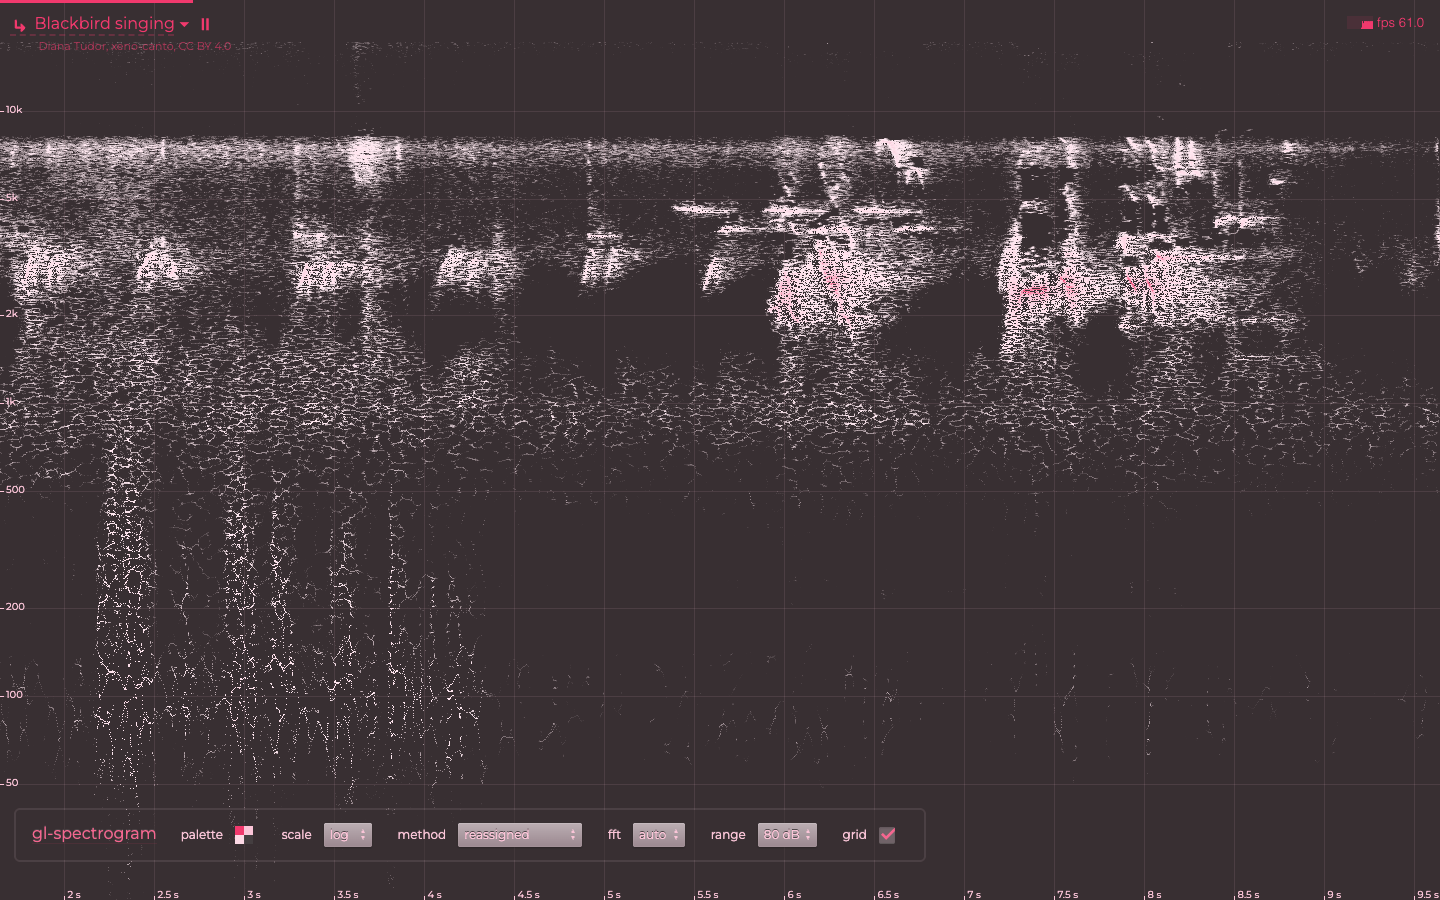
Demo: a blackbird, Bach's cello, Chopin, Vivaldi, Beethoven, a poem read aloud, live radio, the microphone or your own audio, coming in from the right as it sounds, in random palettes. Drag or scroll back; wheel or pinch zooms time, Shift+wheel or a vertical pinch frequency. The v1 demo runs on v2 too.
Usage
npm i gl-spectrogram
import Spectrogram from 'gl-spectrogram'

// the drawing buffer is yours to size
canvas.width = canvas.clientWidth * devicePixelRatio
canvas.height = canvas.clientHeight * devicePixelRatio

let sg = new Spectrogram(canvas, { data: samples, sampleRate: 48000 })  // mono Float32Array
sg.render()

// on every frame of a zoom or pan; zoomed out, columns take more frames over the next renders
function frame() {
  sg.update({ range: [from, to] }).clear().render()
  if (sg.pending) requestAnimationFrame(frame)
}
Silence is transparent: the canvas shows what is under it, and the default ramp from background to color assumes black there. Over a light page, { background: 'white', color: 'black' }.
Stereo, as two lanes on one canvas:
let lanes = [left, right].map((data, i) => new Spectrogram(canvas, { data, sampleRate, viewport: [0, i * 100, 800, 100] }))
for (let sg of lanes) sg.update({ range }).clear().render()
Spectrograms and gl-waveform lanes can share one WebGL2RenderingContext.
API
new Spectrogram(target, options?)
target is a canvas, whose WebGL2 context is created (preserveDrawingBuffer: true, antialias: false) or reused, or a WebGL2RenderingContext to share. The context needs EXT_color_buffer_float; without EXT_float_blend cells are half floats. Spectrograms on one context share their shader programs and FFT scratch; each has its own sample texture and cells. options go to update().
sg.update(options)
| Option | Default | Meaning |
|---|---|---|
data |
empty | Mono samples; replaces all data. A Float32Array is referenced, not copied, and never written to; other array-likes are converted. |
sampleRate |
44100 |
Hz. |
range |
[0, length] |
Visible [from, to] in samples: fractional, may extend past the data. |
scale |
'log' |
Frequency axis: 'log' (octaves) from 20 Hz, 'mel', 'erb' (equal space per auditory filter, ERB-number 21.4 · log10(1 + 0.00437 f), Glasberg & Moore 1990) or 'lin' from 0 Hz, to Nyquist. |
method |
'reassigned' |
How a column draws its frames: 'frames', each frame's Hann spectrum as it is (Allen 1977); 'reassigned', each bin's power at the time and frequency its phase places it (Auger & Flandrin 1995): a tone one row thin, a click one column thin; 'synchrosqueezed', moved in frequency only, time staying the frame's (Thakur & Wu 2011); 'bands', frames of a length by band, long for the lows, short for the highs, as editors blend several lengths, each crossfading into the next over a third of an octave either side of their edge, so no band ends in a seam; 'tapers', three sine tapers' spectra averaged (Riedel & Sidorenko 1995): steadier noise; 'wigner', the pseudo Wigner–Ville distribution of the analytic signal under a Hann lag window (Ville 1948): lines thin without reassignment, and a cross-term between any two components. Each reads a full-scale sine at 0 dB. |
combine |
'mean' |
How a column past half a window joins its frames, and the spectra given it spans: 'mean', their mean power, so a zoomed-out view reads as the samples do zoomed in, at any zoom and from its first render on; 'max', the loudest, so a click between frames reads at its own level, noise reading higher the more frames a column holds. |
band |
whole axis | Visible [low, high] in Hz, bottom to top. |
viewport |
whole canvas | [x, y, width, height] in CSS px from the canvas' top-left corner. |
pixelRatio |
devicePixelRatio |
Device px per CSS px. |
levels |
auto | [floor, top] in dB, 0 dB being a full-scale sine. Auto: the top is the whole data's loudest cell, never under -60 dB. |
depth |
80 |
dB from the top to the floor, with auto levels. |
gain |
1 |
Amplitude factor on the picture (power × gain²), as a preview of a level change. |
size |
fits the view | FFT size, a power of two from 16 to 16384. Auto: 40 ms (2048 at 48 kHz), longer while a bin spans over 4 rows in the middle of a zoomed band, up to 4096. |
color |
white | One color: the loudest level's, drawn at the coverage that steps lightness evenly over background. An array of colors: a colormap from the floor to the top. CSS colors, oklch() included, or [r, g, b, a] in 0..1. |
background |
black | What is under the canvas, where one color's ramp starts. |
Keys left out keep their value, null restores the default. update({ range }) only stores the range: cheap enough for every frame.
Methods
| Method | Does |
|---|---|
sg.render() |
Computes the columns the viewport shows that it lacks, then draws into the viewport, over what is there. Does nothing while the context is lost. |
sg.clear() |
Clears the viewport to transparent. |
sg.push(samples) |
Appends samples. |
sg.set(samples, offset) |
Writes samples from offset, extending the data if needed; a gap before offset reads as silence. |
sg.spectra(levels, { size, hop, at, length }) |
Spectra of samples held elsewhere: per column of hop samples, each bin's power over its Hann frames of size joined as combine joins a column's frames (their mean, or the loudest), a byte per bin, (dB + 150) · 1.6. Where the samples a column reads are not held, it draws from these, as the samples would zoomed out (0.2 dB apart at the median, 0.8 at the 95th percentile; the loudest, 0.3 and 3.8); set() writes samples over them for the exact picture. Hours of audio with the samples only where it is zoomed in. |
sg.drop(from, to) |
Lets go of the samples of the whole 64K chunks within [from, to); the spectra given draw them again. |
sg.pick(x, y) |
The cell at x, y CSS px from the viewport's top-left: { from, to, low, high, level }, samples [from, to), Hz [low, high), dB. null off the data. |
sg.pick(x) |
The column at x: { from, to, levels }, a level per row from the bottom. |
sg.destroy() |
Releases the textures, the data and the event listeners. |
Properties: sg.gl, sg.canvas, sg.length, sg.range, sg.band (Hz), sg.levels (dB), sg.size (FFT size of the view), sg.pending (the last render left columns short of frames: render again).
import { scales } from 'gl-spectrogram': the axes the rows are spaced on, for labels that match them. scales[name].at(f, lo, hi) is where f Hz sits between lo and hi, 0..1; .of(u, lo, hi) is the frequency there; .low is the axis' floor.
Rendering
- Levels: a cell holds the power reassigned into it, normalized so a full-scale sine reads 0 dB: Hann's coherent gain of 1/2 puts (N/4)² in the sine's bin and its main lobe holds 1.5 times that (Harris 1978, table 1), all of it moved into one cell. A sine of amplitude 0.1 reads -20 dB at any FFT size. Broadband energy sums over the cell's band, so noise reads the same at any FFT size too.
- Reassignment (Kodera, Gendrin & de Villedary 1976; Auger & Flandrin 1995): each bin's energy moves to the frequency and time its phase gives, k̂ = k − N/2π · Im(X_Dh X̄_h)/|X_h|² and t̂ = t + Re(X_Th X̄_h)/|X_h|². A steady sine is one row thin, a click one column thin, a sweep one line. Energy placed outside its frame's window or outside 0..Nyquist is dropped. Where two partials share a Hann lobe they interfere, which is what the 40 ms window avoids for voices and most music;
sizesets it. - Time: column q spans samples [q·cw − ½, (q+1)·cw − ½), cw being samples per device pixel (one at least), so sample k's energy sits under x = k, where a waveform draws the sample. Columns are anchored to multiples of cw: a pan moves whole columns and computes only those it uncovers. Zoomed in, a reassigned frame gives to columns as far as half a window either side of its own (1460 of them at 1.4 samples per px and FFTs of 4096): the frames are swept, each transformed once and given to every cached column it reaches, so a pan transforms the frames it uncovers, not those again a window either side.
- Zoomed out, past half a window per column, a render gives each new column one frame, at its middle. Renders after it add frames, evenly across each column, until every sample is in one (hops of at most N/2). A column is its frames' mean (
combine), each further frame blended in at 1/(j + 1), so it reads from the first render as it will settled, only its speckle settling; or the loudest of them, so a click between frames shows once found, the noise floor rising as frames come (a noise bin's power is exponentially distributed, and the loudest of k such draws averages H_k = 1 + 1/2 + … + 1/k times one: 2.6 dB more at 3 frames, 5.5 dB at 19).pendingis true until then; a render adds about a frame per two pixel columns, 256 at least, so settling costs a few milliseconds a frame. - Auto levels: the top is the loudest cell of the whole data drawn as 1024 × 512 cells, one frame each, reduced on the GPU and read by the draw shader, so it holds across zooms and costs no readback. A sine's onset reads above the sine: reassignment gathers the energy of an envelope's edges.
- Color: one color is drawn at the coverage that makes OKLab lightness (Ottosson 2020) step evenly over
background, from its lightness at the floor to the color's at the top, transparent at the floor. A colormap's stops sit evenly from the floor to the top, interpolated in premultiplied OKLab. - NaN and ±Infinity read as silence.
- Blending is premultiplied, over whatever is under the viewport. The context must have
premultipliedAlpha(the default). - Context loss: nothing throws while the context is lost; on restore, each spectrogram that had rendered uploads again and redraws.
Architecture
- Samples live in chunks of 64K, views into your array for
update({ data }). On the GPU, an R32F array texture holds a layer per block of 2²⁰ samples, and an index maps blocks to layers, so gaps allocate nothing. Rows of 2048 samples go up when a frame first reads them: a view of an hour uploads its frames' rows, not the hour. - A render picks the columns under the viewport and finds them in a cache: cap × rows float cells, each slot tagged with its column. Missing columns are computed in runs; a run transforms every frame whose window reaches it but adds only into its own columns, so columns computed in turns hold what they would computed at once, whatever the pan. Reassigned frames reaching 8 columns or more either side are swept instead: the cache holds frames [f0, f1) given to columns [v0, v1), each column whole once every frame reaching it is among them; a pan adds the frames it uncovers, given to every column they reach, and columns new to the cache first take the frames already swept that reach them (two windows' worth at most, on turning back). An edit cuts the sweep at the first frame reading it.
- FFT, one complex transform a frame: z[n] = x[n] · (1 + i·(n − N/2)·h[n]·2/N). Its real part is the rectangular spectrum X, from which Hann and its derivative are three neighbouring bins (X_h = X_k/2 − (X_k−1 + X_k+1)/4); its imaginary part carries the time-weighted Hann. Stockham autosort in fragment passes, radix 8 after a first stage of radix 2, 4 or 8 that gathers the windowed samples; twiddles from a table in doubles; two frames per RGBA32F texel, batches of 2²¹ texels. Samples are addressed as integers, so offsets past 10⁹ draw as offset 0 does.
- Reassignment draws a point per frame and bin, at its column and row, into the cells with additive float blending. The row follows the scale's formula on the reassigned frequency; the column is counted from the frame's own, so a point lands in the same cell whichever run draws it.
- Further frames of a zoomed-out column sum apart and join the cells by constant-alpha blending into the mean, or by
MAX. - The picture is one quad per viewport: cell, to dB, through a 256-texel color table.
Computing the same frames on the CPU in JavaScript, three FFTs each, takes about 340 ms per lane of 2880 columns on the machine below; here they take about 3.5 ms.
Measured
npm run bench: headless Chromium 153 on an Apple M4 Max (Metal) with other jobs running (load average 23 to 27), two lanes of 1440×200 CSS px at DPR 2 (2880×400 device px each), synthetic speech at 48 kHz. GPU time per frame for both lanes, from EXT_disjoint_timer_query_webgl2 (gl.finish() returns before the GPU is done in Chrome on Metal). Medians of three runs.
| Samples | First picture | Whole view settles | Zoom frame, mean / p95 | Pan frame | Band zoom frame, mean / p95 | push() 0.1 s + frame |
Unchanged frame |
|---|---|---|---|---|---|---|---|
| 1M | 21 ms | at once | 6.6 / 14 ms | 0.9 ms | 12 / 21 ms | 7.4 ms | 0.3 ms |
| 10M | 44 ms | 9 renders, 66 ms | 8.1 / 20 ms | 0.9 ms | 11 / 17 ms | 5.5 ms | 0.1 ms |
| 172.8M (1 h) | 560 ms | 117 renders, 1.1 s | 10.9 / 26 ms | 1.1 ms | 12 / 18 ms | 5.0 ms | 0.1 ms |
Zooming continuously on requestAnimationFrame runs at 59 to 60 fps at every size; each zoom frame recomputes every column. Zoomed in, panning as playback scrolls (two lanes of 1884 × 450 CSS px at DPR 2, FFTs of 4096, 44.1 kHz, a 120th of a second a frame): 5.7 ms a frame at 1.4 samples per px, 2.7 ms at 4.3, where computing each column with its own window's reach of frames took 34 and 17. First picture is wall time from update({ data }) to the pixels read back: upload of the rows the frames read, the whole data's picture for levels, the view. For an hour most of it is allocating the sample texture: 4 bytes a sample, 691 MB a lane. Other GPU memory: cells of 13 MB per cached view of this size (two kept a lane) and 2 MB for the whole data's; per context, a surface as large as the cells for refining and 64 MB of FFT scratch per FFT size in use (two kept).
Changes from v1
v1 drew magnitude frames pushed to it one at a time, scrolling. v2 computes the spectrogram of samples it holds, for any view of them.
- ESM with a default export, WebGL2, no dependencies. Was CommonJS with gl-component, plot-grid, colormap and 8 more packages, and a 2D canvas version.
- Takes samples:
update({ data }),set(),push(samples). Waspush(magnitudes), a frame at a time. - Draws a range, a band and a viewport, as gl-waveform does; reassigned, one row and one column thin.
coloris a color or a colormap of CSS colors;levels,depth,band,scaleandsizereplaceminDecibels/maxDecibels,minFrequency/maxFrequency,logarithmicand the data texture'ssize.- Added:
pick(),pending,gain,scales, context loss handling. - Removed: the 2D renderer,
gridandaxes(draw them over or under the canvas),weighting,smoothing,fillby colormap name,setFill(),setBackground()(useupdate()), thepushandupdateevents, themagnitudesandpeakproperties,container,context.
Develop
npm test: every cell of 20 views against a CPU reference in doubles (three FFTs a frame, the reassignment formulas as written), within 0.01 dB, over log, mel and lin scales, zoomed bands, FFT sizes 256 to 2048, refined zoomed-out columns, offset 10⁹ and DPR 2; a full-scale sine on the row each scale's formula gives at 0 dB; a click on its column from 0.3 to 2880 samples per px; pans, swept pans, turns and edits zoomed in,push()/set()and refinement against fresh views; previews, levels, gaps, the color ramp's lightness, colormaps, half floats, stale texture layers, context loss, an hour of audio and the API contract. Headless Chromium through Playwright;npx playwright install chromiumif it is missing.npm run bench: the table above.- Demo: any static server at the repo root, e.g.
npx serve, then open/.?source=cellopicks a recording,wqxrthe radio,micthe microphone. The first v2 demo is at/example/stress.html(?minutes=60makes an hour), the v1 demo at/example/old.html.
License
© 2016 Dmitry Yv. MIT License
Questions
What is gl-spectrogram?
dy/gl-spectrogram is a public repo on GitHub by dy. :milky_way: Render spectrogram of any audio source in webgl or canvas2d.
Is gl-spectrogram open source?
It declares no license on GitHub. Public does not mean open source: without a license, nobody is granted the right to reuse it.
Does gl-spectrogram run on macOS, Windows or Linux?
Its maker has not tagged a system, so it is unknown here. Its README says what it needs.
How do I install gl-spectrogram?
Open "Take it" on its page: Take My Repo writes an install plan for your machine and hands it to your AI agent (Claude Code, Codex or Cursor), which asks you before each step. Take My Repo has not tested it on any machine.
Is gl-spectrogram still maintained?
Its last change on GitHub was on 2026-10-09. Take My Repo does not judge from that whether it is maintained.
What do people who ran gl-spectrogram say?
Nobody has reviewed it on Take My Repo yet, which says nothing about its quality.