
streamgraph
:wavy_dash: htmlwidget for creating streamgraph visualizations in R
- 146
- 6 y ago
Repo hrbrmstr/streamgraph, read from GitHub 17 h ago. hrbrmstr has not joined Take My Repo.
In short
hrbrmstr/streamgraph is a public repo on GitHub by hrbrmstr. :wavy_dash: htmlwidget for creating streamgraph visualizations in R. It declares no license on GitHub. Public does not mean open source: without a license, nobody is granted the right to reuse it. It is written mainly in HTML, has 146 stars and last changed on 2021-04-15. Nobody has reviewed it on Take My Repo yet, which says nothing about its quality. Read from GitHub on 2026-11-21.
streamgraph
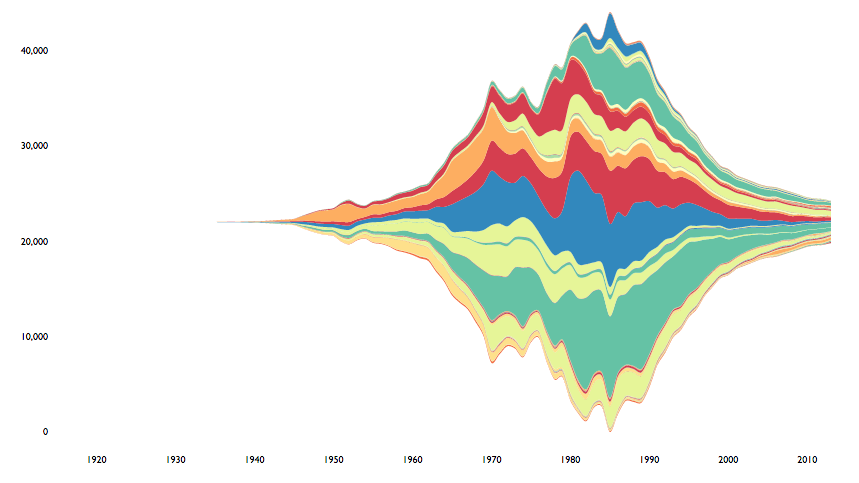
streamgraph is an htmlwidget for making, well, streamgraphs.

A streamgraph (or "stream graph") is a type of stacked area graph which is displaced around a central axis, resulting in a flowing, organic shape. Streamgraphs were developed by Lee Byron and popularized by their use in a February 2008 New York Times article on movie box office revenues. (Wikipedia)
The x axis values can be continous or dates.
TODO
- Support is planned for
xtsobjects, but not for a bit. - Support for categorical/discrete x axis
The following functions are implemented:
streamgraph: Create a new streamgraphsg_axis_x: Modify streamgraph x axis formattingsg_axis_y: Modify streamgraph y axis formattingsg_colors: Modify streamgraph axis text, legend popup label text and tooltip text colors (NOTE: no longer modifies fill colors, usesg_fill_*for fill colors)sg_legend: Add select menu "legend" to interactive streamgraphssg_fill_brewer: Specify a ColorBrewer palette to use for the stream fillssg_fill_manual: Specify a manual color palette to use for the stream fillssg_fill_tableau: Specify a Tableau color palette to use for the stream fllssg_add_marker: Annotate streamgraph with vertical line and labelsg_annotate: Annotate streamgraph with a label
News
- Version
0.8.1released - ggplot2 movies fix; corrected numerous notes from CRAN check - Version
0.8released - support for negative Y axis numbers and upgrade to latest D3 - Version
0.7.5released -key,valueanddatecan be either bare or quoted - Version
0.7released - Newsg_add_markerandsg_annotationto enable annotation of streamgraphs - Version
0.6released - Newscaleparameter tostreamgraphlets you choose between continuous or date scales. - Version
0.5.1released -sg_colorsnow has nothing to do with the stream fills but does set the axis text, legend popup label text and tooltip text. - Version
0.5released - deprecated use ofsg_colors. Its functionality will change soon and is replaced by threesg_fill_*functions (brewer,manualandtableau) which makes more sense, is aligned to theggplot2way of specifying fill aesthetics and now makes it easier to highly customize the streamgraph appearance. - Versioin
0.4.2released - fixed bug (thanks to teammate @bhaskarvk) that causes inconsistent color rendering for each area component (noticeable on resize of flexible width/height graphs) - Version
0.4.1released - removed warning message when supplyingPOSIXctvalues (remember,POSIXctstill only works for granularities >= 1 day) - Version
0.4released - select menu "legend" (interactive only) - Version
0.3.1released - bug fix to fix error withd3.stack;streamgraphwill now see if the date input is a year and automatically convert it to the necessary format (no need to useas.Date) - Version
0.3released - folks can have some fun with newoffsetandinterpolateparameters tostreamgraph - Version
0.2.2relased - rly rly rly fixed tooltips now, also assed ability to format y axis text - Version
0.2.1released - ok, working tool tips for realz now - Version
0.2released - working SVG tooltips; general code cleanup - Version
0.1released
Installation
devtools::install_github("hrbrmstr/streamgraph")
Usage
library(streamgraph)

# current verison
packageVersion("streamgraph")

library(dplyr)

ggplot2movies::movies %>%
  select(year, Action, Animation, Comedy, Drama, Documentary, Romance, Short) %>%
  tidyr::gather(genre, value, -year) %>%
  group_by(year, genre) %>%
  tally(wt=value) -> dat

streamgraph(dat, "genre", "n", "year", interactive=TRUE) %>%
  sg_axis_x(20, "year", "%Y") %>%
  sg_fill_brewer("PuOr")
Please note that this project is released with a Contributor Code of Conduct. By participating in this project you agree to abide by its terms.
Questions
What is streamgraph?
hrbrmstr/streamgraph is a public repo on GitHub by hrbrmstr. :wavy_dash: htmlwidget for creating streamgraph visualizations in R.
Is streamgraph open source?
It declares no license on GitHub. Public does not mean open source: without a license, nobody is granted the right to reuse it.
Does streamgraph run on macOS, Windows or Linux?
Its maker has not tagged a system, so it is unknown here. Its README says what it needs.
How do I install streamgraph?
Open "Take it" on its page: Take My Repo writes an install plan for your machine and hands it to your AI agent (Claude Code, Codex or Cursor), which asks you before each step. Take My Repo has not tested it on any machine.
Is streamgraph still maintained?
Its last change on GitHub was on 2021-04-15. GitHub counts 23 open issues and pull requests. Take My Repo does not judge from that whether it is maintained.
What do people who ran streamgraph say?
Nobody has reviewed it on Take My Repo yet, which says nothing about its quality.