jaaz
The world's first open-source multimodal creative assistant This is a substitute for Canva and Manus that prioritizes privacy and is usable locally.
- 6.8k
- TypeScript
- 9 mo ago
Stack overflow is a professional community for developers. This repo analysis 3 years of developer Survey done by Stackoverflow and do visualization and predict the salary of Data Scientist in future.
Repo recodehive/Stackoverflow-Analysis, read from GitHub 30 min ago. recodehive has not joined Take My Repo.
recodehive/Stackoverflow-Analysis is a public repo on GitHub by recodehive. Stack overflow is a professional community for developers. This repo analysis 3 years of developer Survey done by Stackoverflow and do visualization and predict the salary of Data Scientist in future. It declares the MIT license on GitHub. It is written mainly in Jupyter Notebook, has 242 stars and last changed on 2025-03-04. Nobody has reviewed it on Take My Repo yet, which says nothing about its quality. Read from GitHub on 2026-11-20.
GitHub is limiting requests or did not answer. The facts on this page still come from the last successful read.
Open on GitHubrecodehive/Stackoverflow-Analysis is a public repo on GitHub by recodehive. Stack overflow is a professional community for developers. This repo analysis 3 years of developer Survey done by Stackoverflow and do visualization and predict the salary of Data Scientist in future.
It declares the MIT license on GitHub.
Its maker has not tagged a system, so it is unknown here. Its README says what it needs.
Open "Take it" on its page: Take My Repo writes an install plan for your machine and hands it to your AI agent (Claude Code, Codex or Cursor), which asks you before each step. Take My Repo has not tested it on any machine.
Its last change on GitHub was on 2025-03-04. Take My Repo does not judge from that whether it is maintained.
The world's first open-source multimodal creative assistant This is a substitute for Canva and Manus that prioritizes privacy and is usable locally.
Nobody has reviewed it on Take My Repo yet, which says nothing about its quality.
An easy and fast way to create a Python GUI 🐍
Apache Superset is a Data Visualization and Data Exploration Platform
12 weeks, 26 lessons, 52 quizzes, classic Machine Learning for all
Bring data to life with SVG, Canvas and HTML. :bar_chart::chart_with_upwards_trend::tada:
A curated list of awesome machine learning frameworks, libraries and software (by language). I
A curated list of inspiring GitHub DevFolio from developers, designers, and tech enthusiasts around the world. 🌍
If you are beginner in opensource contribution, this is the best place to start, collaborate with 1000 other contributors in this repo
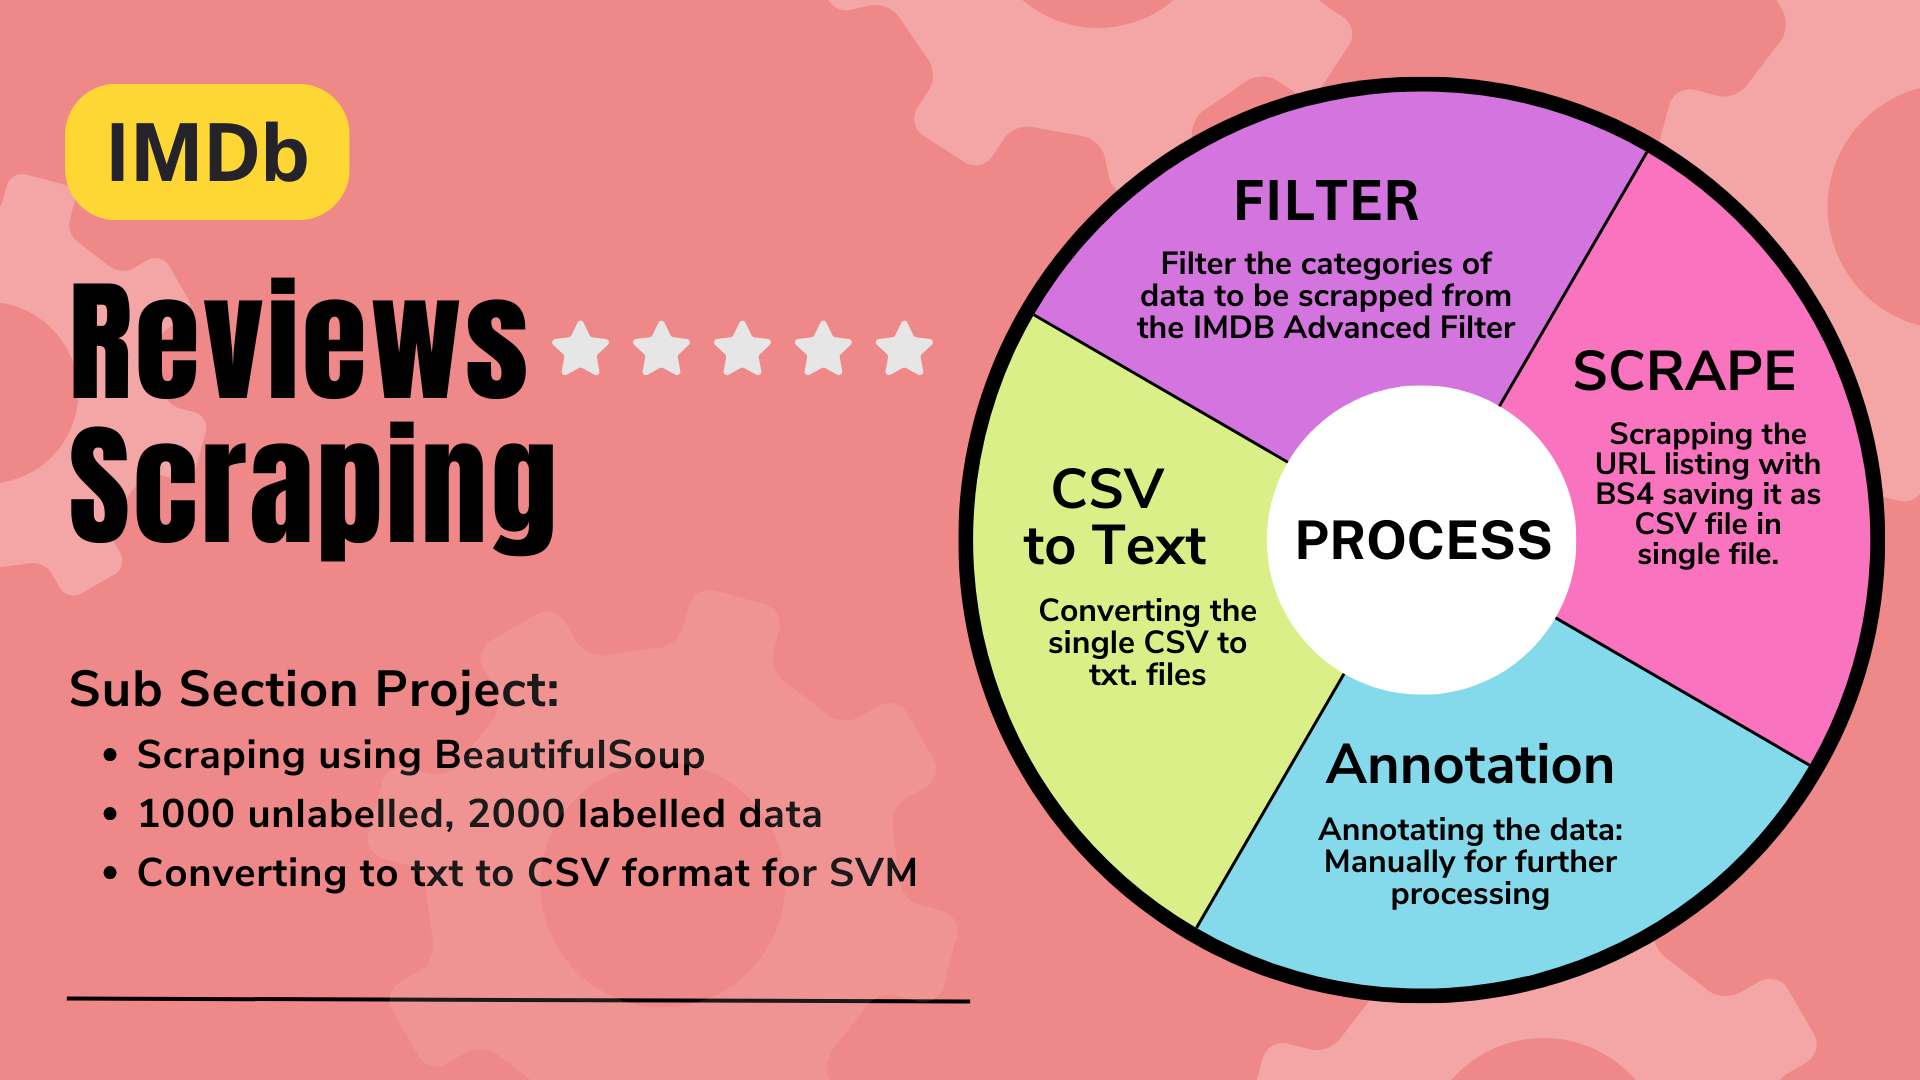
For new data generation Semi-supervised-sequence-learning-Project we have writtern a python script to fetch📊, data from the 💻, imdb website 🌐 and converted into txt files.
recodehive helps you to learn and master the skills on GitHub, and encourage you to code for opensource.