
unicode_plot.rb
Plot your data by Unicode characters
- 290
- MIT
- 5 mo ago
Repo red-data-tools/unicode_plot.rb, read from GitHub 3 h ago. red-data-tools has not joined Take My Repo.
In short
red-data-tools/unicode_plot.rb is a public repo on GitHub by red-data-tools. Plot your data by Unicode characters. It declares the MIT license on GitHub. It is written mainly in Ruby, has 290 stars and last changed on 2026-06-22. Nobody has reviewed it on Take My Repo yet, which says nothing about its quality. Read from GitHub on 2026-11-22.
UnicodePlot - Plot your data by Unicode characters
UnicodePlot provides the feature to make charts with Unicode characters.
Documentation
https://red-data-tools.github.io/unicode_plot.rb/
Install
$ gem install unicode_plot
Usage
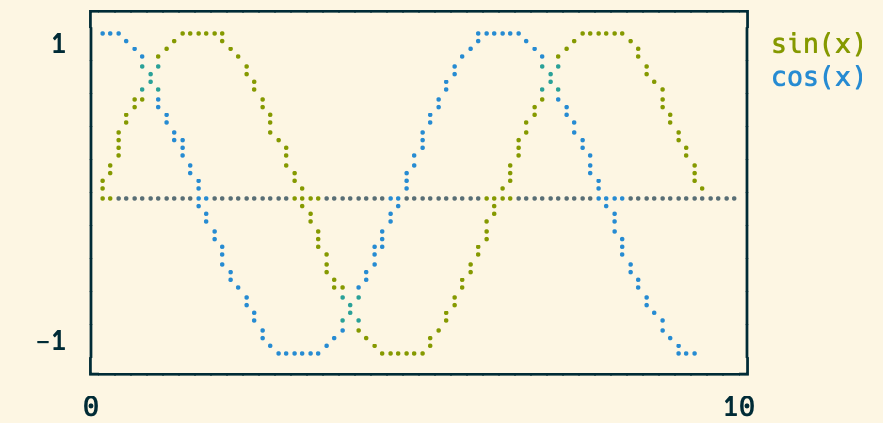
require 'unicode_plot'

x = 0.step(3*Math::PI, by: 3*Math::PI / 30)
y_sin = x.map {|xi| Math.sin(xi) }
y_cos = x.map {|xi| Math.cos(xi) }
plot = UnicodePlot.lineplot(x, y_sin, name: "sin(x)", width: 40, height: 10)
UnicodePlot.lineplot!(plot, x, y_cos, name: "cos(x)")
plot.render
You can get the results below by running the above script:
Supported charts
barplot
UnicodePlot.barplot(data: {'foo': 20, 'bar': 50}, title: "Bar").render

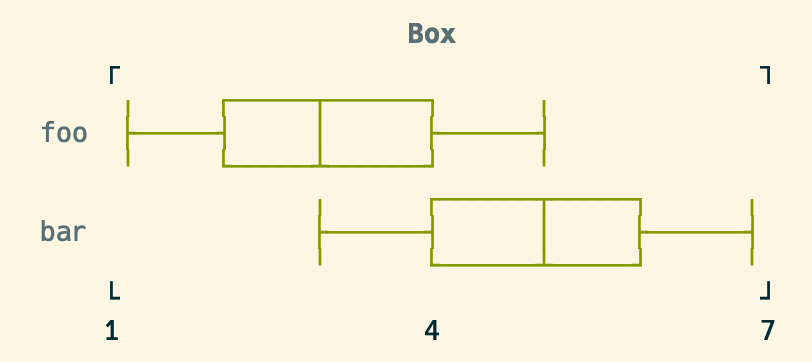
boxplot
UnicodePlot.boxplot(data: {foo: [1, 3, 5], bar: [3, 5, 7]}, title: "Box").render
densityplot
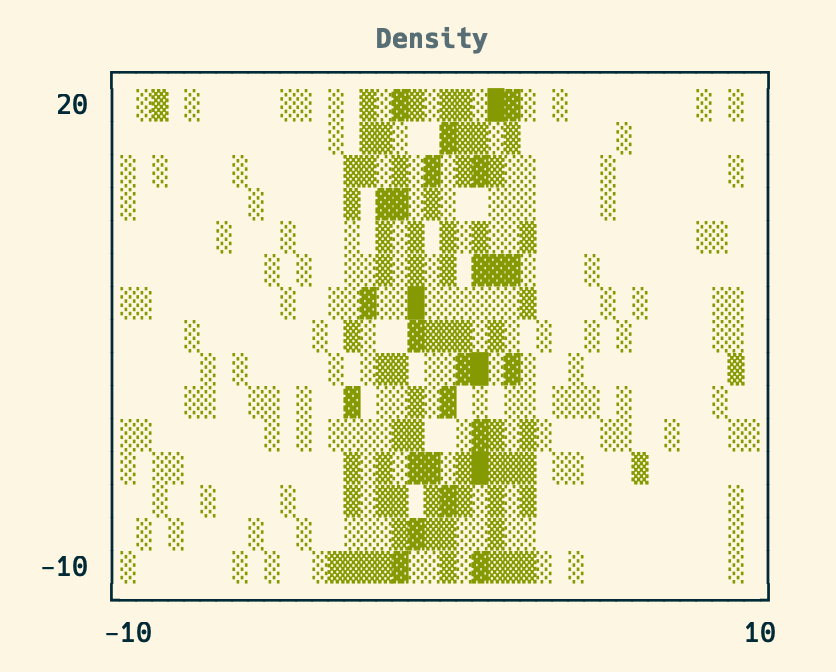
x = Array.new(500) { 20*rand - 10 } + Array.new(500) { 6*rand - 3 }
y = Array.new(1000) { 30*rand - 10 }
UnicodePlot.densityplot(x, y, title: "Density").render
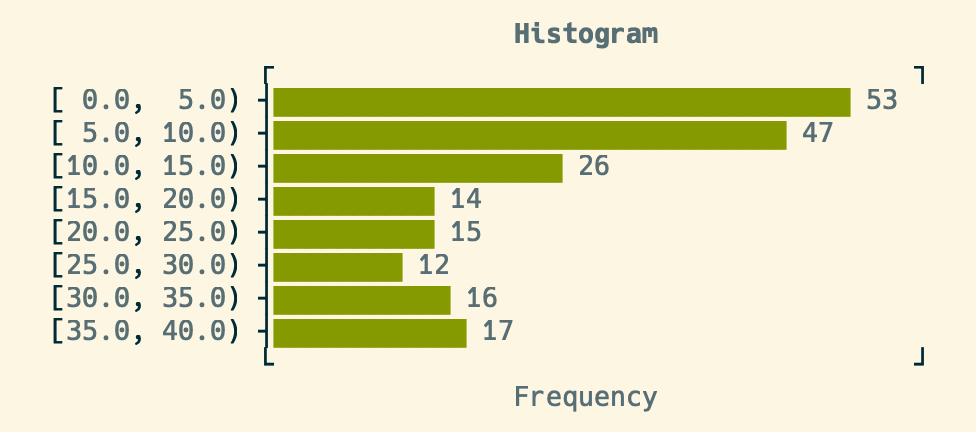
histogram
x = Array.new(100) { rand(10) } + Array.new(100) { rand(30) + 10 }
UnicodePlot.histogram(x, title: "Histogram").render
lineplot
See Usage section above.
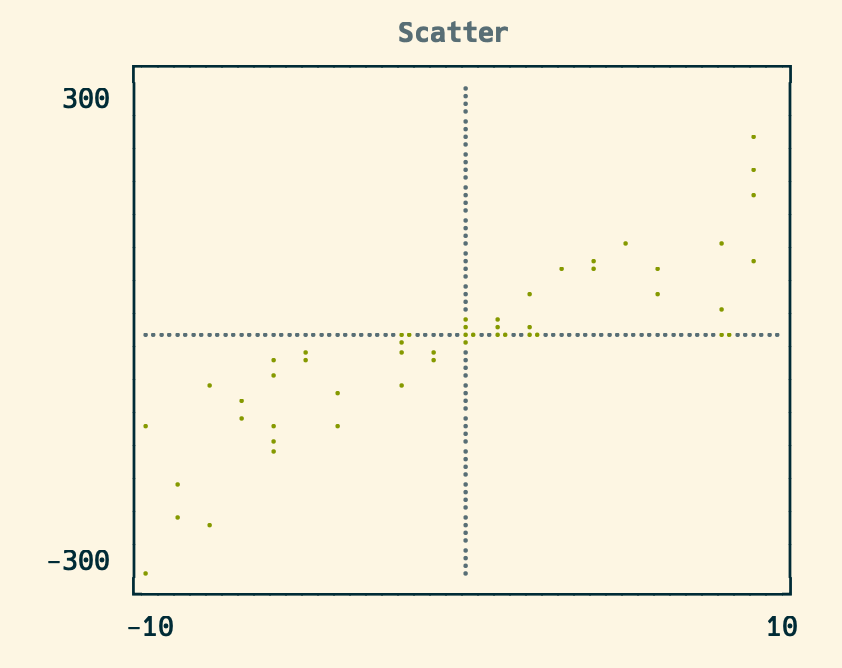
scatterplot
x = Array.new(50) { rand(20) - 10 }
y = x.map {|xx| xx*rand(30) - 10 }
UnicodePlot.scatterplot(x, y, title: "Scatter").render
Acknowledgement
This library is strongly inspired by UnicodePlot.jl.
License
MIT License
Author
Questions
What is unicode_plot.rb?
red-data-tools/unicode_plot.rb is a public repo on GitHub by red-data-tools. Plot your data by Unicode characters.
Is unicode_plot.rb open source?
It declares the MIT license on GitHub.
Does unicode_plot.rb run on macOS, Windows or Linux?
Its maker has not tagged a system, so it is unknown here. Its README says what it needs.
How do I install unicode_plot.rb?
Open "Take it" on its page: Take My Repo writes an install plan for your machine and hands it to your AI agent (Claude Code, Codex or Cursor), which asks you before each step. Take My Repo has not tested it on any machine.
Is unicode_plot.rb still maintained?
Its last change on GitHub was on 2026-06-22. Take My Repo does not judge from that whether it is maintained.
What do people who ran unicode_plot.rb say?
Nobody has reviewed it on Take My Repo yet, which says nothing about its quality.