| Classic bar |
Batteries, levels, anything 0–100 |
1.0 |
| Thin bar |
Storage, compact lists |
1.0 |
| Segmented bar |
Signal strength, fill levels |
1.0 |
| Vertical / tank |
Tanks, bins, water butts |
1.0 |
| Ring |
CPU, memory, disk |
1.0 |
| Half circle with needle |
Power, speed |
1.0 |
| Three-quarter arc |
Temperature, humidity, CO₂ |
1.0 |
| Line chart |
How a sensor changed over hours, days or months |
1.2 |
| Area chart |
Solar, power use, import and export either side of zero |
1.3 |
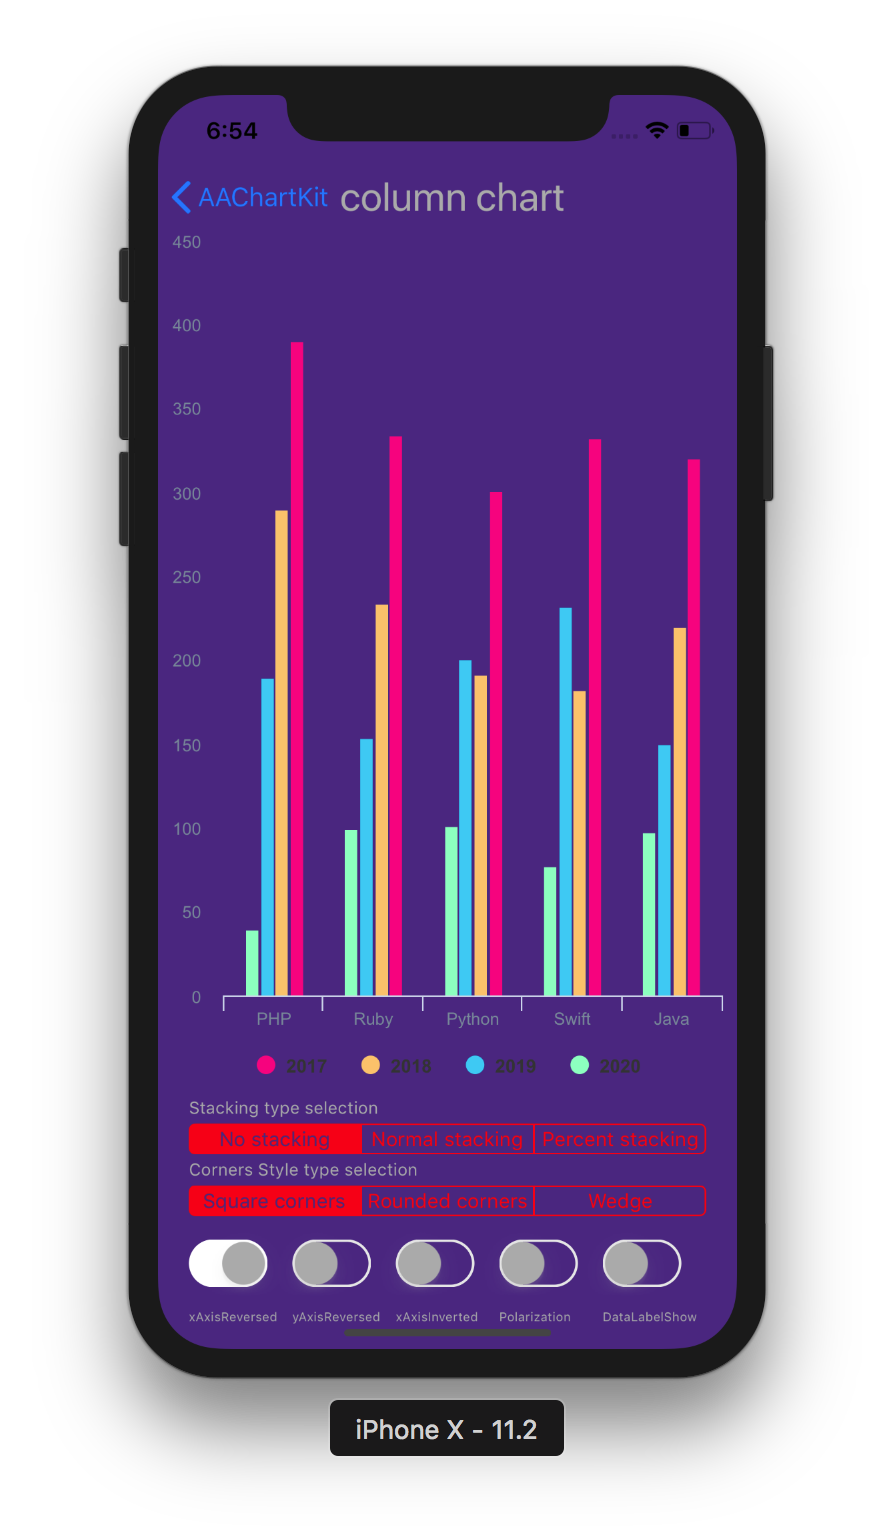
| Column chart |
Energy per day, rain per hour |
1.3 |
| Combined chart |
Columns, lines and areas on one time axis, with a second axis |
1.3 |
| Pie and donut |
How a total splits into parts, such as where today's energy came from |
2.0 |
| Rings |
Several batteries or goals in one dial |
2.0 |
| Pictograph |
Counting: chores done, glasses of water, people at home |
2.0 |
| Waffle |
One share out of 100, or a split of one total |
2.0 |
| Histogram |
How long a room spent in each temperature range |
2.0 |
| Scatter |
One sensor against another, such as heating against outside temperature |
2.0 |
| Bubble |
A scatter sized by a third sensor: temperature, humidity and CO₂ |
2.0 |
| Heatmap |
Power by hour and weekday, or a year of days as a calendar |
2.0 |
| Box plot |
How readings spread, per entity or per day, week or month |
2.0 |
| Funnel |
Solar produced, used in the house, exported |
2.0 |
| Waterfall |
How a total is built up or worn down, step by step |
2.0 |
| Treemap |
Power use by floor and room |
2.0 |
| Sunburst and icicle |
A hierarchy as rings or bars, tap to drill in |
2.0 |
| Radar |
Comparing profiles of several values |
2.0 |
| Polar area |
Values as slice lengths around a circle |
2.0 |
| Grouped and stacked bars |
Several values side by side, stacked or as 100 % |
2.0 |
| Bullet and lollipop |
A value against its target; many values with little ink |
2.0 |
| Slope and dumbbell |
Each entity then and now, or its lowest and highest |
2.0 |
| Range area |
Each period's lowest to highest, shaded |
2.0 |
| Sparklines |
A tiny trend beside each entity's name and value |
2.0 |
| Streamgraph |
How several entities share a total over time |
2.0 |
| Candlestick |
Open, high, low and close per period |
2.0 |
| Violin, raincloud and beeswarm |
How readings are spread, or every reading as a dot |
2.0 |
| State timeline |
When each entity was on, off, home or heating |
2.0 |
| Climate |
A thermostat's temperature against its set point |
2.0 |
| Sankey |
How power flows between sources and loads |
2.0 |
| Wind rose |
Where the wind comes from, and how hard |
2.0 |
| 24-hour clock |
When each entity was on, around the clock |
2.0 |
| Trend card |
A compact tile: the value over its recent history |
2.0 |
| Line chart extras |
Zoom and pan, annotations, value labels, synced charts, small multiples, highest/lowest/average marks, log scale |
2.0 |
| Marimekko |
A total split two ways, such as energy by room and by use |
2.2 |
| Chord |
Flows both ways between a few places, round a circle |
2.2 |
| Battery grid |
Every battery in the house, emptiest first |
2.2 |
| Spiral |
A daily or weekly routine, one turn per day or week |
2.2 |
| Strip plot |
Every reading as a dot, with a line at the median |
2.2 |
| Cycle plot |
The average day for each weekday, side by side |
2.2 |
| Chart extras |
Forecasts, anomalies, earlier spans and a now line on the line chart; error bars on columns; a recent range behind the gauges; running totals, rates, unit conversion, conditional series, hiding series, an export menu and the Energy dashboard as a source |
2.2 |
| Duration curve |
How long a sensor spent above each value, such as solar output |
2.4 |
| Time in each state |
How many hours a day each entity spent heating, on or away |
2.4 |
| More chart extras |
A goal to pace against, the usual range for the time of day and calendar events on the line chart; a fit line, slope and R² on the scatter chart; what energy cost, with tariffs; series worked out from a formula, rolling averages, text states as numbers; a table view, summaries for screen readers, reading values from the keyboard and opening History at a point |
2.4 |