pyCirclize
Circular visualization in Python (Circos Plot, Chord Diagram, Radar Chart)
- 1.1k
- Python
- MIT
- 5 mo ago
Circular visualization in Python (Circos Plot, Chord Diagram, Radar Chart)
Python library to facilitate genome assembly, annotation, and comparative genomics
A tool for drawing ANI clustermap between all-vs-all microbial genomes
A tool for classifying prokaryote protein sequences into COG(Cluster of Orthologous Genes) functional category
Guided synteny alignment between duplicated genomes (within specified quota constraint)
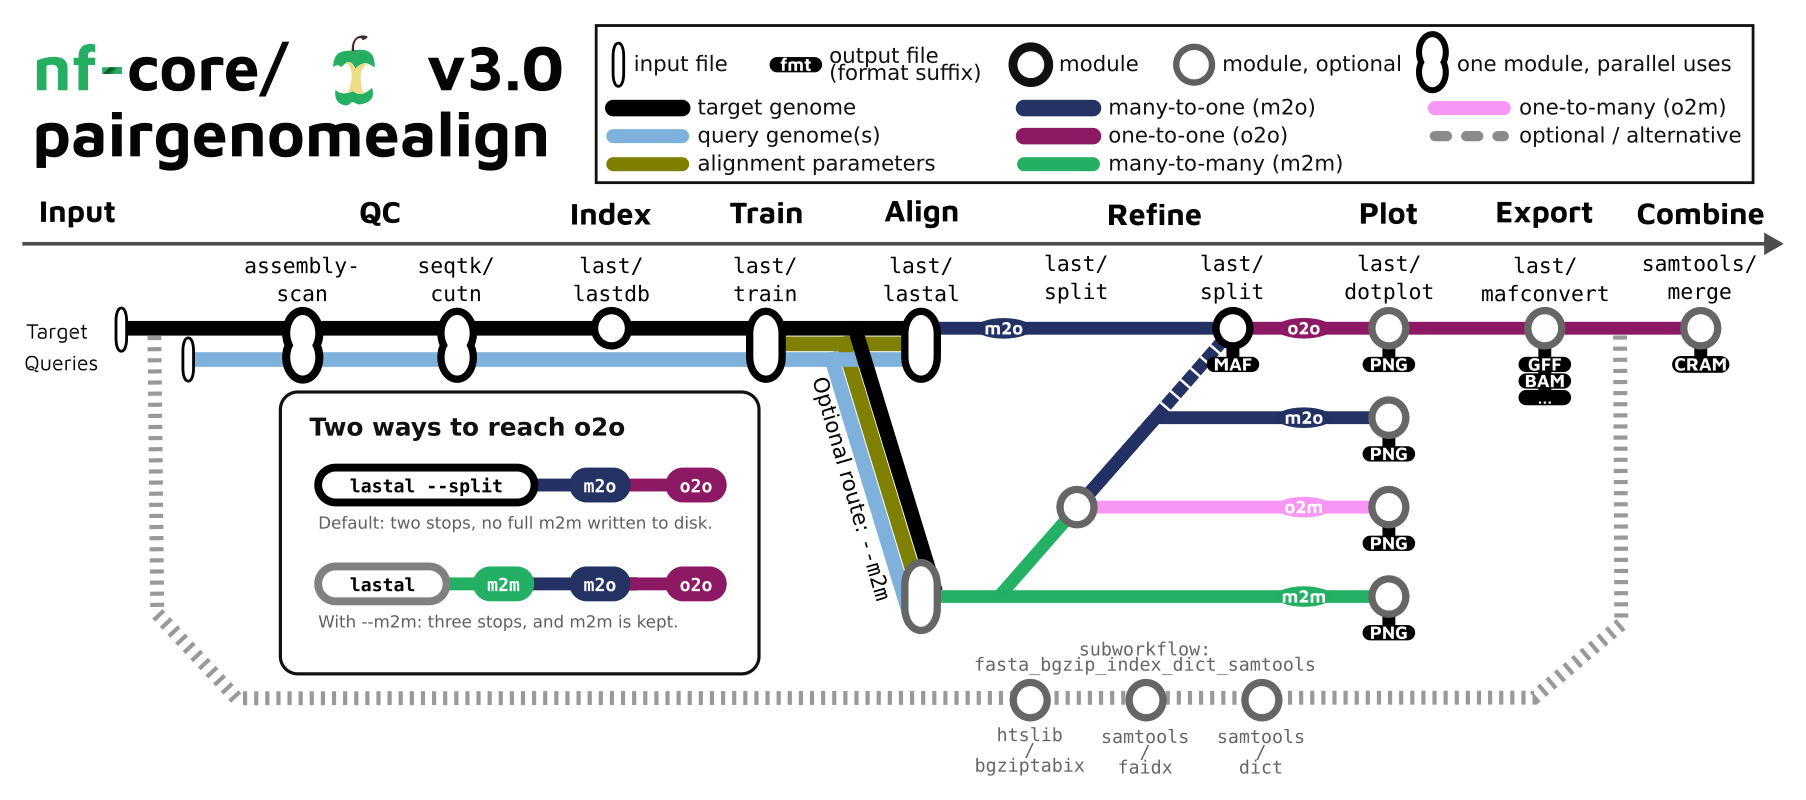
Pairwise genome comparison pipeline using the LAST software to align a list of query genomes to a target genome, and plot the results
Comparative molecular life history of spontaneous canine and human gliomas. Amin et al. Cancer Cell 2020