d3graphTheory
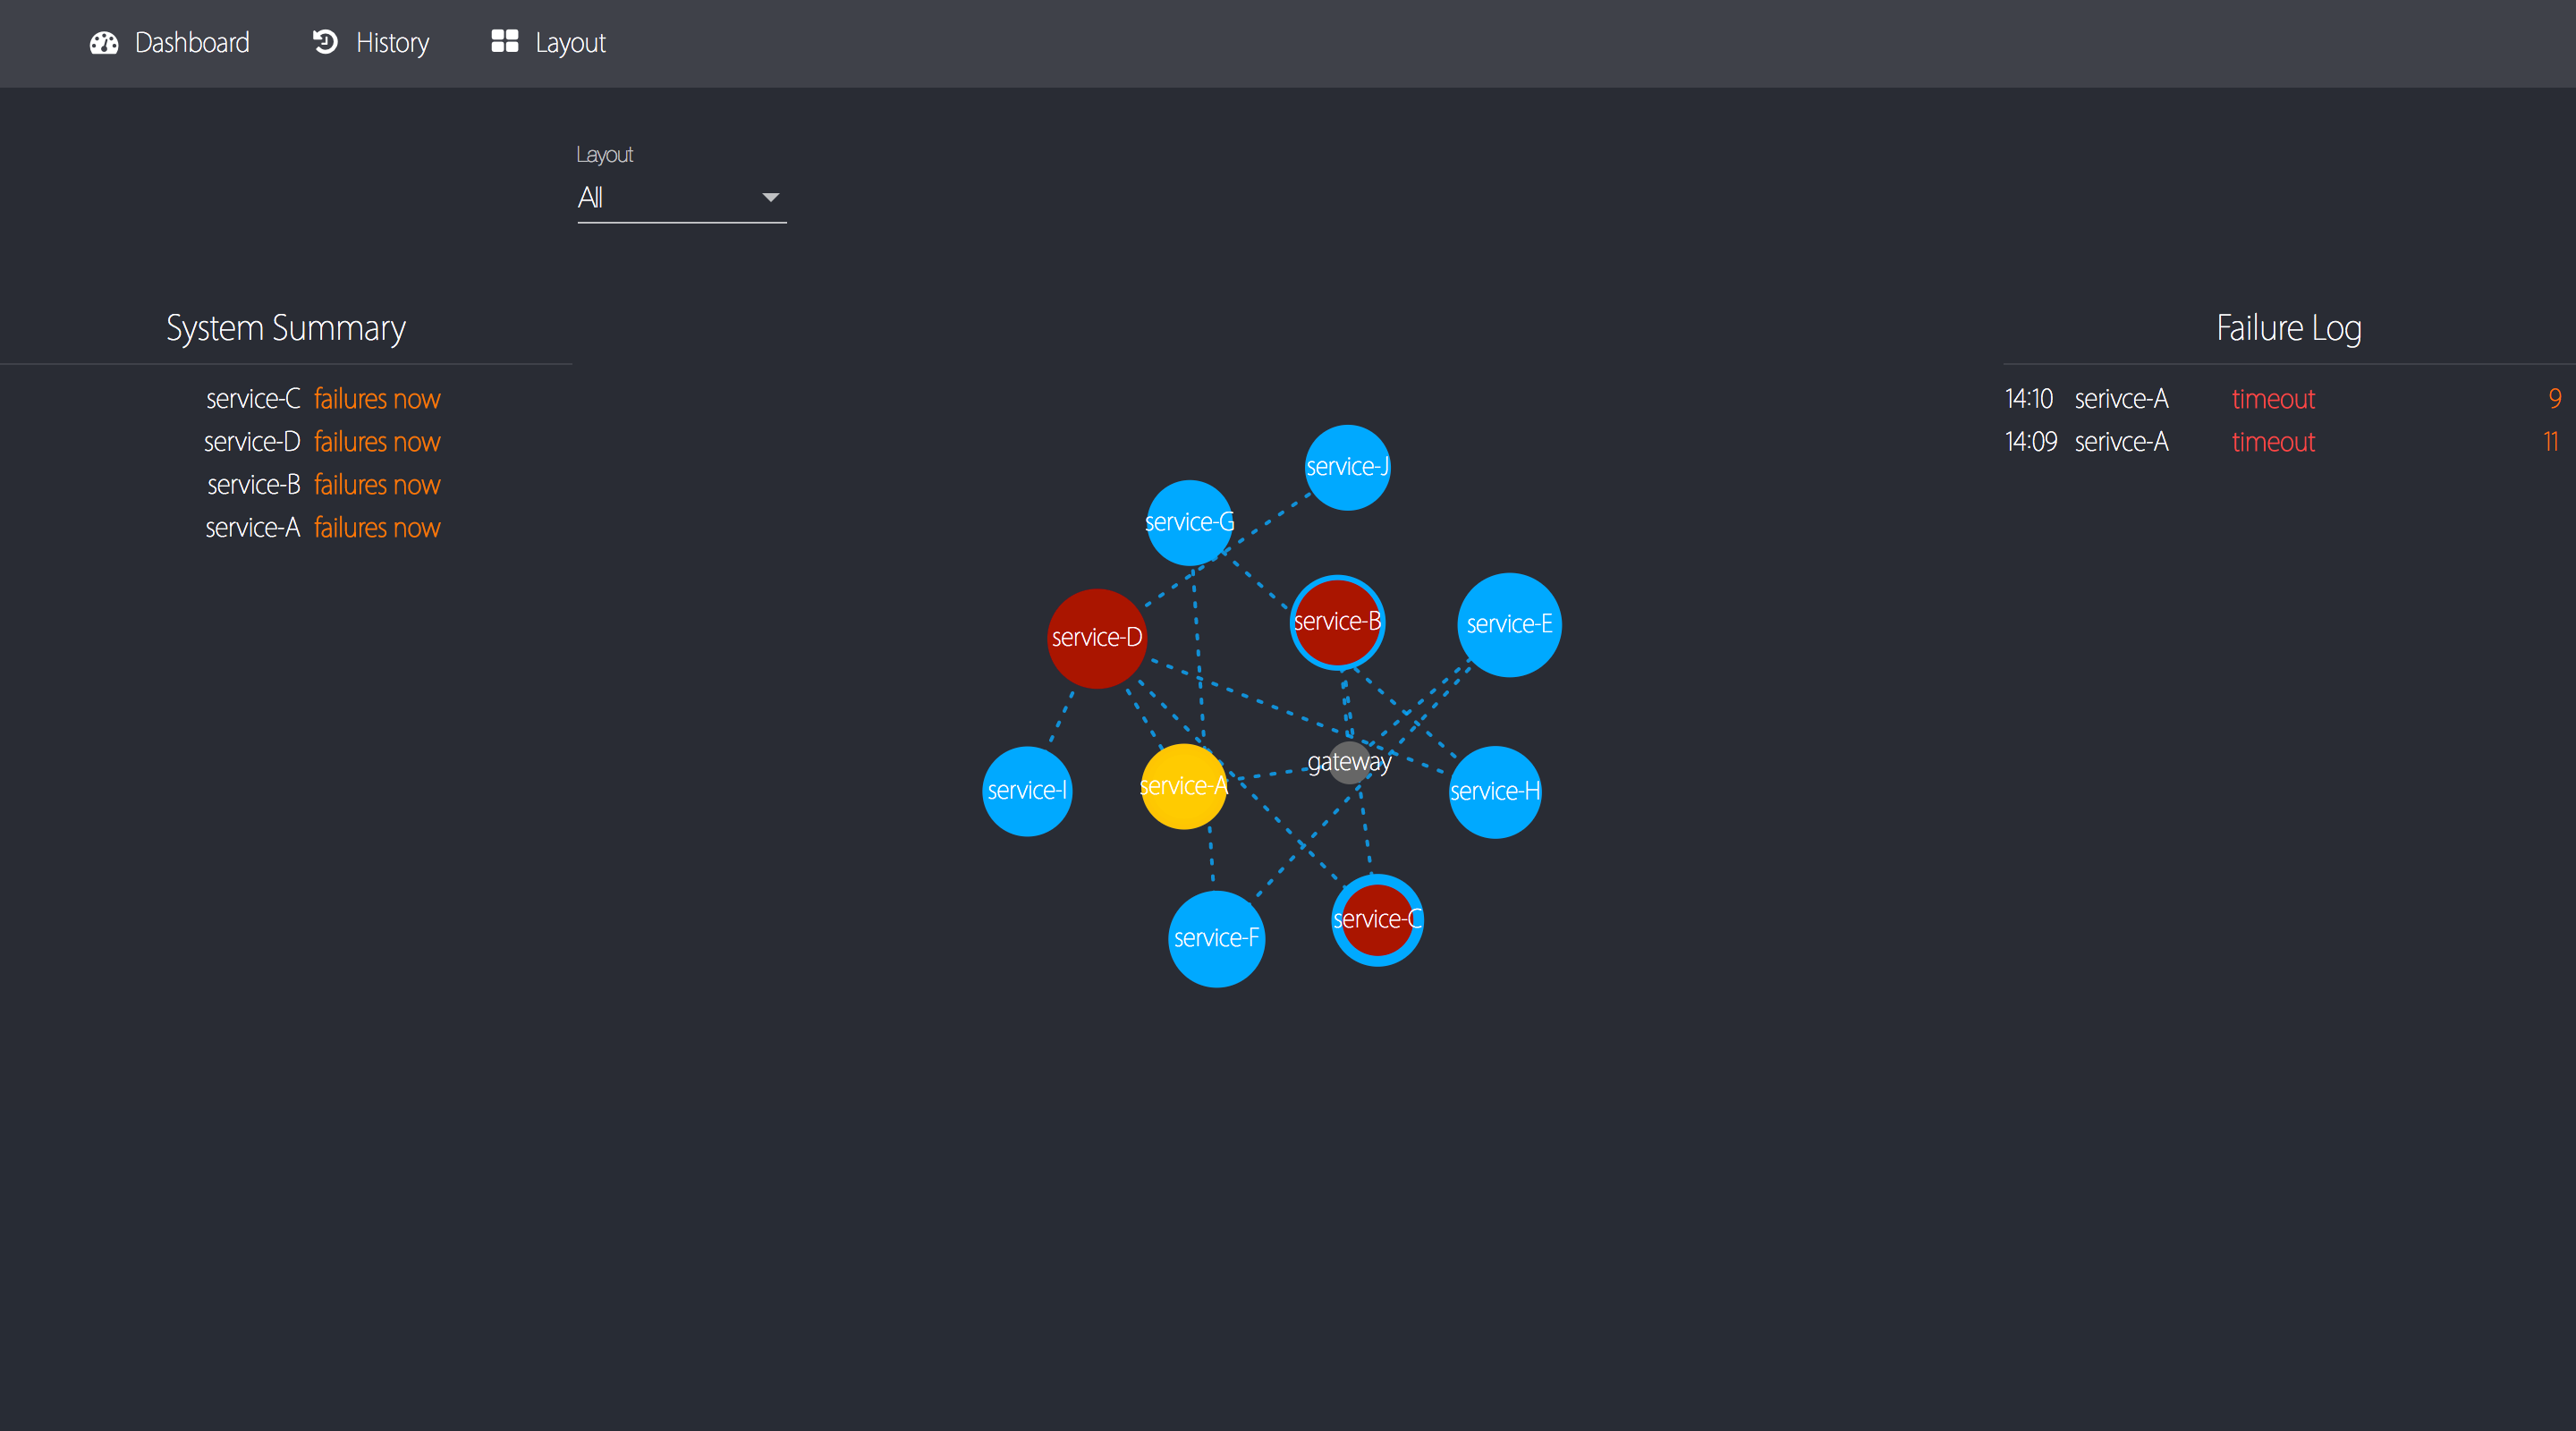
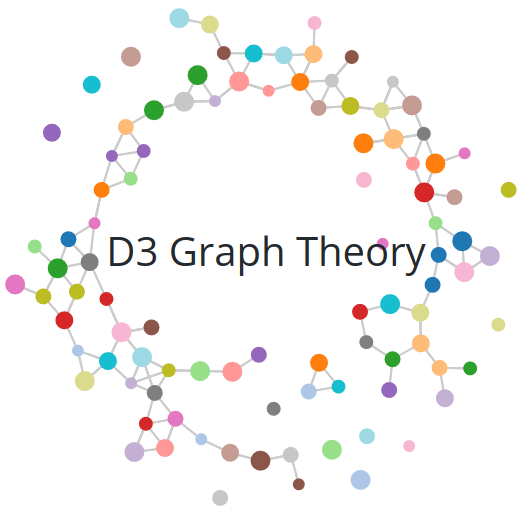
:boom: Interactive and colorful :art: graph theory tutorials made using d3.js :zap:
- 1.9k
- JavaScript
- MIT
- 3 mo ago
:boom: Interactive and colorful :art: graph theory tutorials made using d3.js :zap:
:deciduous_tree: React component to create interactive D3 tree graphs
Interactive and configurable graphs with react and d3 effortlessly
📖An interactive companion to the well-received textbook 'Introduction to Econometrics' by Stock & Watson (2015)
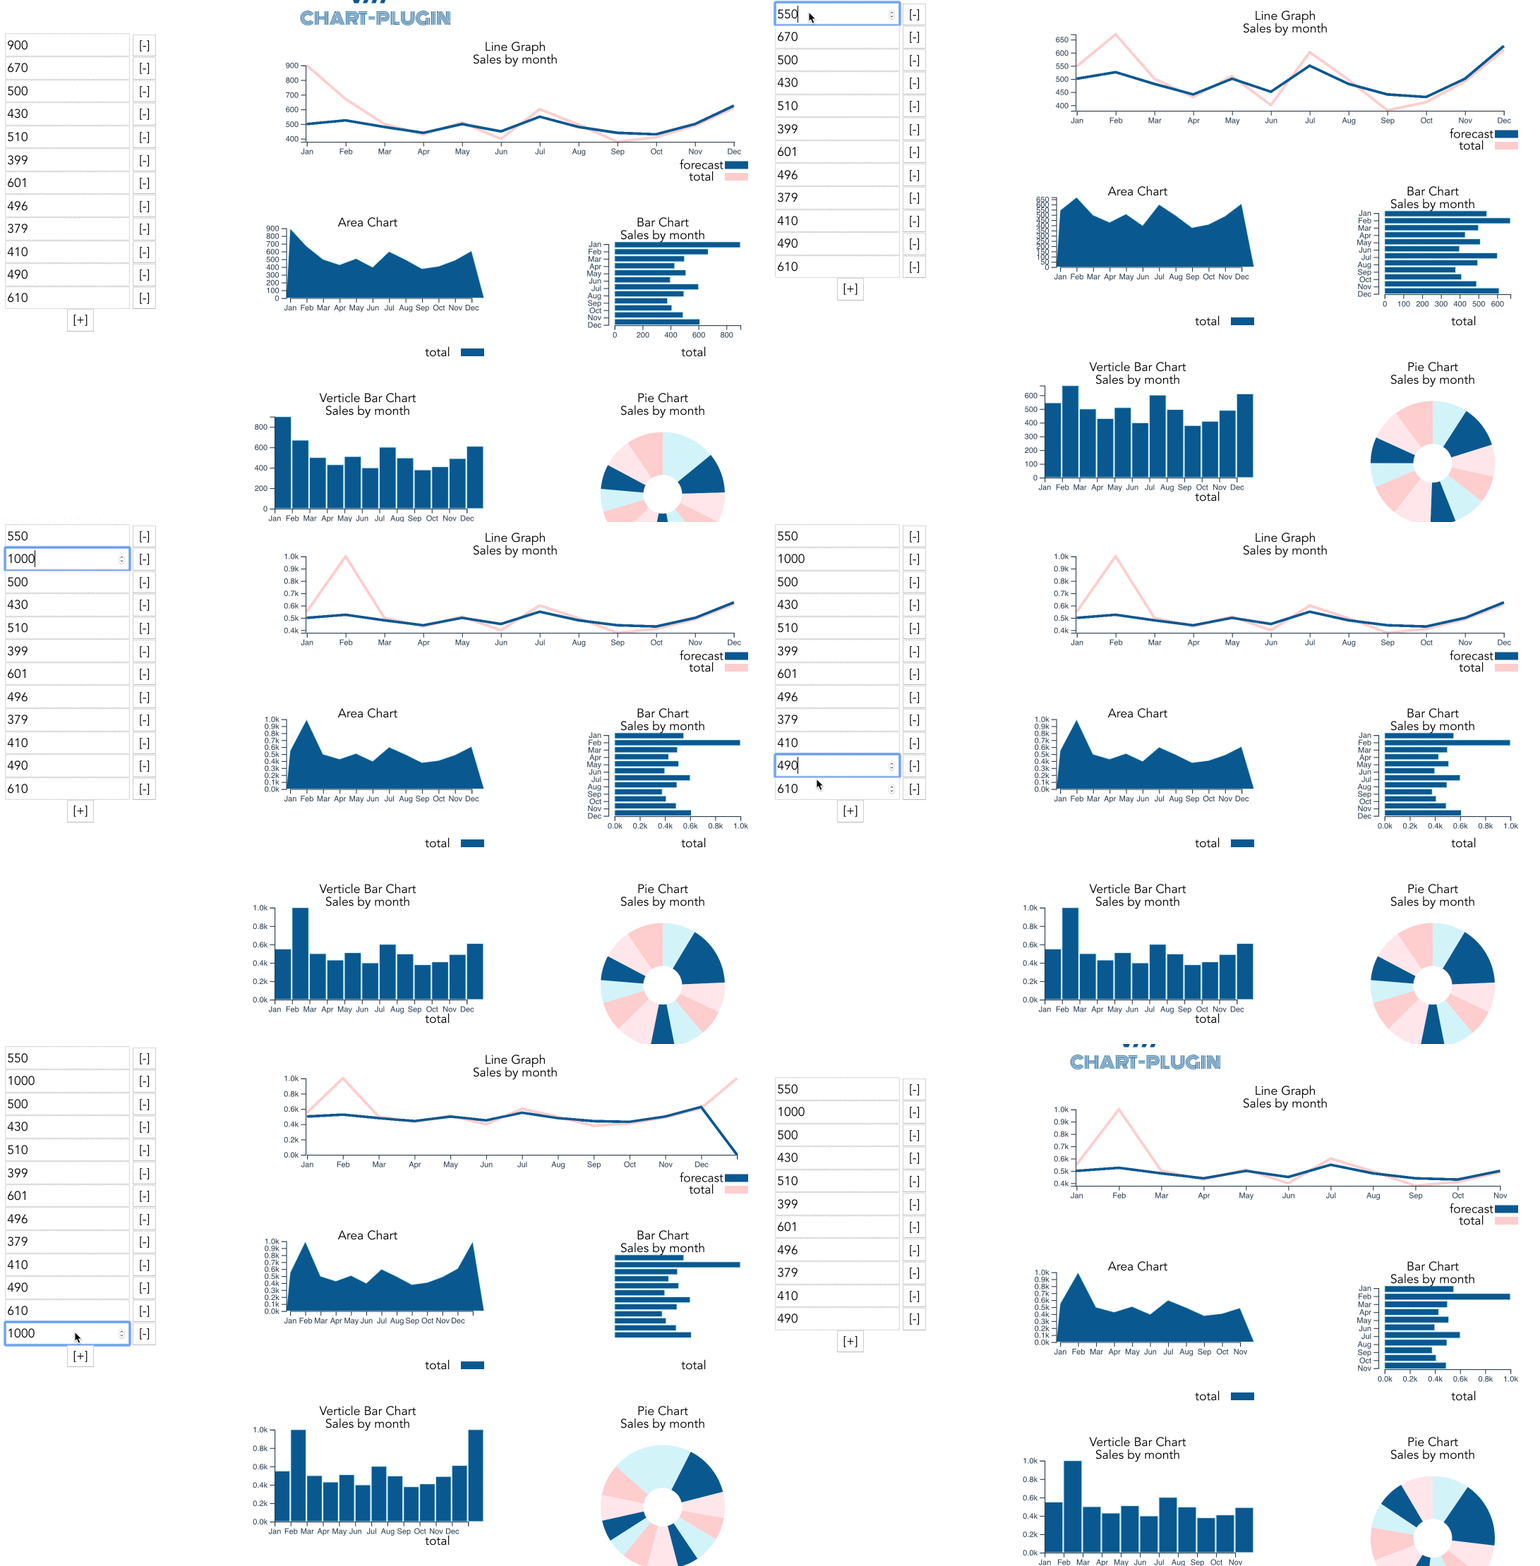
Easily bind a chart to the data stored in your Vue.js components.
A web-based knowledge management system for visualizing game related technologies.
See who's behind your GitHub stars: an interactive network graph of your repos, followers, stargazers, and forks, right in your browser.
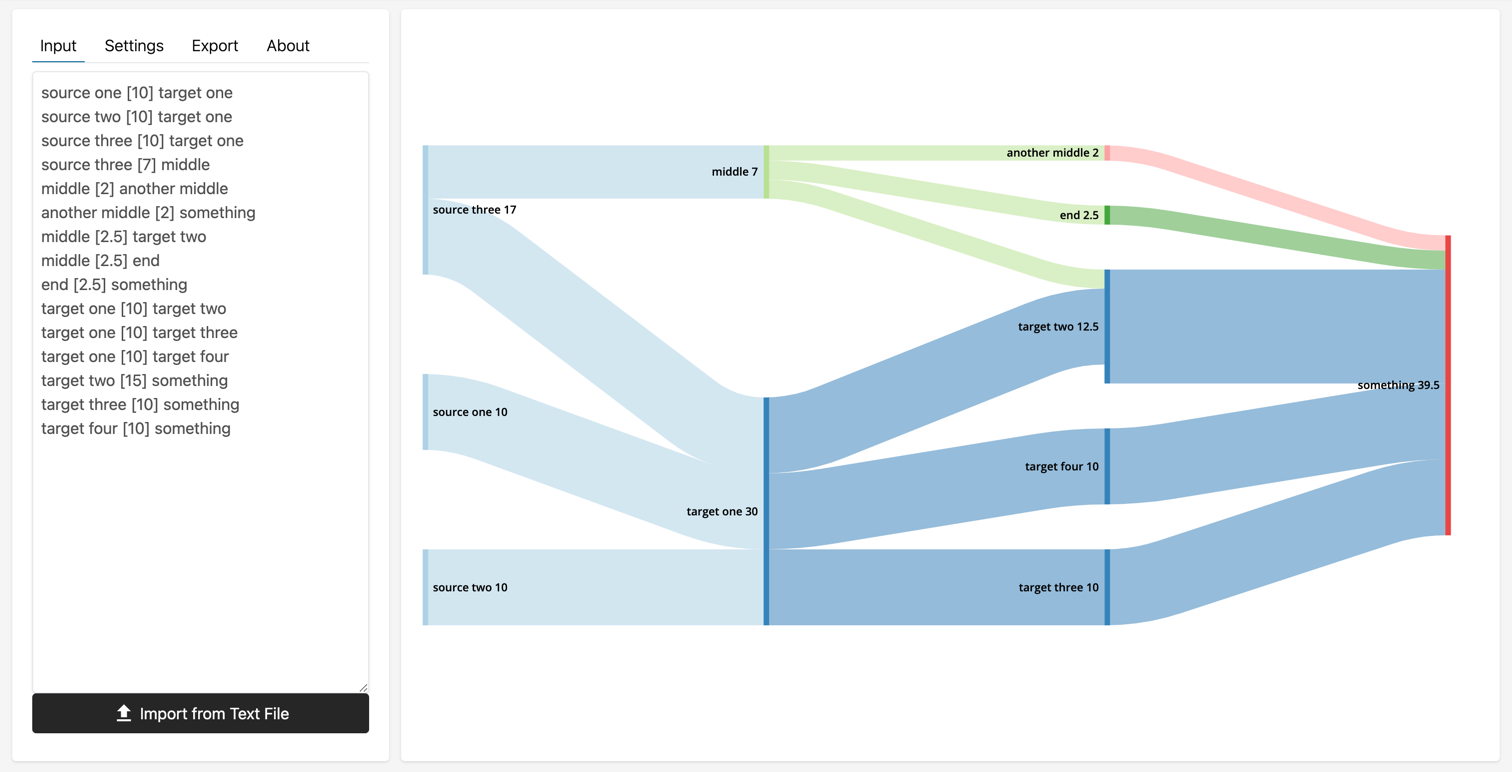
sankeydiagram.net is an easy-to-use webapp for generating Sankey Diagrams to visualize flows and budgets.
Algorithm to layout trees of variable-sized nodes, while keeping linear runtime
A modern JavaScript image stippling generator that turns uploaded images into stipple art using weighted Lloyd relaxation. Includes Voronoi and Delaunay visualization modes, runs in a Web Worker for speed, and supports PNG export. Built with Vite + d3-delaunay
34 个核心 Demo + 3 个附录,覆盖前端工程化全链路:pnpm/Vite/ESLint/Husky、分包懒加载、CI/CD、Vitest/Playwright、性能监控、请求池/重试、Service Worker、AI 辅助 PR Review、知识图谱可视化、VS Code 插件与 Agent 自动修复。Vue 3 + TS + Vite + pnpm 实战。等核心工程化能力。每个 Demo 都可运行、可验证、有踩坑记录。适合有一定前端基础的工程师步步为营的进阶学习与团队基建参考。
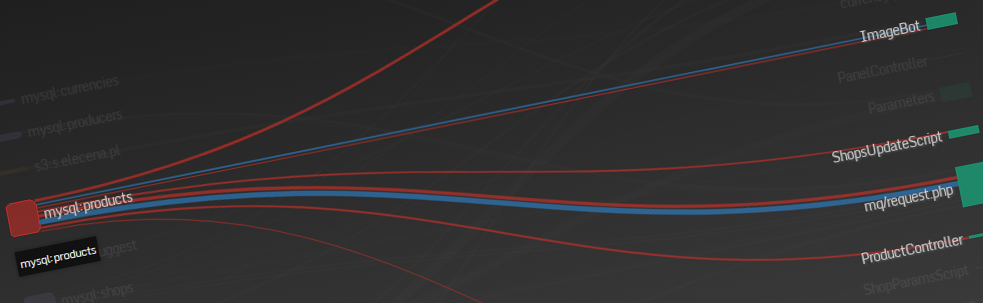
Uses your app logs to visualize how the data moves between the code, database, HTTP services, message queue, external storages etc.
Explores the relationships between countries' GDP, population, and cumulative Olympic medals. Features a narrative visualization of changes over time, critically examining the modern Olympic Games' original vision.