The-Data-Visualization-Workshop
A New, Interactive Approach to Learning Data Visualization
- 88
- Jupyter Notebook
- MIT
- 9 mo ago
A New, Interactive Approach to Learning Data Visualization
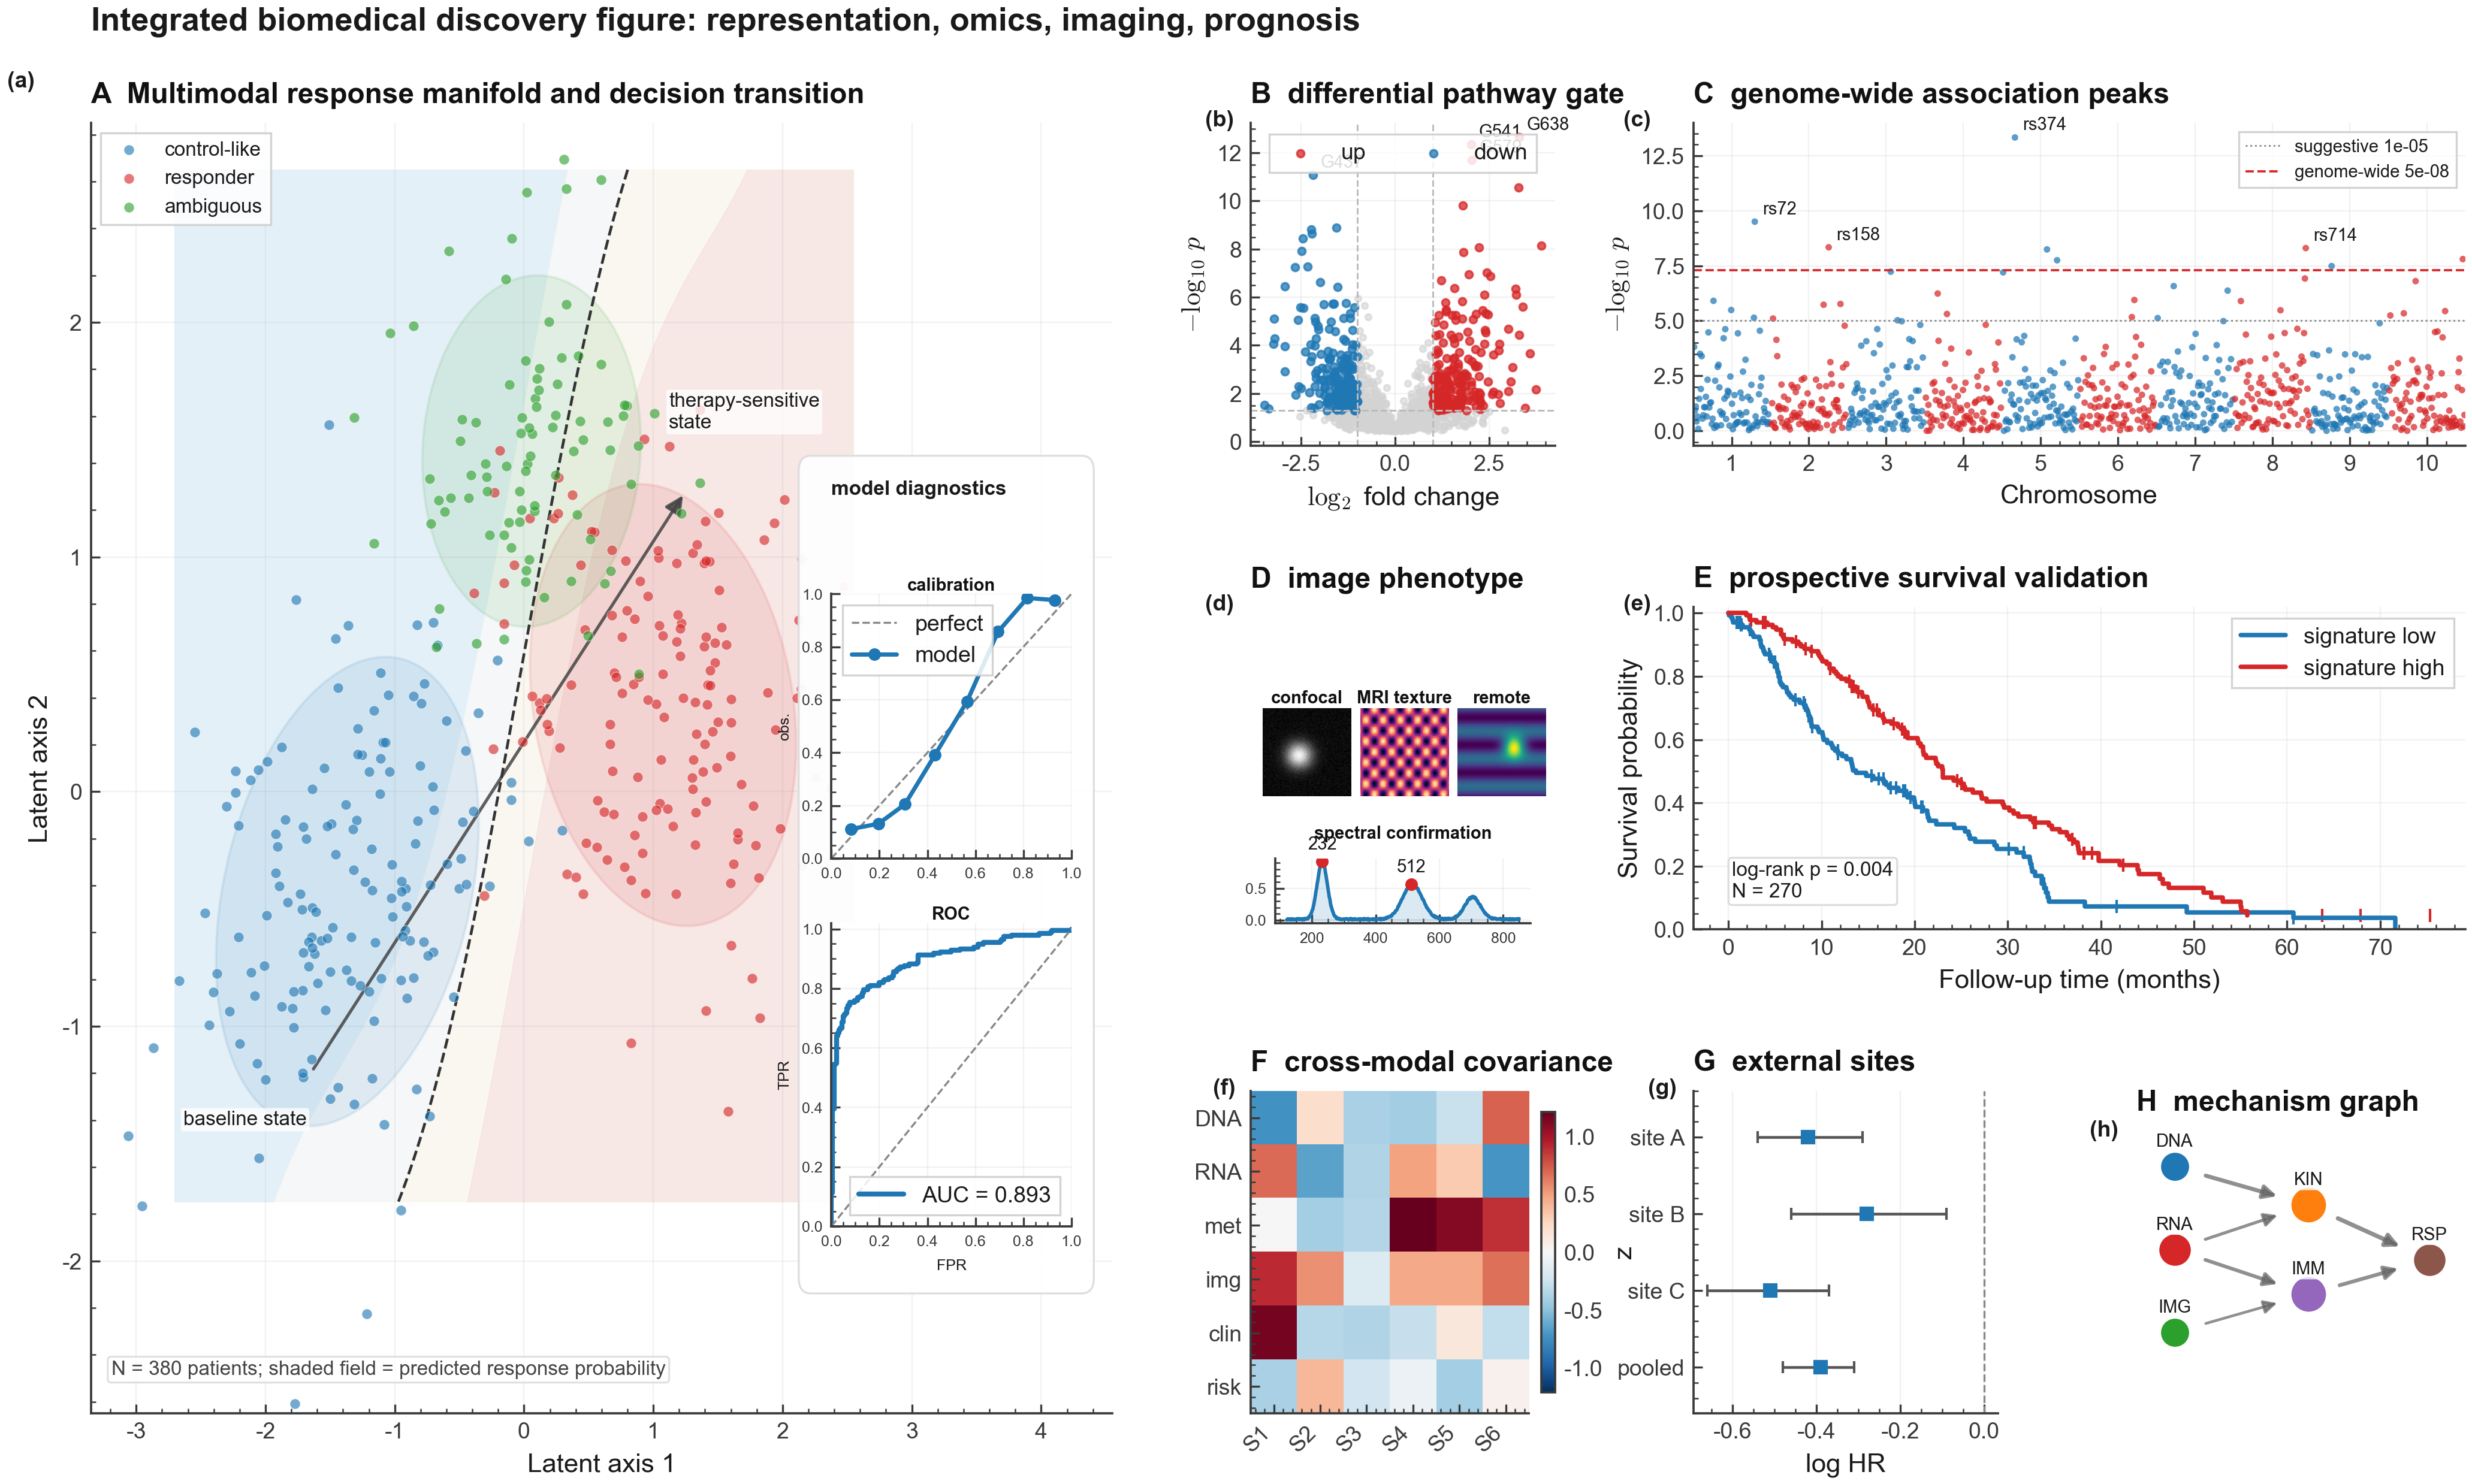
Publication-grade figures for scientific papers — reproducible matplotlib & TikZ, with a quality bar, composition paradigms, and journal-grade craft. A self-contained Claude skill.
Editable, version-controlled figures for Quarto: 18 agent-authorable formats (Excalidraw, Vega-Lite, Graphviz, PlantUML, ...) rendered at build time with caching and native figure semantics
SharePlots is a collaborative space dedicated to sharing high-quality plots and figures for academic and research papers. We believe that visually appealing and informative figures play a crucial role in conveying research findings effectively.