grafana
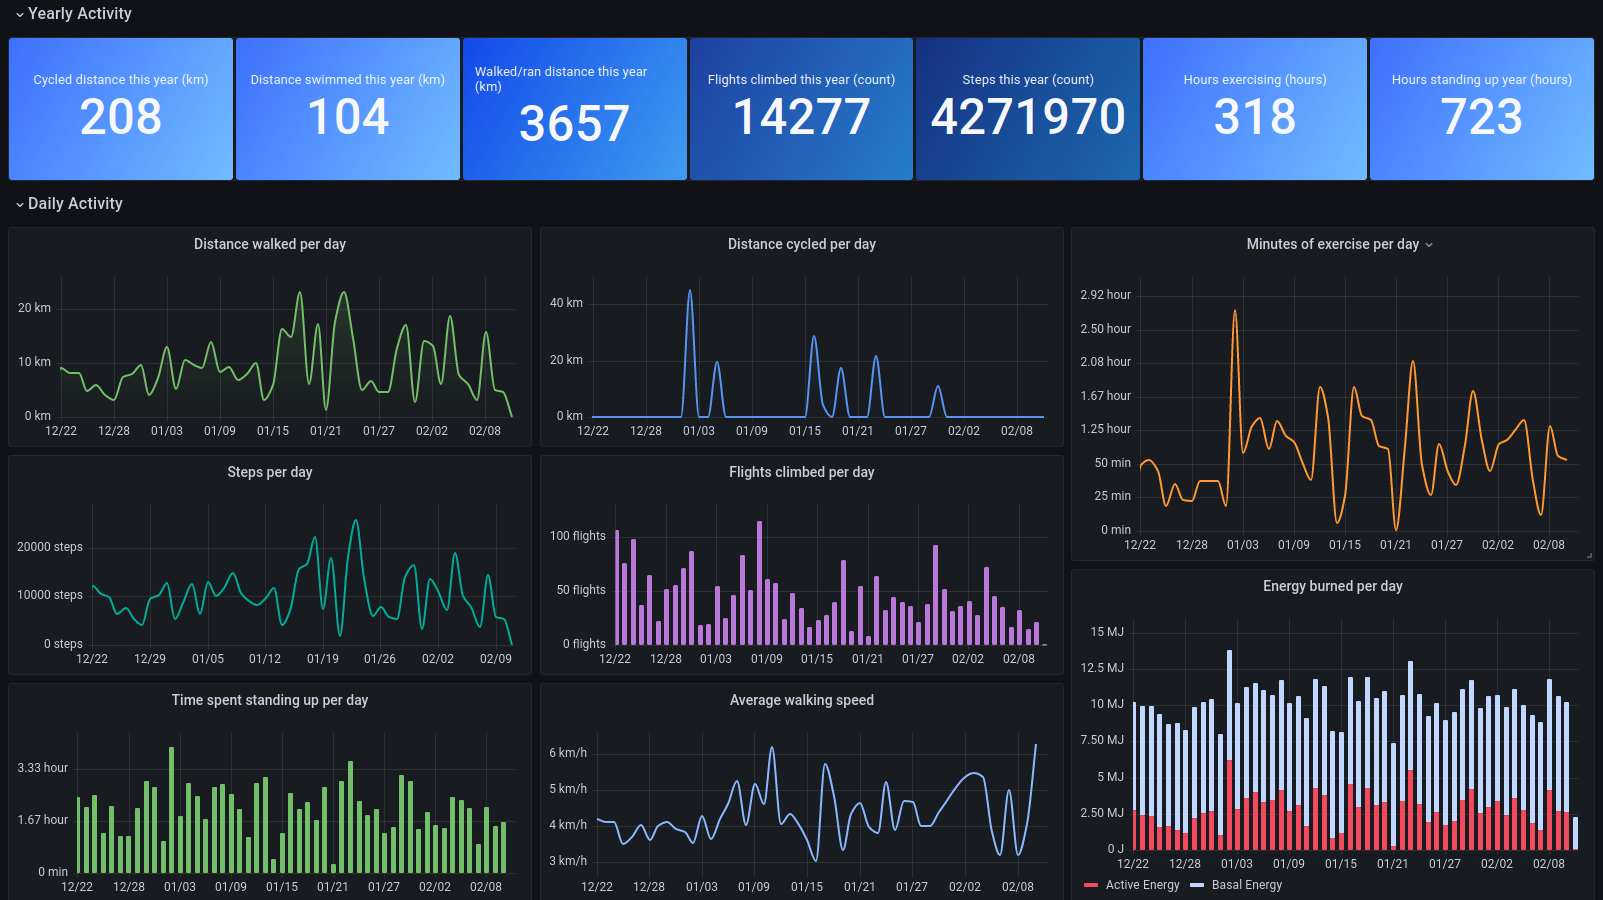
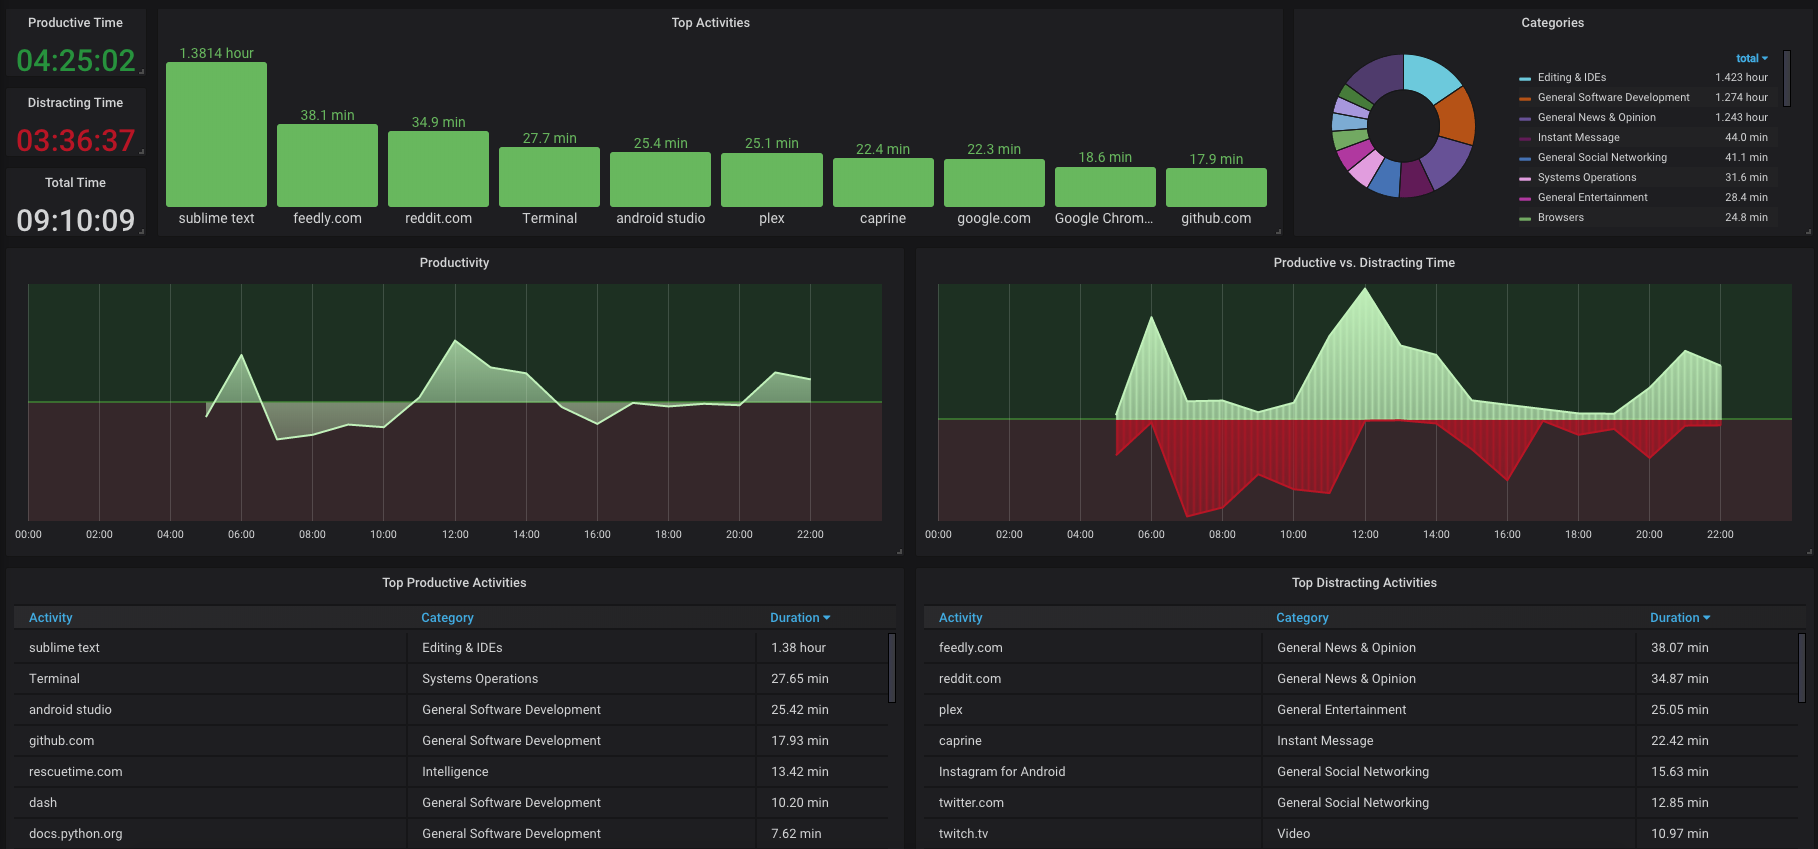
The open and composable observability and data visualization platform. Visualize metrics, logs, and traces from multiple sources like Prometheus, Loki, Elasticsearch, InfluxDB, Postgres and many more.
- 78k
- TypeScript
- AGPL-3.0
- 21 min ago
The open and composable observability and data visualization platform. Visualize metrics, logs, and traces from multiple sources like Prometheus, Loki, Elasticsearch, InfluxDB, Postgres and many more.
🏆 Real-Time no-code, powerful and secure ORM 🚀 providing APIs and Docs without coding by Backend, and Frontend(Client) can customize response JSONs 🏆 实时 零代码、全功能、强安全 ORM 库 🚀 后端接口和文档零代码,前端(客户端) 定制返回 JSON 的数据和结构
VictoriaMetrics: fast, cost-effective monitoring solution and time series database
Agent for collecting, processing, aggregating, and writing metrics, logs, and other arbitrary data.
The core of our monitoring platform with a powerful configuration language and REST API.
Actively maintained successor to Alibaba DataX — a fast, versatile, open-source ETL tool for 30+ RDBMS and NoSQL data sources.
Time Series Benchmark Suite, a tool for comparing and evaluating databases for time series data
Spring Boot & Spring Cloud & Spring Security Demo Case(Spring学习示例实战项目)
Secure, production-grade IoT hydroponic automation system with ESP32, MQTT telemetry, and real-time dashboard
Fully-featured metrics collection agent for Minecraft servers. Supports Prometheus and InfluxDB. Dashboard included out-of-box.
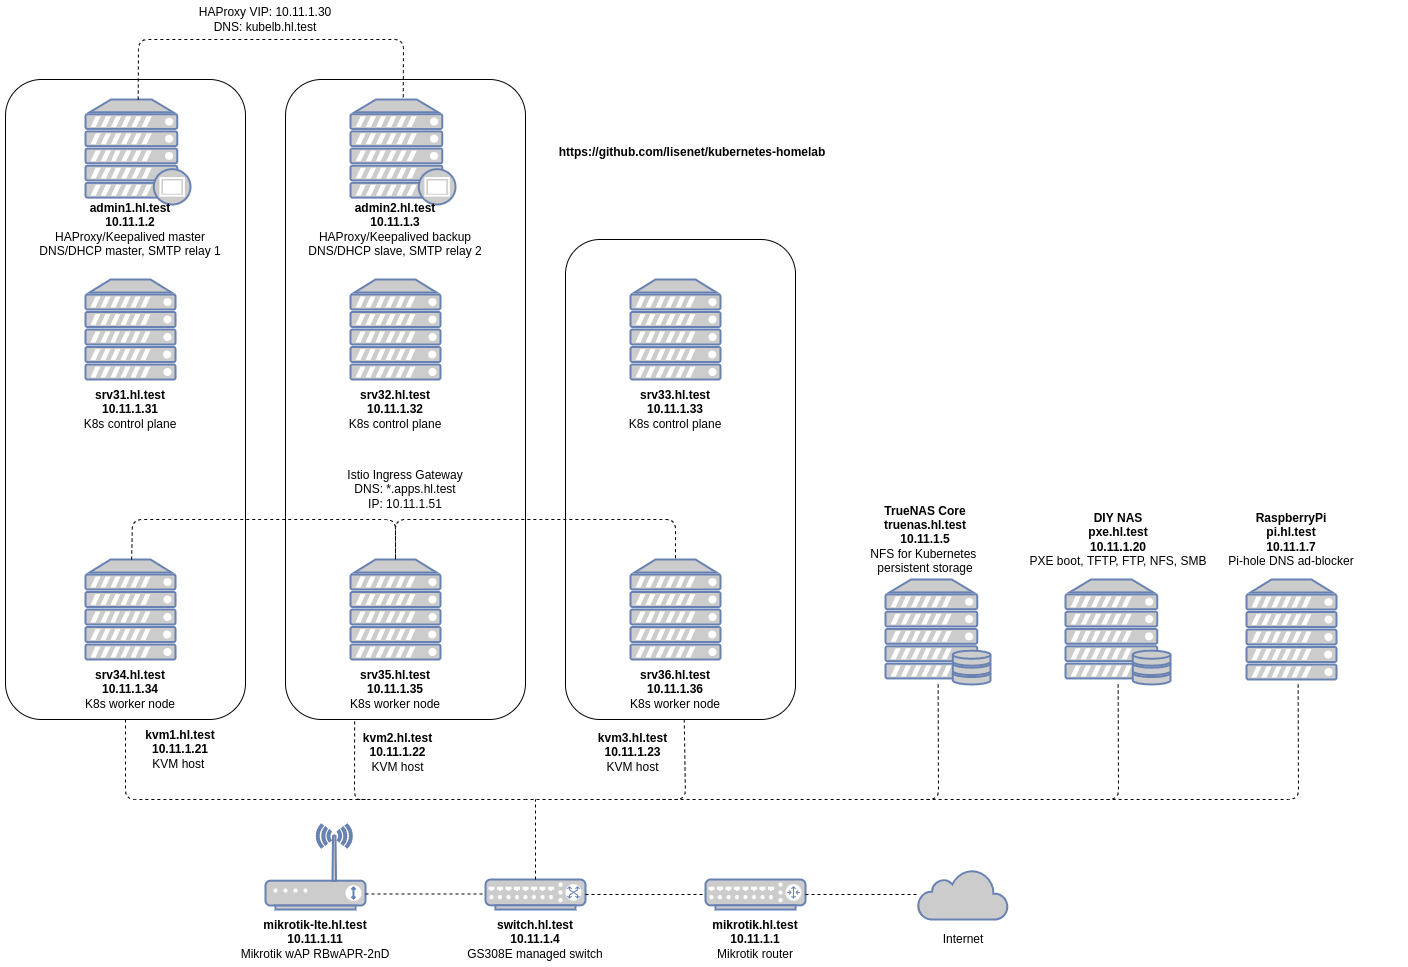
Building a Kubernetes homelab using kubeadm, Ansible, Helm and Terraform.
Powerful and flexible library for logging on files, console, memory, email, rest, eventlog, syslog, slack, telegram, redis, logstash, elasticsearch, influxdb, graylog, Sentry, Twilio, ide debug messages and throw events for Delphi/Firemonkey/freepascal/.NET (Windows/Linux/OSX/IOS/Android).
Framework allows to perform load testing with Apache Jmeter, view application/server metrics in real-time with Grafana, analyze errors cause with detailed traces for failed requests, compare different test runs in scripted dashboard and perform frontend performance testing with sitespeed.io+webpagetest
Flask based api / dashboard for viewing a ceph clusters overall health status
Hastic data management server for analyzing patterns and anomalies from Grafana
Firehose is an extensible, no-code, and cloud-native service to load real-time streaming data from Kafka to data stores, data lakes, and analytical storage systems.
A server that accepts InfluxDB metrics via the HTTP API and exports them via HTTP for Prometheus consumption
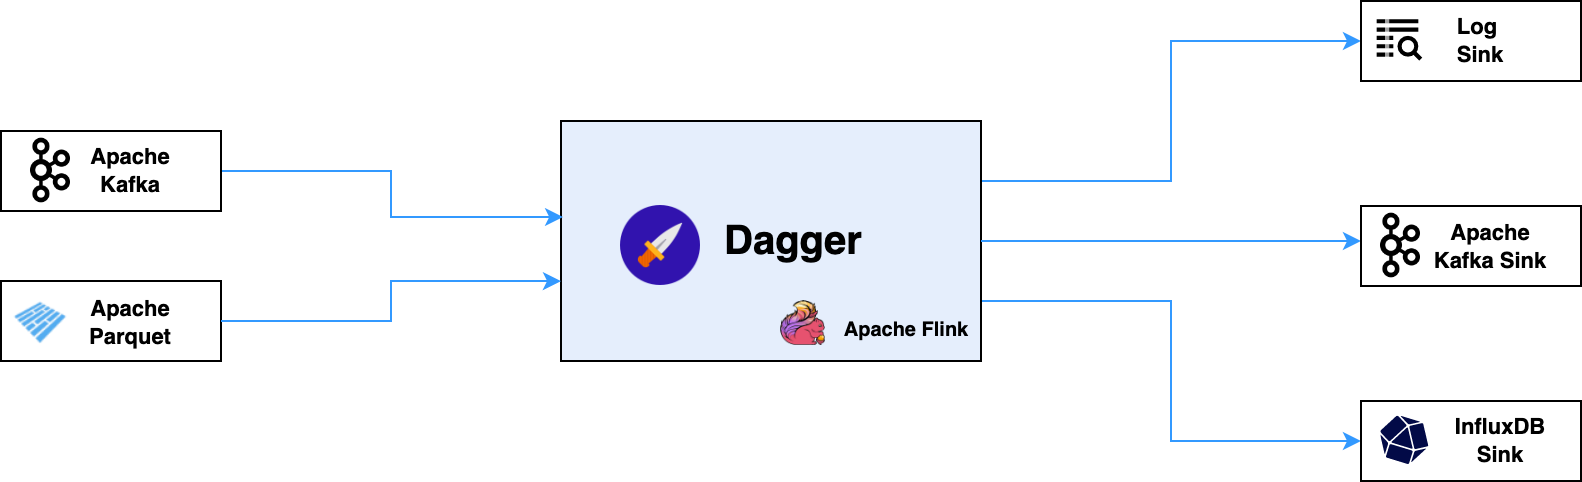
Dagger is an easy-to-use, configuration over code, cloud-native framework built on top of Apache Flink for stateful processing of real-time streaming data.
Network monitoring system written in Python and Django, designed to be extensible, programmable, scalable and easy to use by end users: once the system is configured, monitoring checks, alerts and metric collection happens automatically.
Universal BLE Smart Scale bridge. Captures body composition from Renpho, Xiaomi & 20+ others, syncs to Garmin Connect, Strava, MQTT (Home Assistant), InfluxDB, Webhooks, Ntfy & local files (CSV/JSONL). Headless CLI for Raspberry Pi, Linux, macOS & Windows.
High performance Kafka consumer for InfluxDB. Supports collectd message formats.
VictoriaMetrics Add-on for Home Assistant OS is the perfect solution for long term data storage of your smart home sensor data and visualization with Grafana.