node-exporter
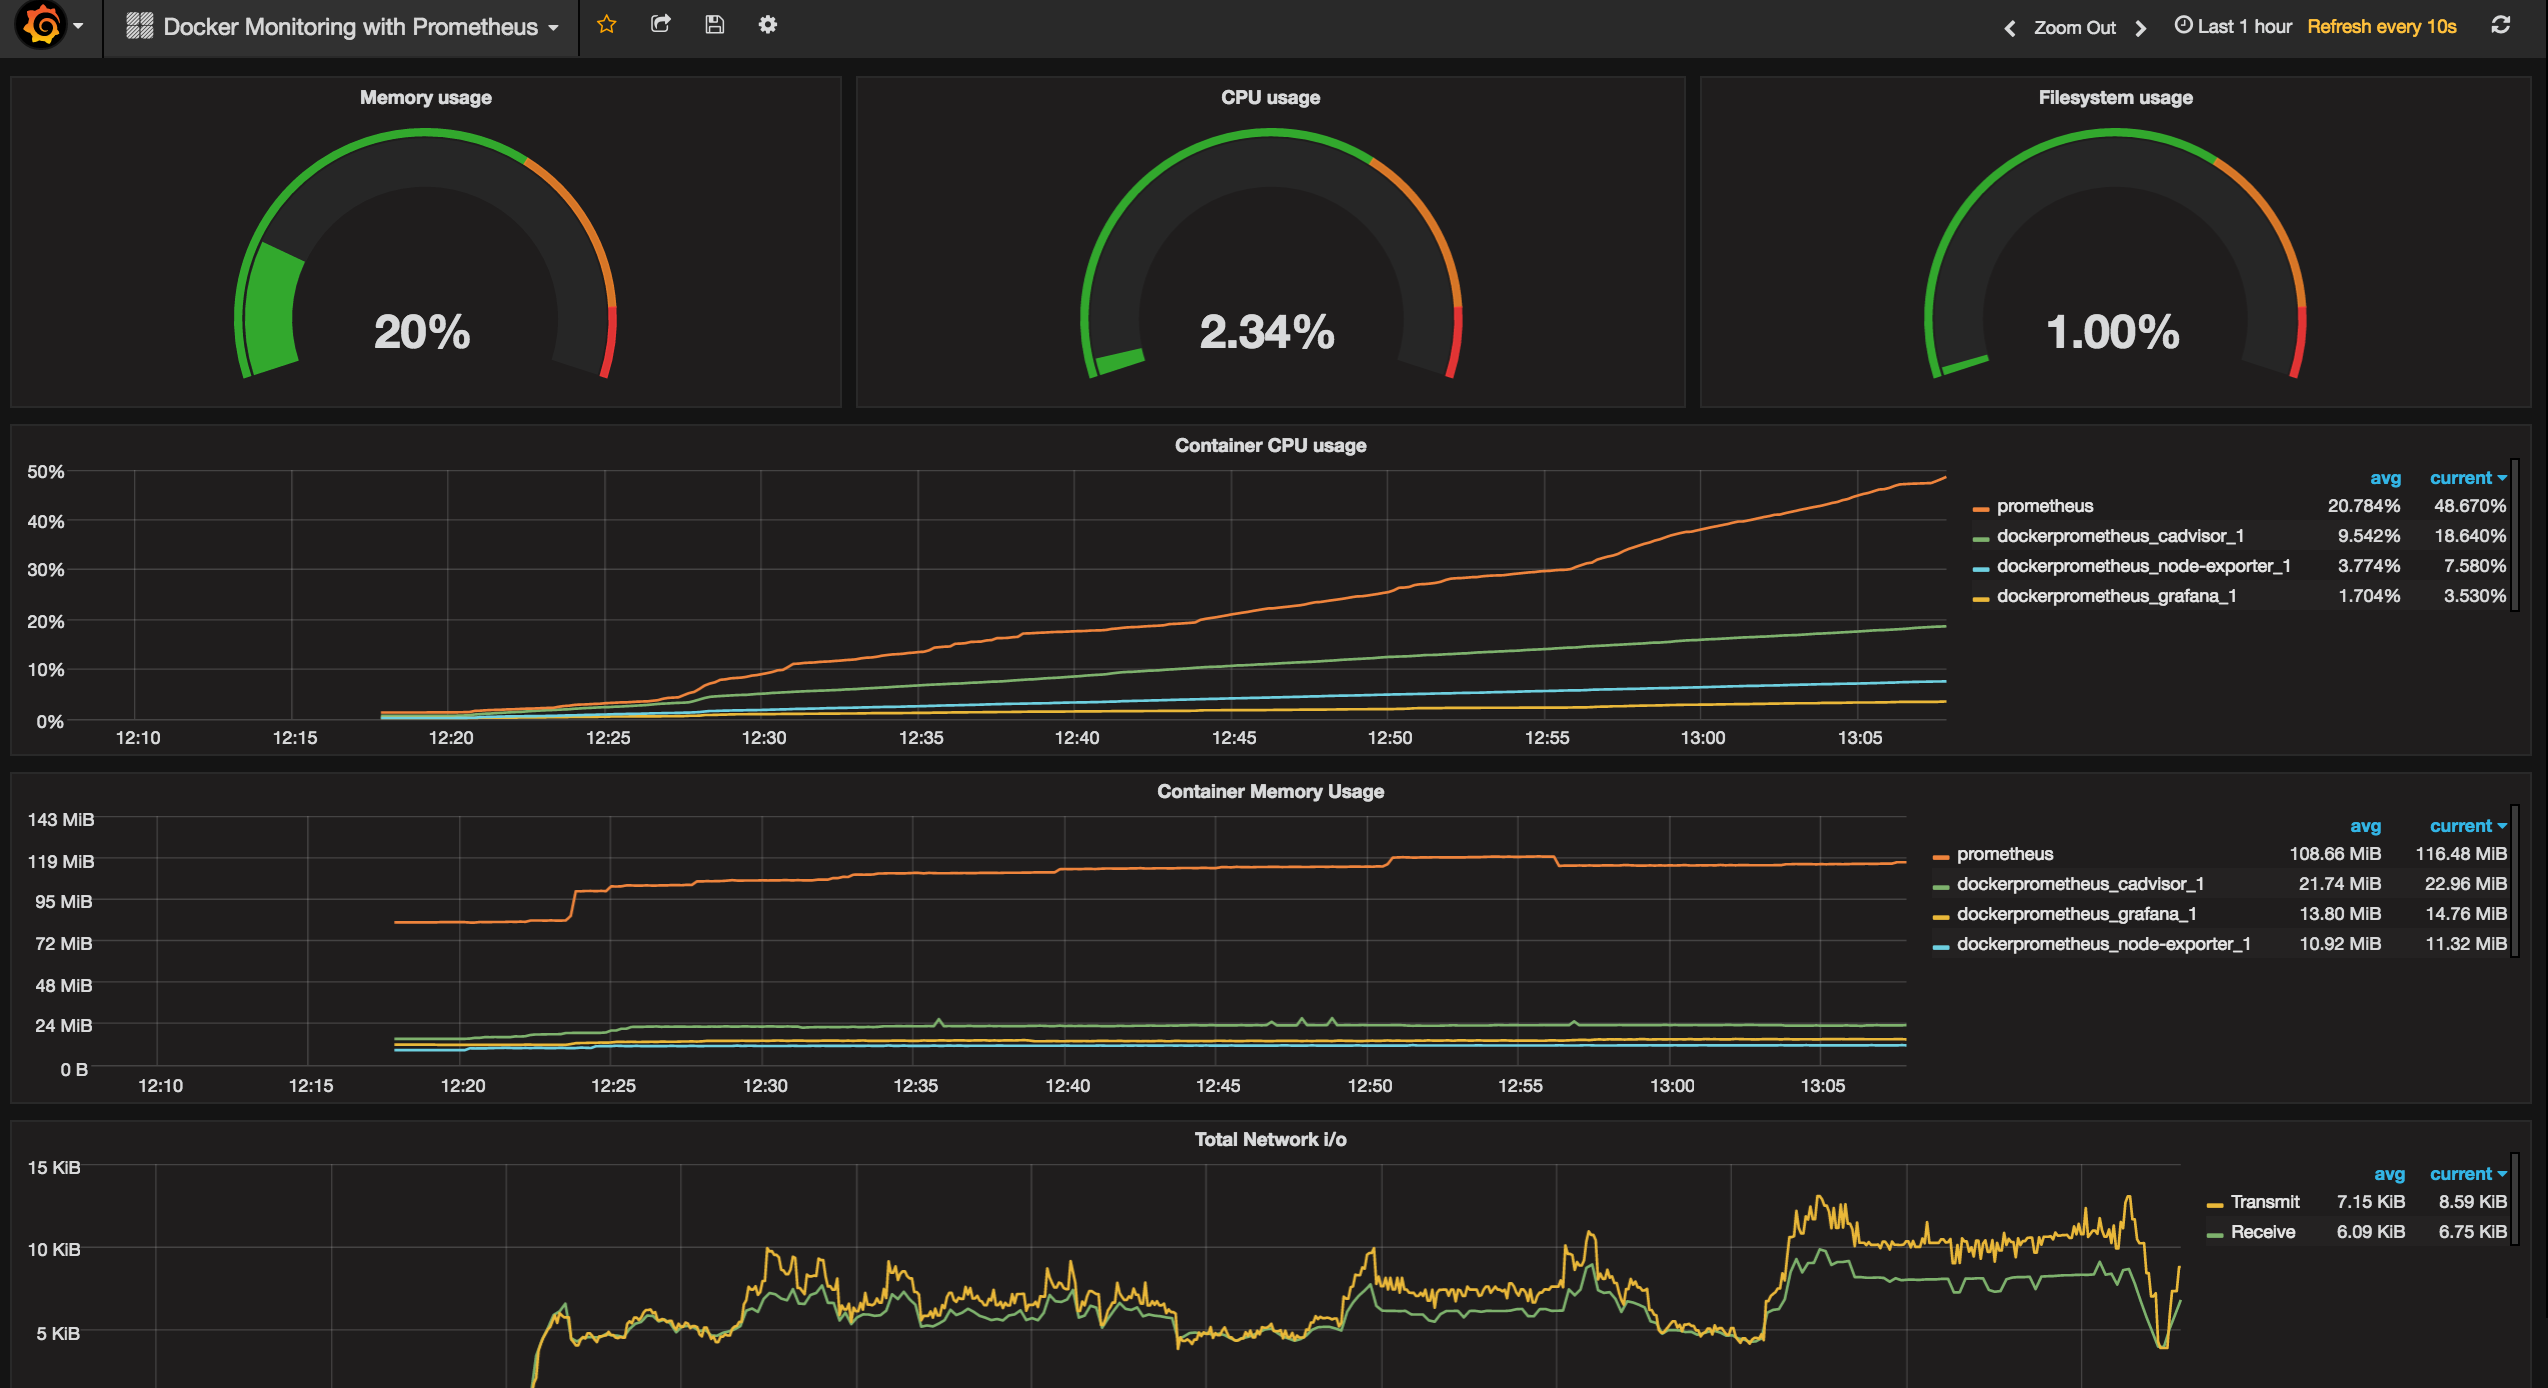

grafana-dashboards-kubernetes
A set of modern Grafana dashboards for Kubernetes.
- 3.8k
- Apache-2.0
- 3 d ago

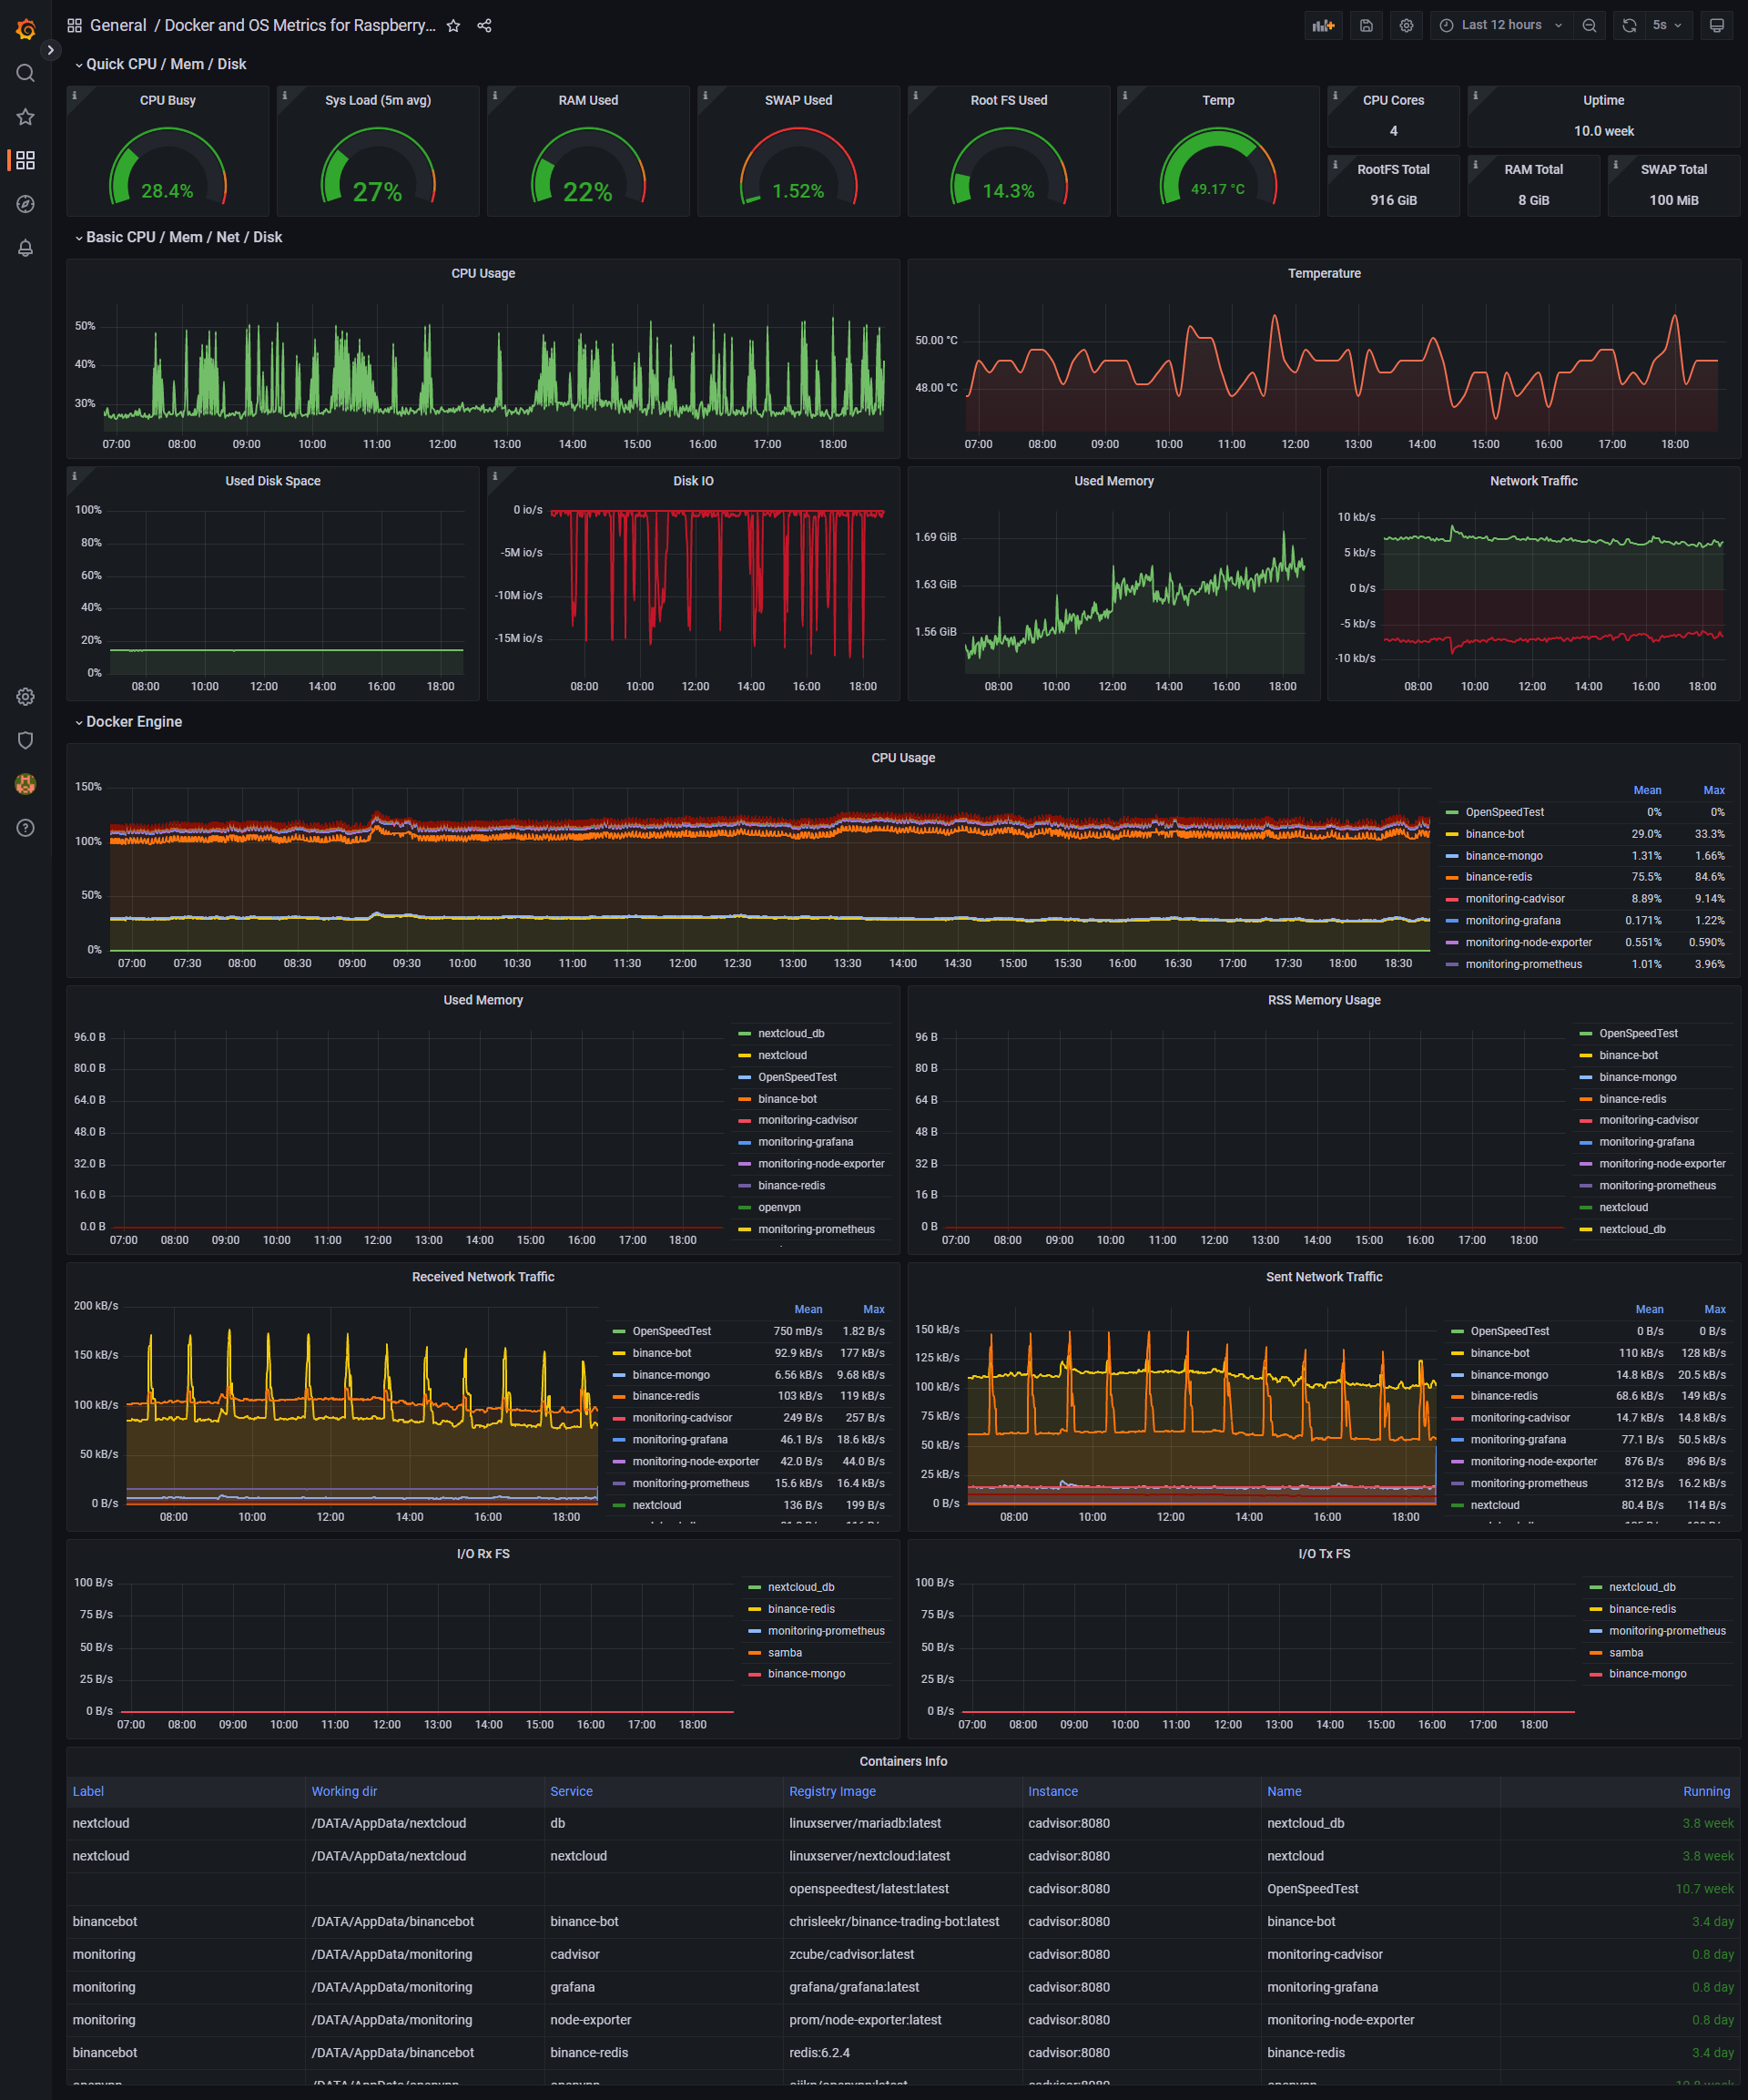
Docker-Raspberry-PI-Monitoring
A docker-compose stack solution for monitoring host and containers with Prometheus, Grafana, cAdvisor and NodeExporter.
- 580
- MIT
- 21 mo ago

docker-monitoring-stack-gpnc
Grafana Prometheus Node-Exporter cAdvisor - Docker Monitoring Stack
- 228
- Makefile
- MIT
- 2 mo ago

grafana-docker-stack
Docker stack config for deploying Grafana + Prometheus + Node Exporter
- 79
- GPL-3.0
- 4 mo ago


ansitheus
Ansible playbook - Containerize, configure and deploy Prometheus ecosystem
- 30
- Jinja
- Apache-2.0
- 6 d ago


DevSecOps-Project-Netflix-Deployment
Deploy a Netflix clone application using a secure CI/CD pipeline built with Jenkins, Docker 🐳 , and Kubernetes ☸️. This project includes implementing code quality and security tools (SonarQube, Trivy), as well as monitoring solutions (Prometheus, Grafana) to ensure reliability and visibility
- 22
- TypeScript
- 2 y ago


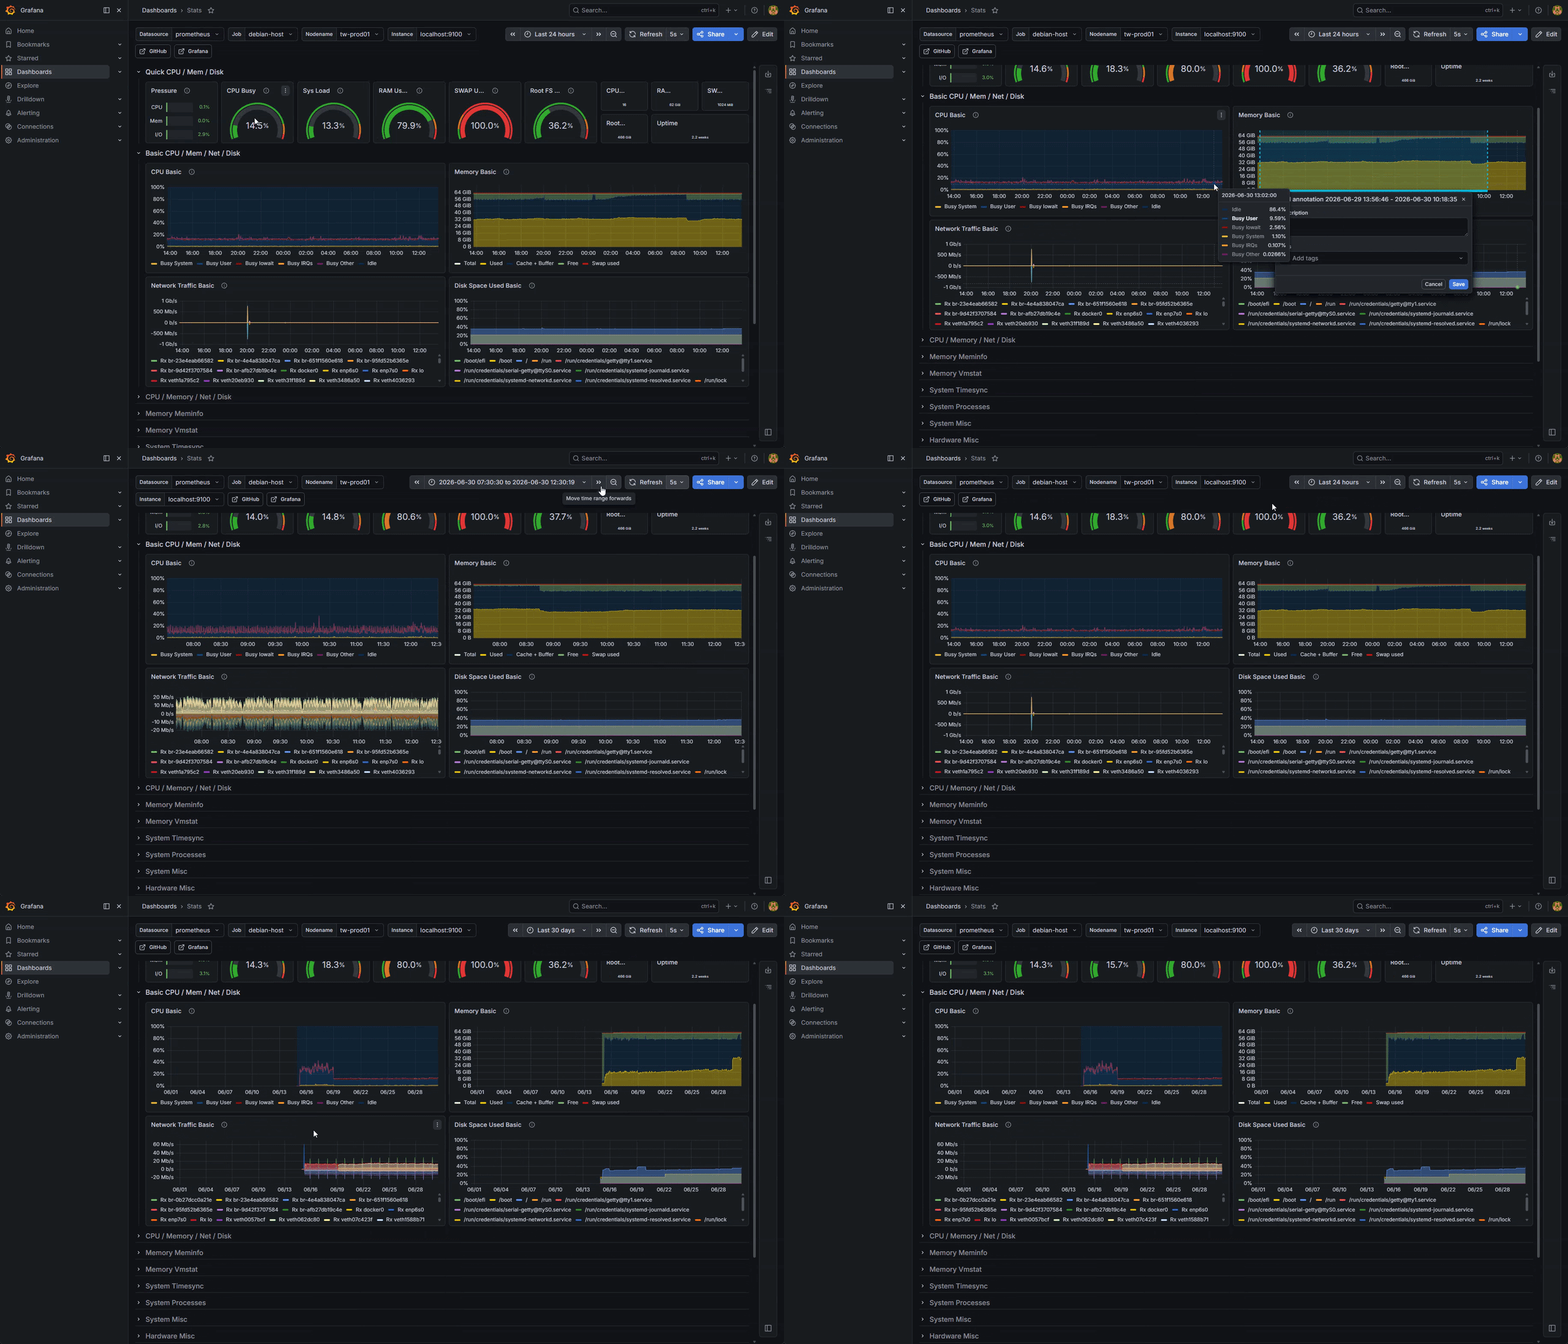
prometheus-grafana-on-host
A Docker Compose stack I use that runs Prometheus and Grafana on the host machine, allowing you to monitor your host system and any other services running on it. This setup includes Prometheus for metrics collection and Grafana for visualization. It uses Node Exporter to collect host metrics.
- 7
- 5 mo ago


easy-peasy-deployment
Painless deployment of your favorite MLOps technologies with Docker - Grafana, Prometheus, Airflow, Spark, Postgres, Redis, NPM, Traefik and ...
- 13
- Dockerfile
- MIT
- 3 y ago

grafana-docker-compose
Grafana Docker Compose stack with Prometheus, Alertmanager, Node Exporter and cAdvisor, plus a provisioned dashboard and alert rules.
- 2
- MIT
- 4 d ago


prometheus_grafana_quickstart
Easily build monitoring systems with Prometheus/Grafana just a single command of docker compose
- 0
- Shell
- MIT
- 3 y ago


