powsybl-diagram
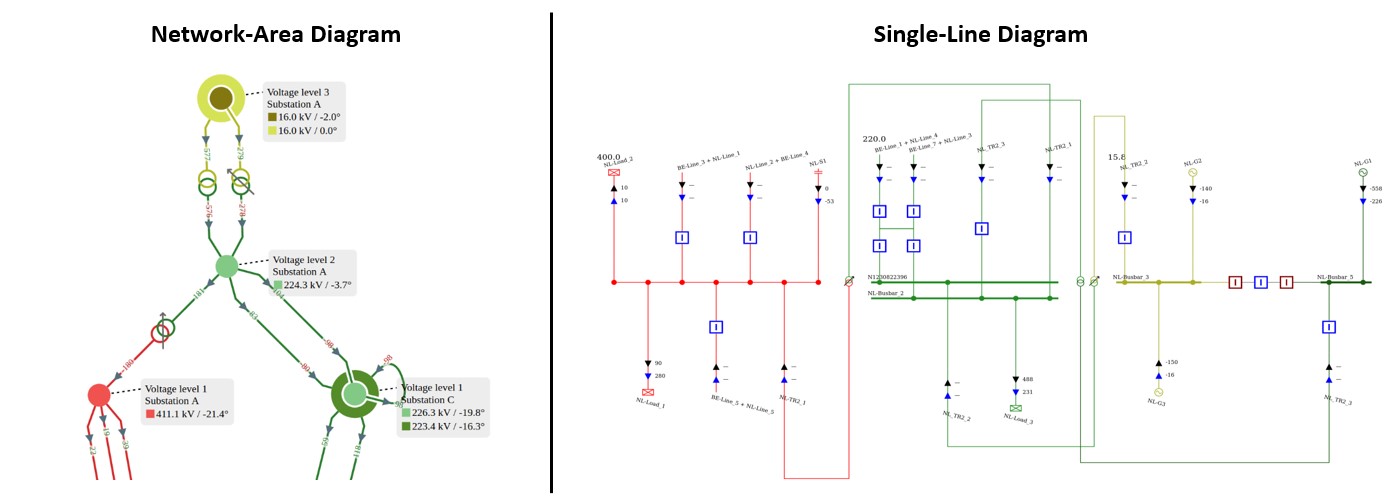
SVG diagrams generation: single-line substation diagrams and network graph diagrams
- 136
- Java
- MPL-2.0
- 2 d ago
SVG diagrams generation: single-line substation diagrams and network graph diagrams
Python notebooks demonstrating PyPowSyBl features
This project will present an applied and game-like approach to simulating the load growth, investment decisions by two types of generation technologies, demand-price responsiveness, and reliability, of a test-case power system. The simulation begins as a 9-bus system with existing generation (3 generators) and transmission lines (8 lines). System topology can be viewed in a figure throughout the g
An extension to PowSyBl Open Load Flow to solve the load flow equations with the non-linear solver Knitro
The project required the computation of the Line Outage Distribution Factors (LODF) based on a user given branch outage number using the fast-decoupled XB version. The LODF values were used to approximate the post-contingency branch flows based on a pre-contingency branch flow and the base branch flow before the contingency. The AC power flows were compared with the DC method for the MW and MVA f
1P1Q screening estimates the complex voltage V vector following a disturbance. This project considers either an outage if generator 2 or generator 3 , but not both, affecting the voltage. The program flow and algorithm is as follows


