coroot
Coroot is an open-source observability and APM tool with AI-powered Root Cause Analysis. It combines metrics, logs, traces, continuous profiling, and SLO-based alerting with predefined dashboards and inspections.
- 8k
- Go
- Apache-2.0
- 3 d ago
Coroot is an open-source observability and APM tool with AI-powered Root Cause Analysis. It combines metrics, logs, traces, continuous profiling, and SLO-based alerting with predefined dashboards and inspections.
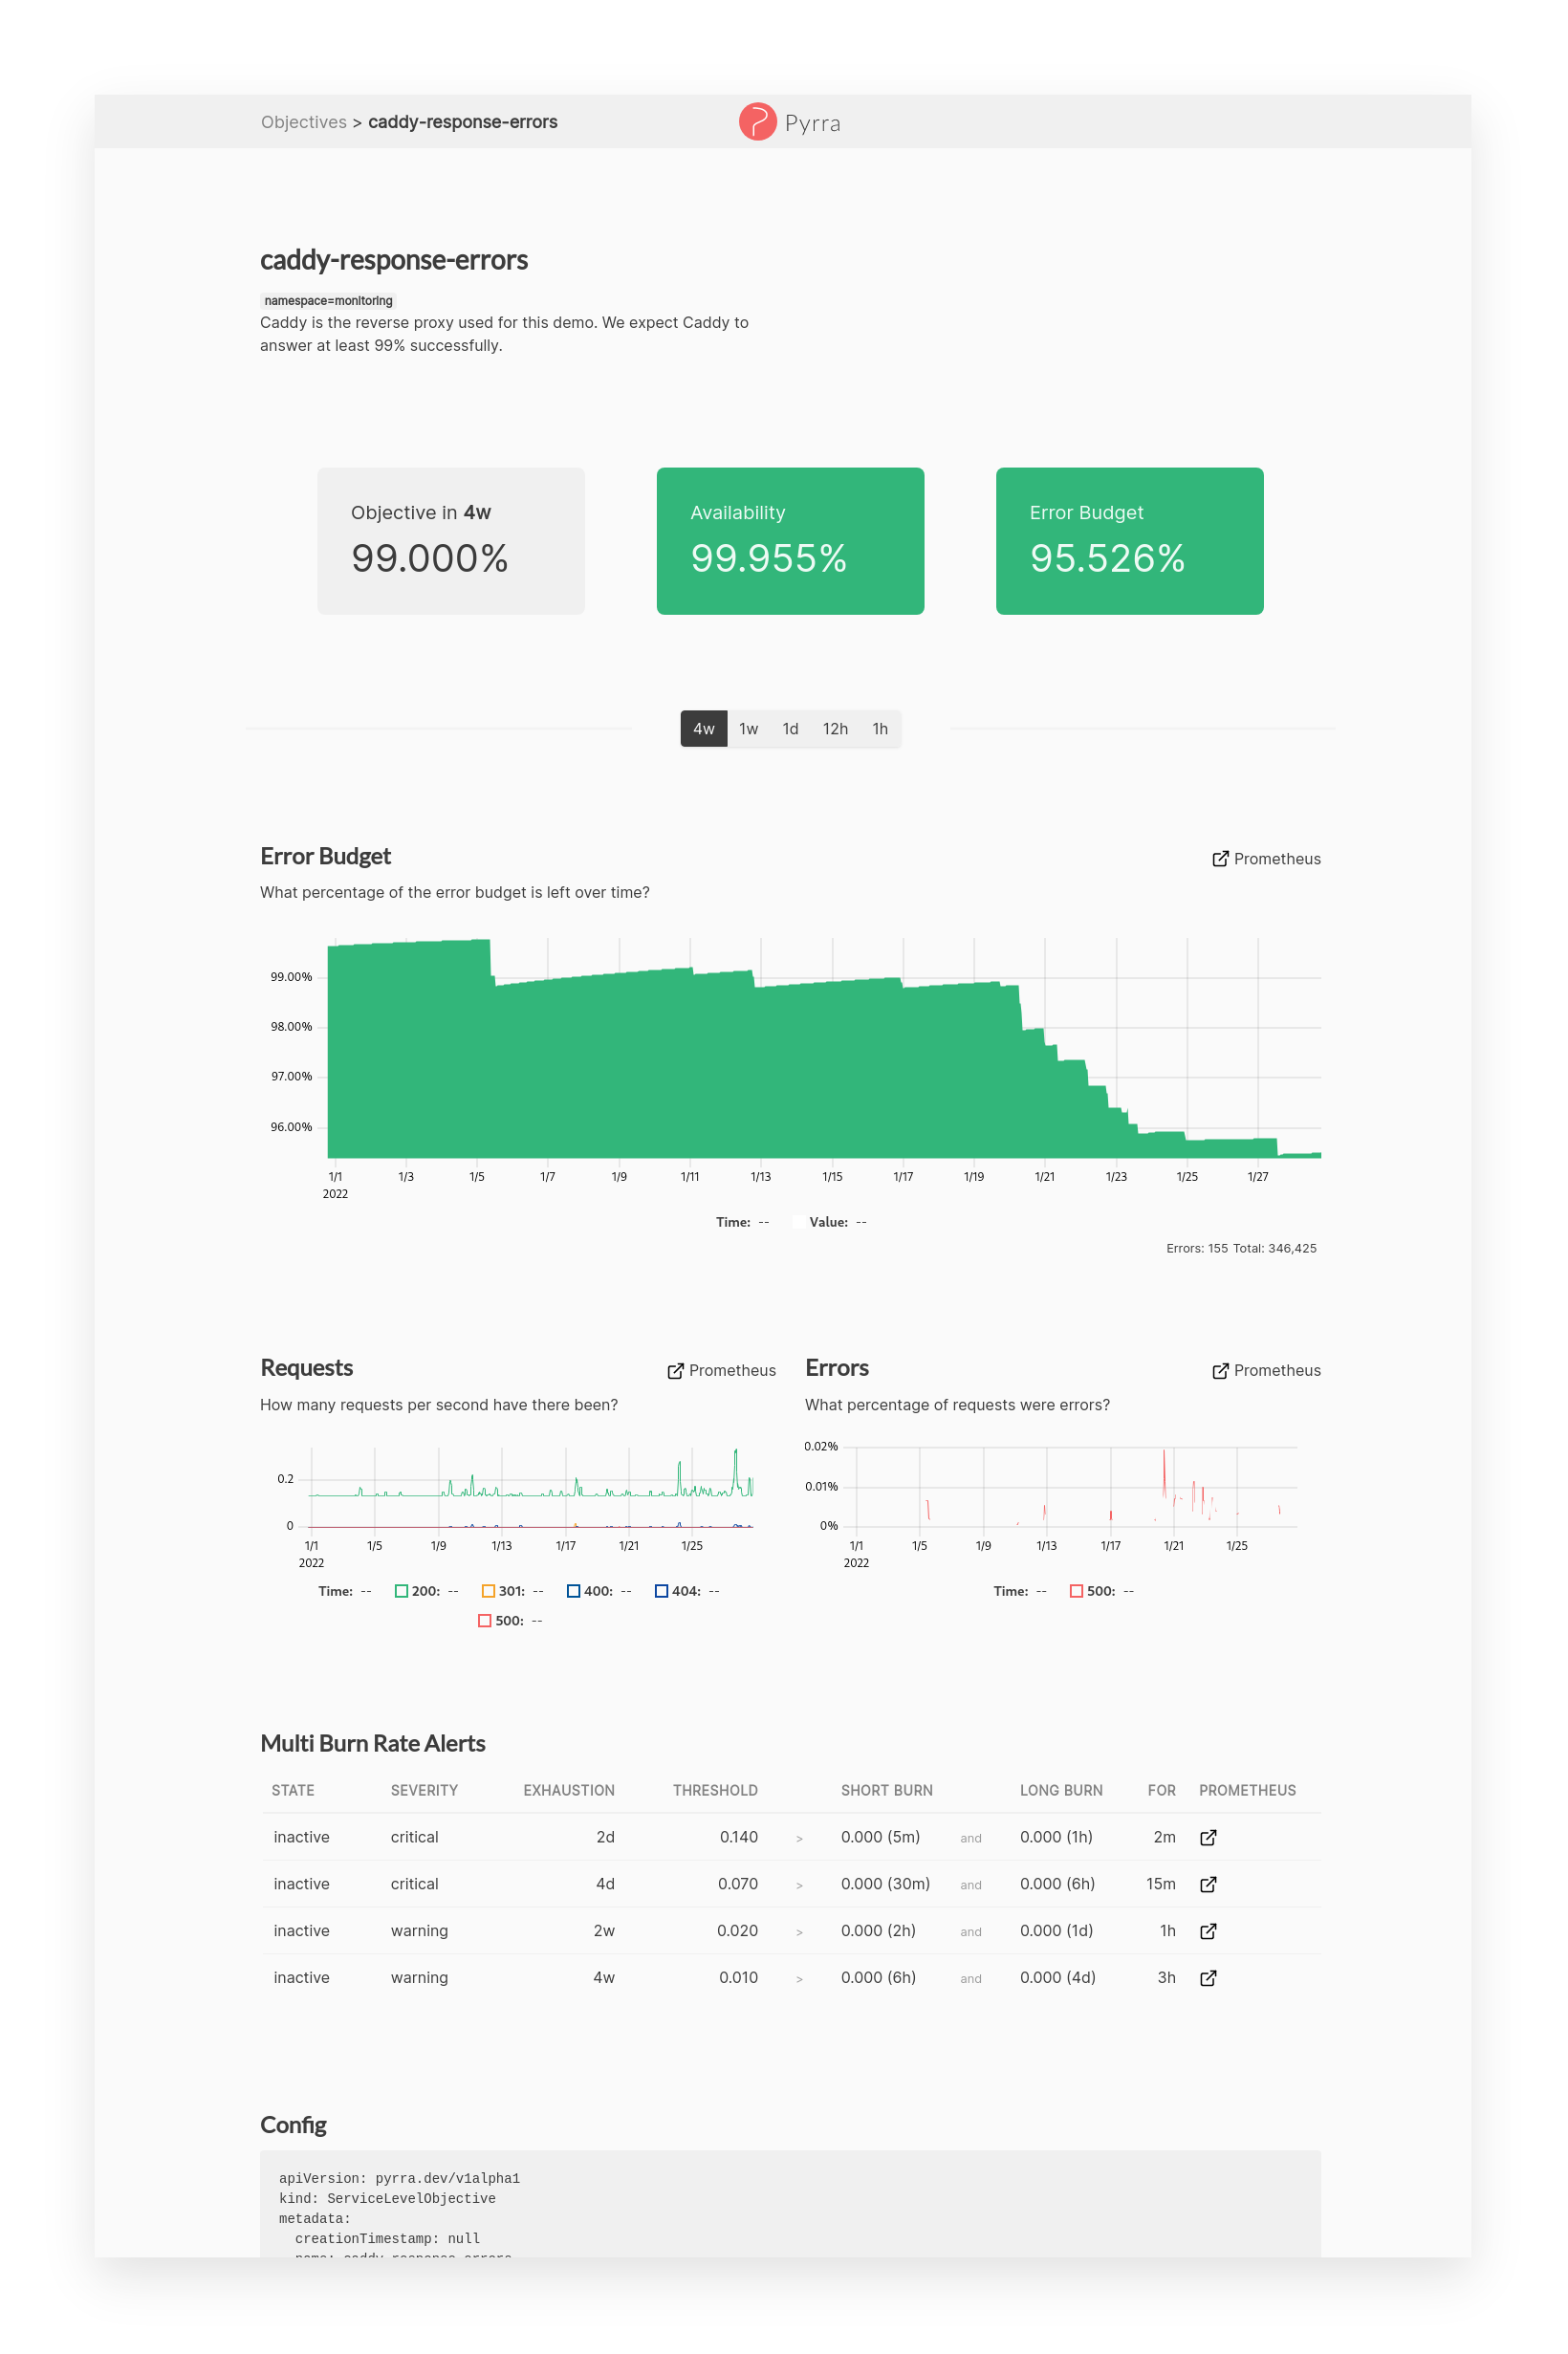
Making SLOs with Prometheus manageable, accessible, and easy to use for everyone!
Open specification for defining and expressing service level objectives (SLO)
An efficient and feature complete Hystrix like Go implementation of the circuit breaker pattern.
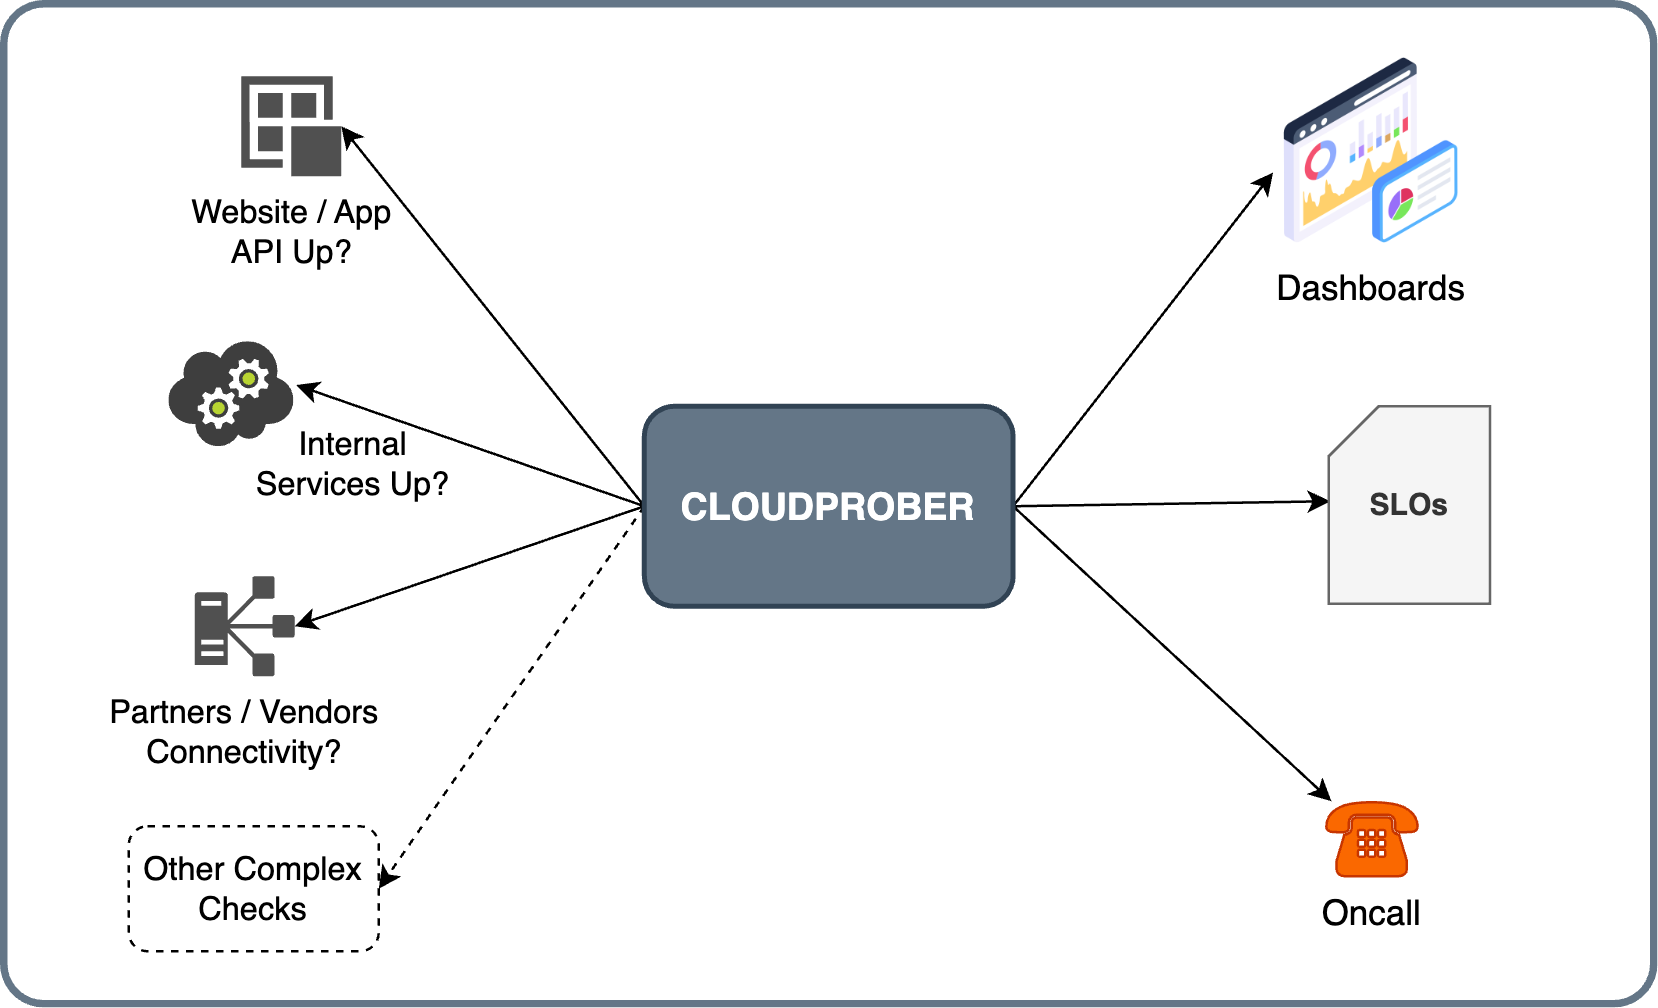
An active monitoring software to detect failures before your customers do.
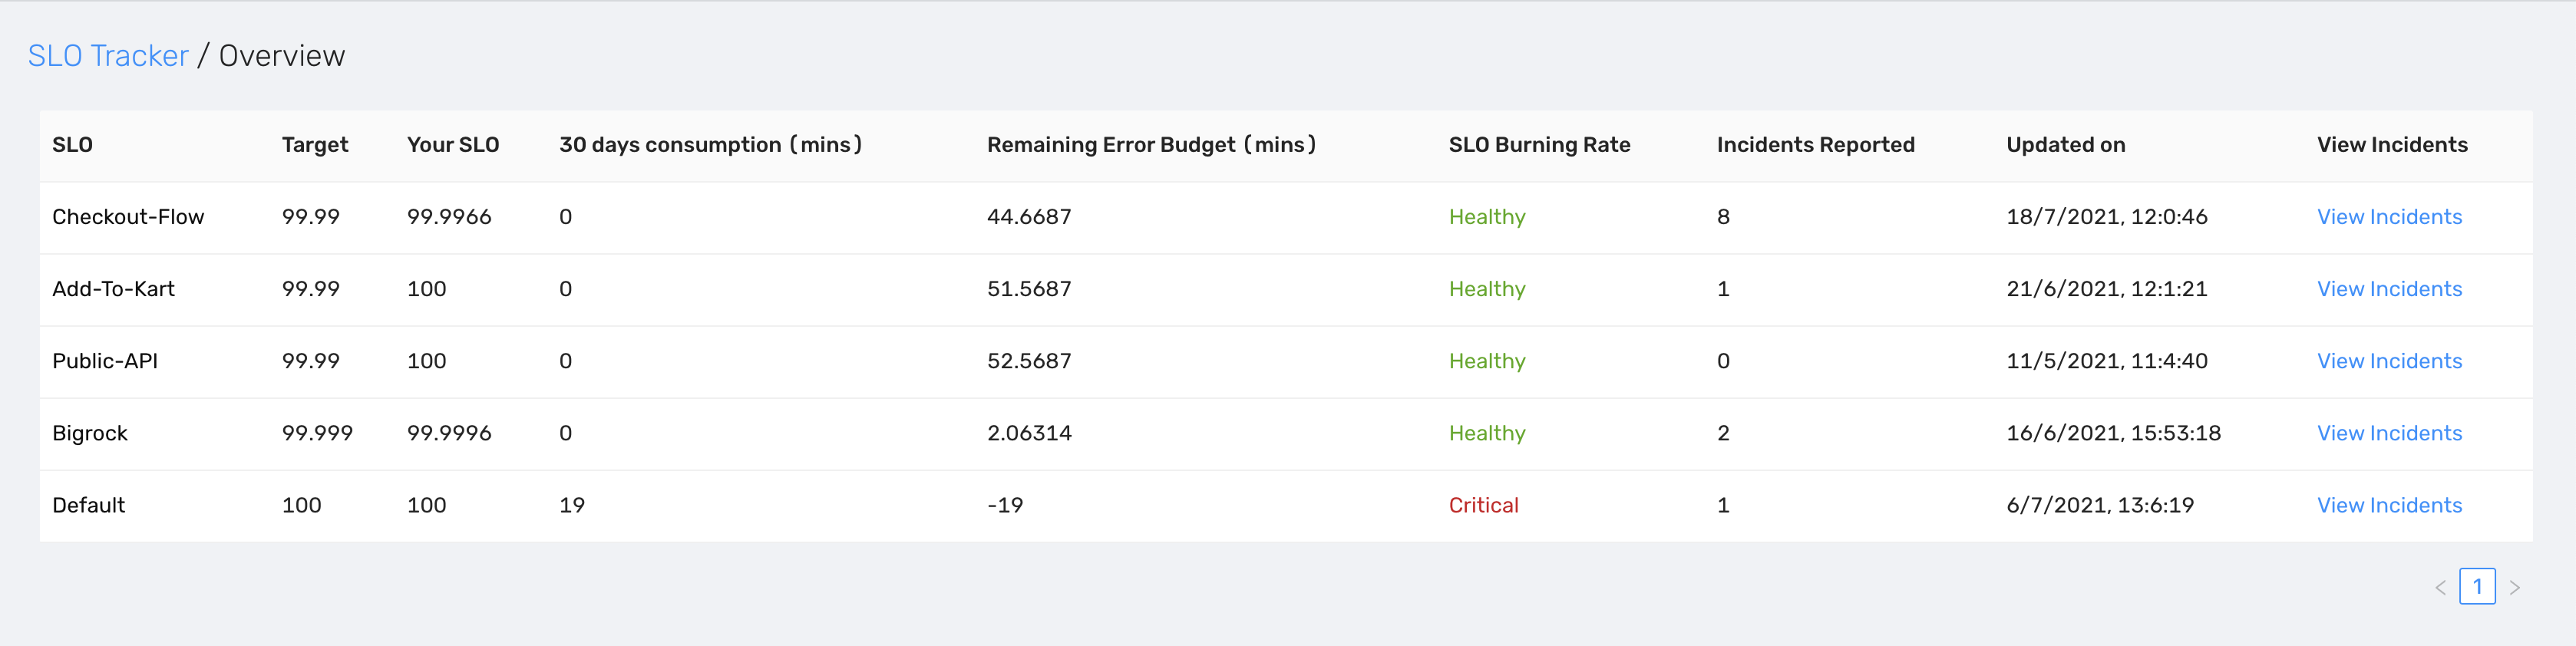
Slo-exporter computes standardized SLI and SLO metrics based on events coming from various data sources.
SLOs, Error windows and alerts are complicated. Here an attempt to make it easy
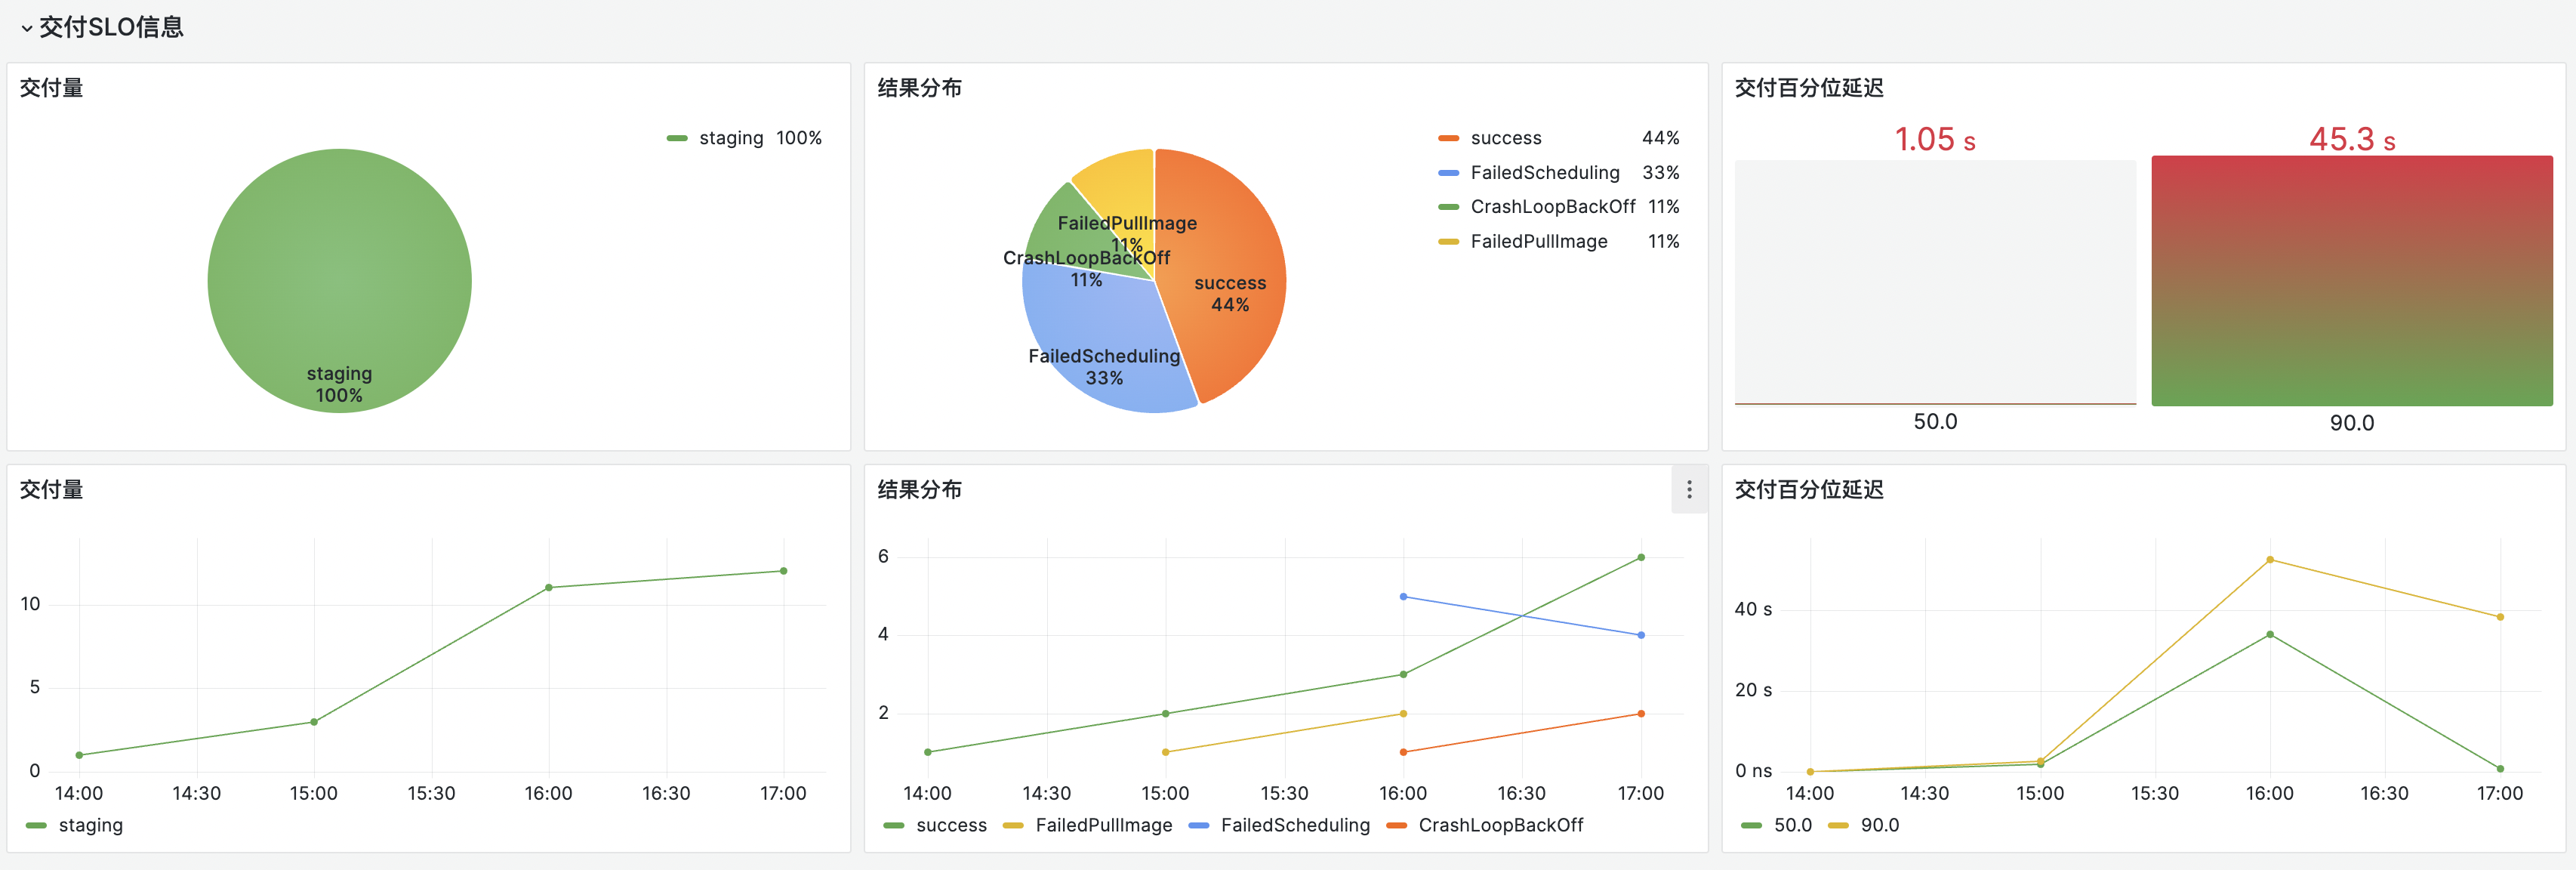
Simplify Kubernetes applications operation with one-stop observability services, including resource delivery SLO,root cause diagnoses and container lifecycle tracing and more.
Calculate how much downtime should be permitted in your Service Level Agreement or Objective
Simple Sloth SLO generator on the browser using Sloth as a Go library and WASM.
Anomaly detection for alerting: statistical methods, LLMs and Jev-style decision models compared on synthetic p99 latency scenarios, with a minute-by-minute replay site
Check a support ticket export (CSV or JSON) against an SLA: first response and resolution targets per priority, counted in business hours with time zone, working days, holidays and pauses, or 24x7. Reports missed targets, open tickets overdue or at risk as of a given time, bad timestamps. GitHub annotations. Zero dependencies.
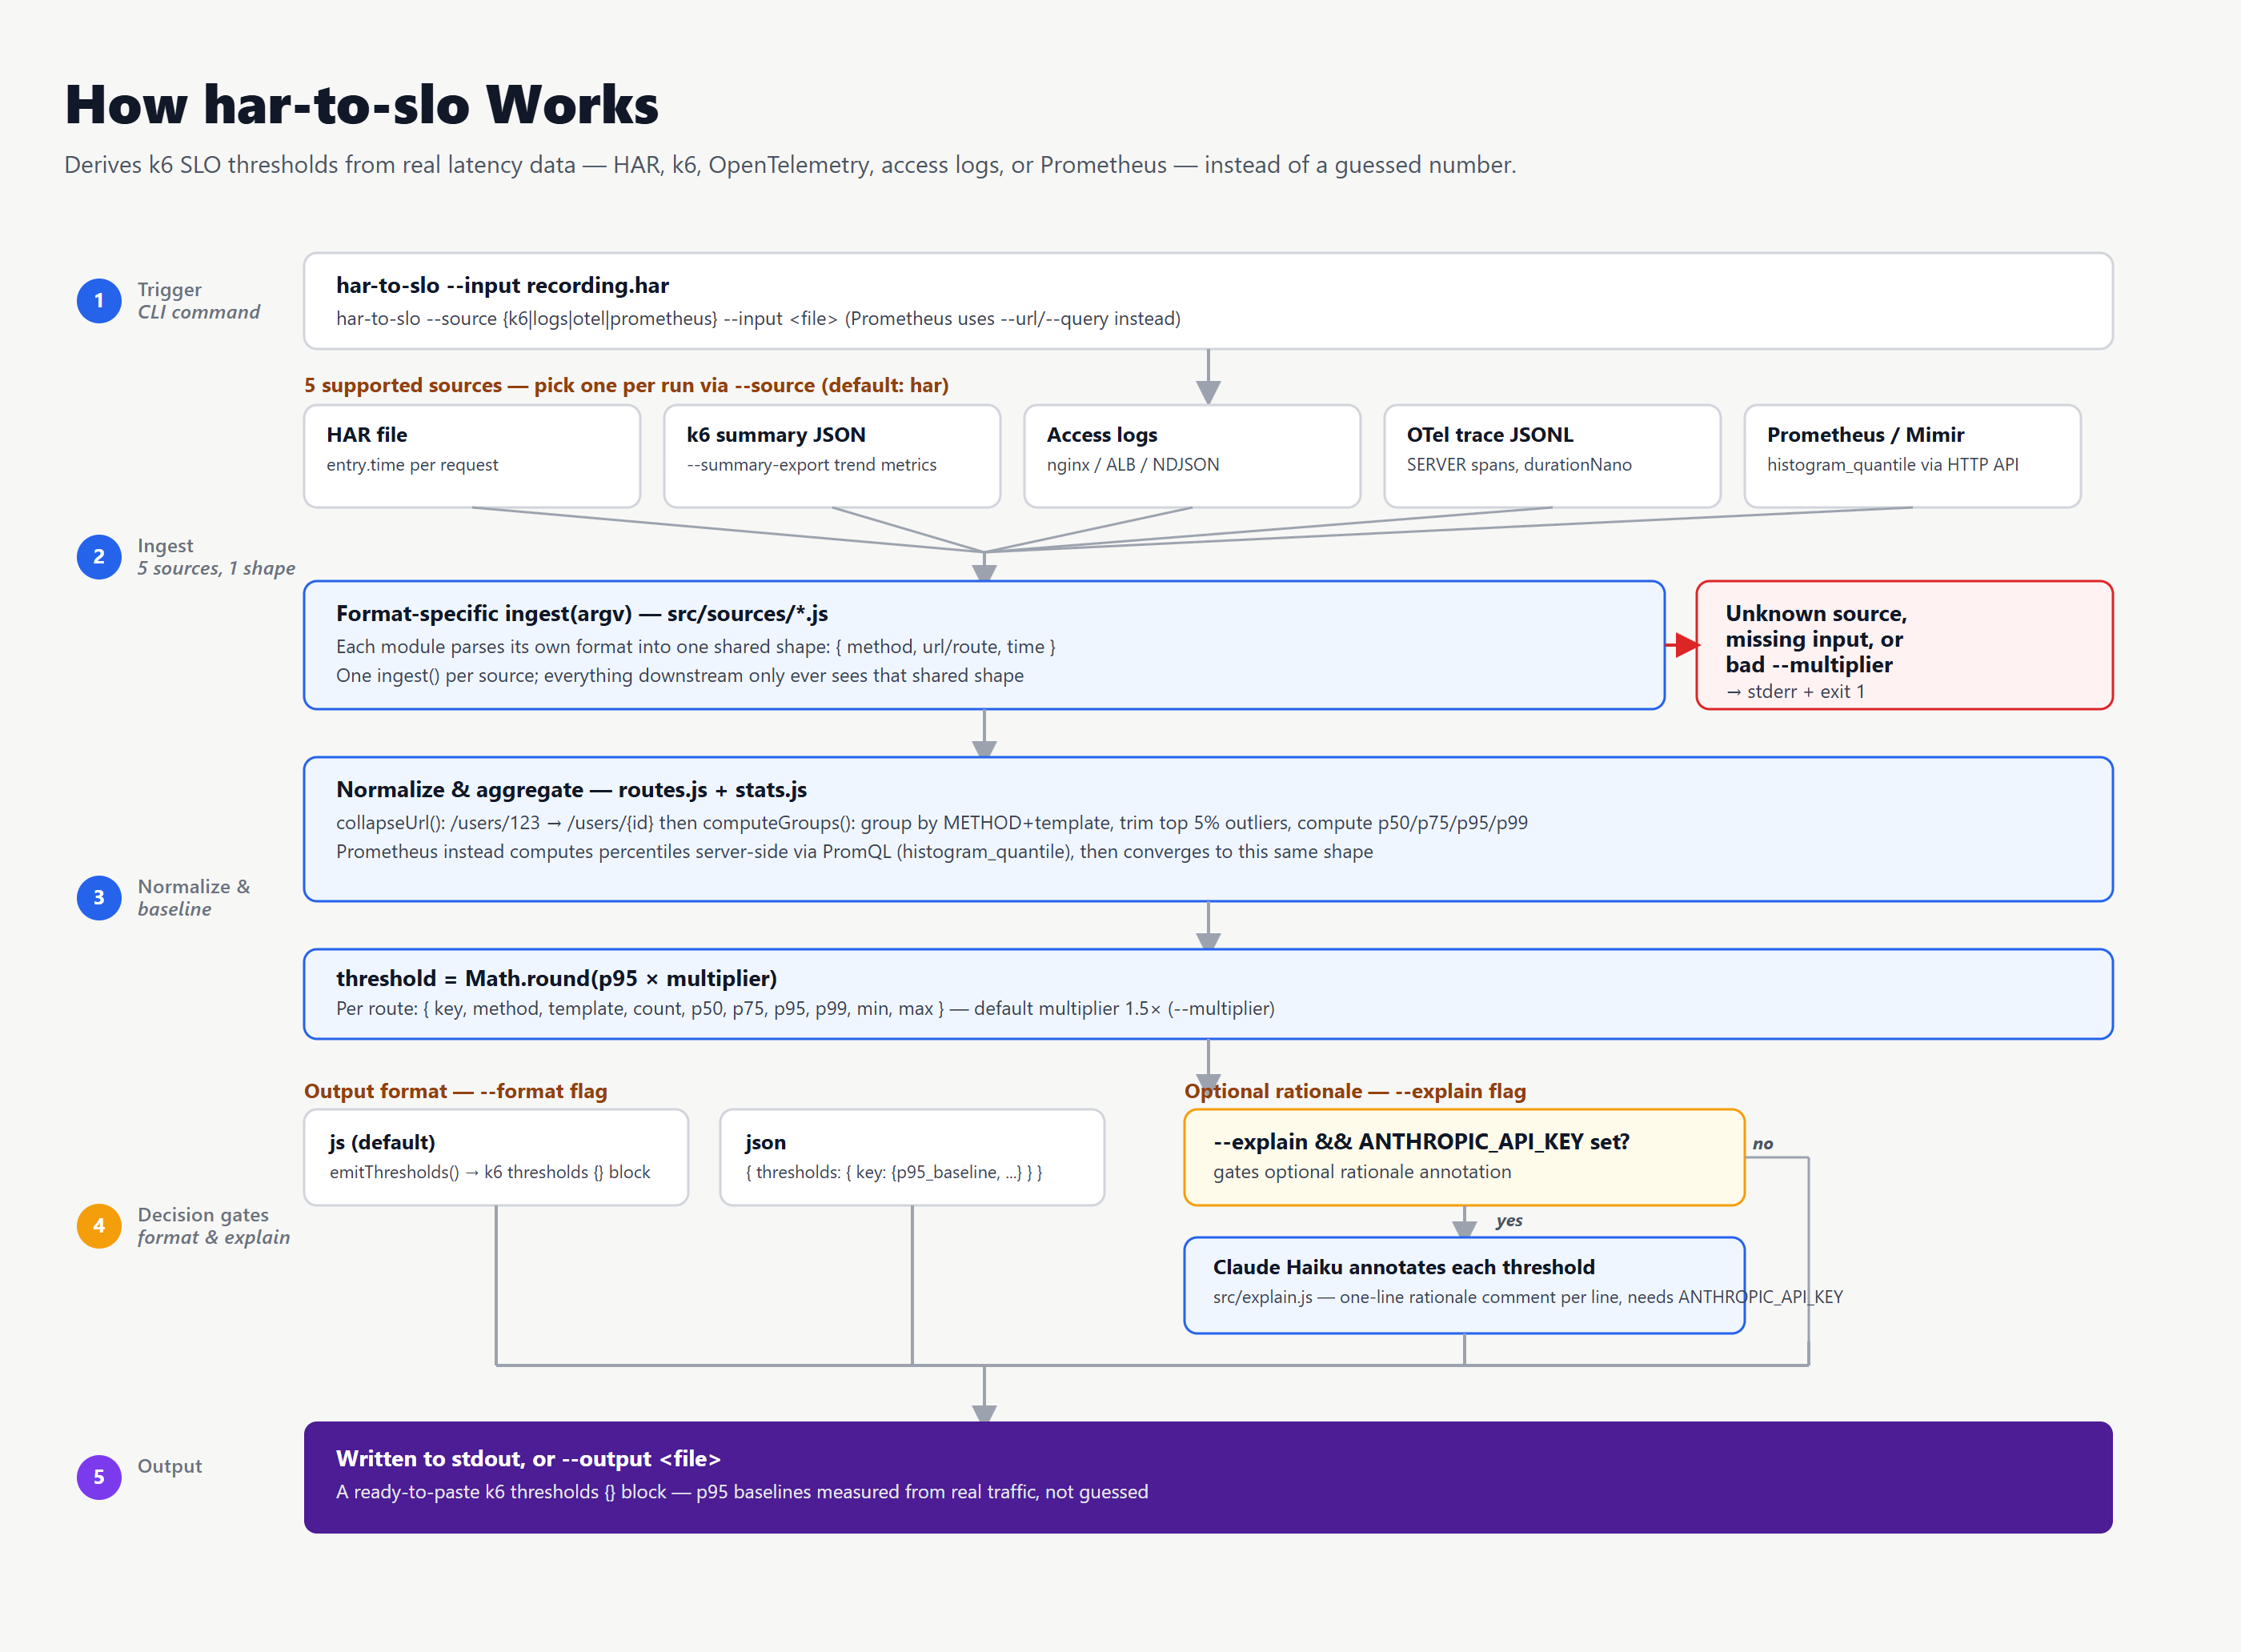
Derive k6 SLO baselines from any latency source — HAR, k6, OpenTelemetry, access logs, or Prometheus
SRE reliability assessment of a 7-node production-style cluster: availability measured from live telemetry, a 12-mode FMEA, MTTR analysis, a 3-2-1 backup gap review, RTO and RPO targets, and a 15-item risk register.
Application quality target check CLI: reads CSV or JSON quality targets organized by the ISO/IEC 25010 product quality model and measured results, and flags missed targets with the gap, unmeasured targets, characteristics with no target, unknown characteristics and units, and targets with no owner or method. Zero dependencies.