vue-data-ui
An open source user-empowering data visualization Vue 3 components library for eloquent data storytelling
- 2.5k
- Vue
- MIT
- 4 h ago
An open source user-empowering data visualization Vue 3 components library for eloquent data storytelling
📊 Data visualization library for React. Maintained by @goodcodeus.
Word-sized charts for React, made for LLMs and humans — 106 chart types, zero runtime dependencies, accessible by default, RSC-safe.
DuckDB extension for ASCII and Unicode data visualization in SQL, including bar charts, density plots, and sparklines.
An elegant, reactive and responsive sparkline chart solution without dependency.
Terminal-native charts. Sparklines, line, bar, scatter, candlestick — composable, typed, zero deps.
Unicode block output for terminals, SVG output for the browser, and PNG byte arrays. Themed colour schemes, anti-aliased PNG
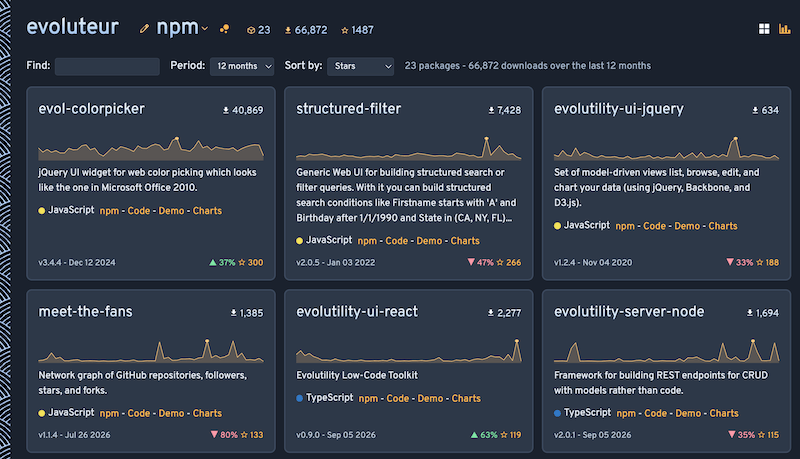
One page dashboard for all your npm packages: downloads, sparklines, trends, and GitHub stars.
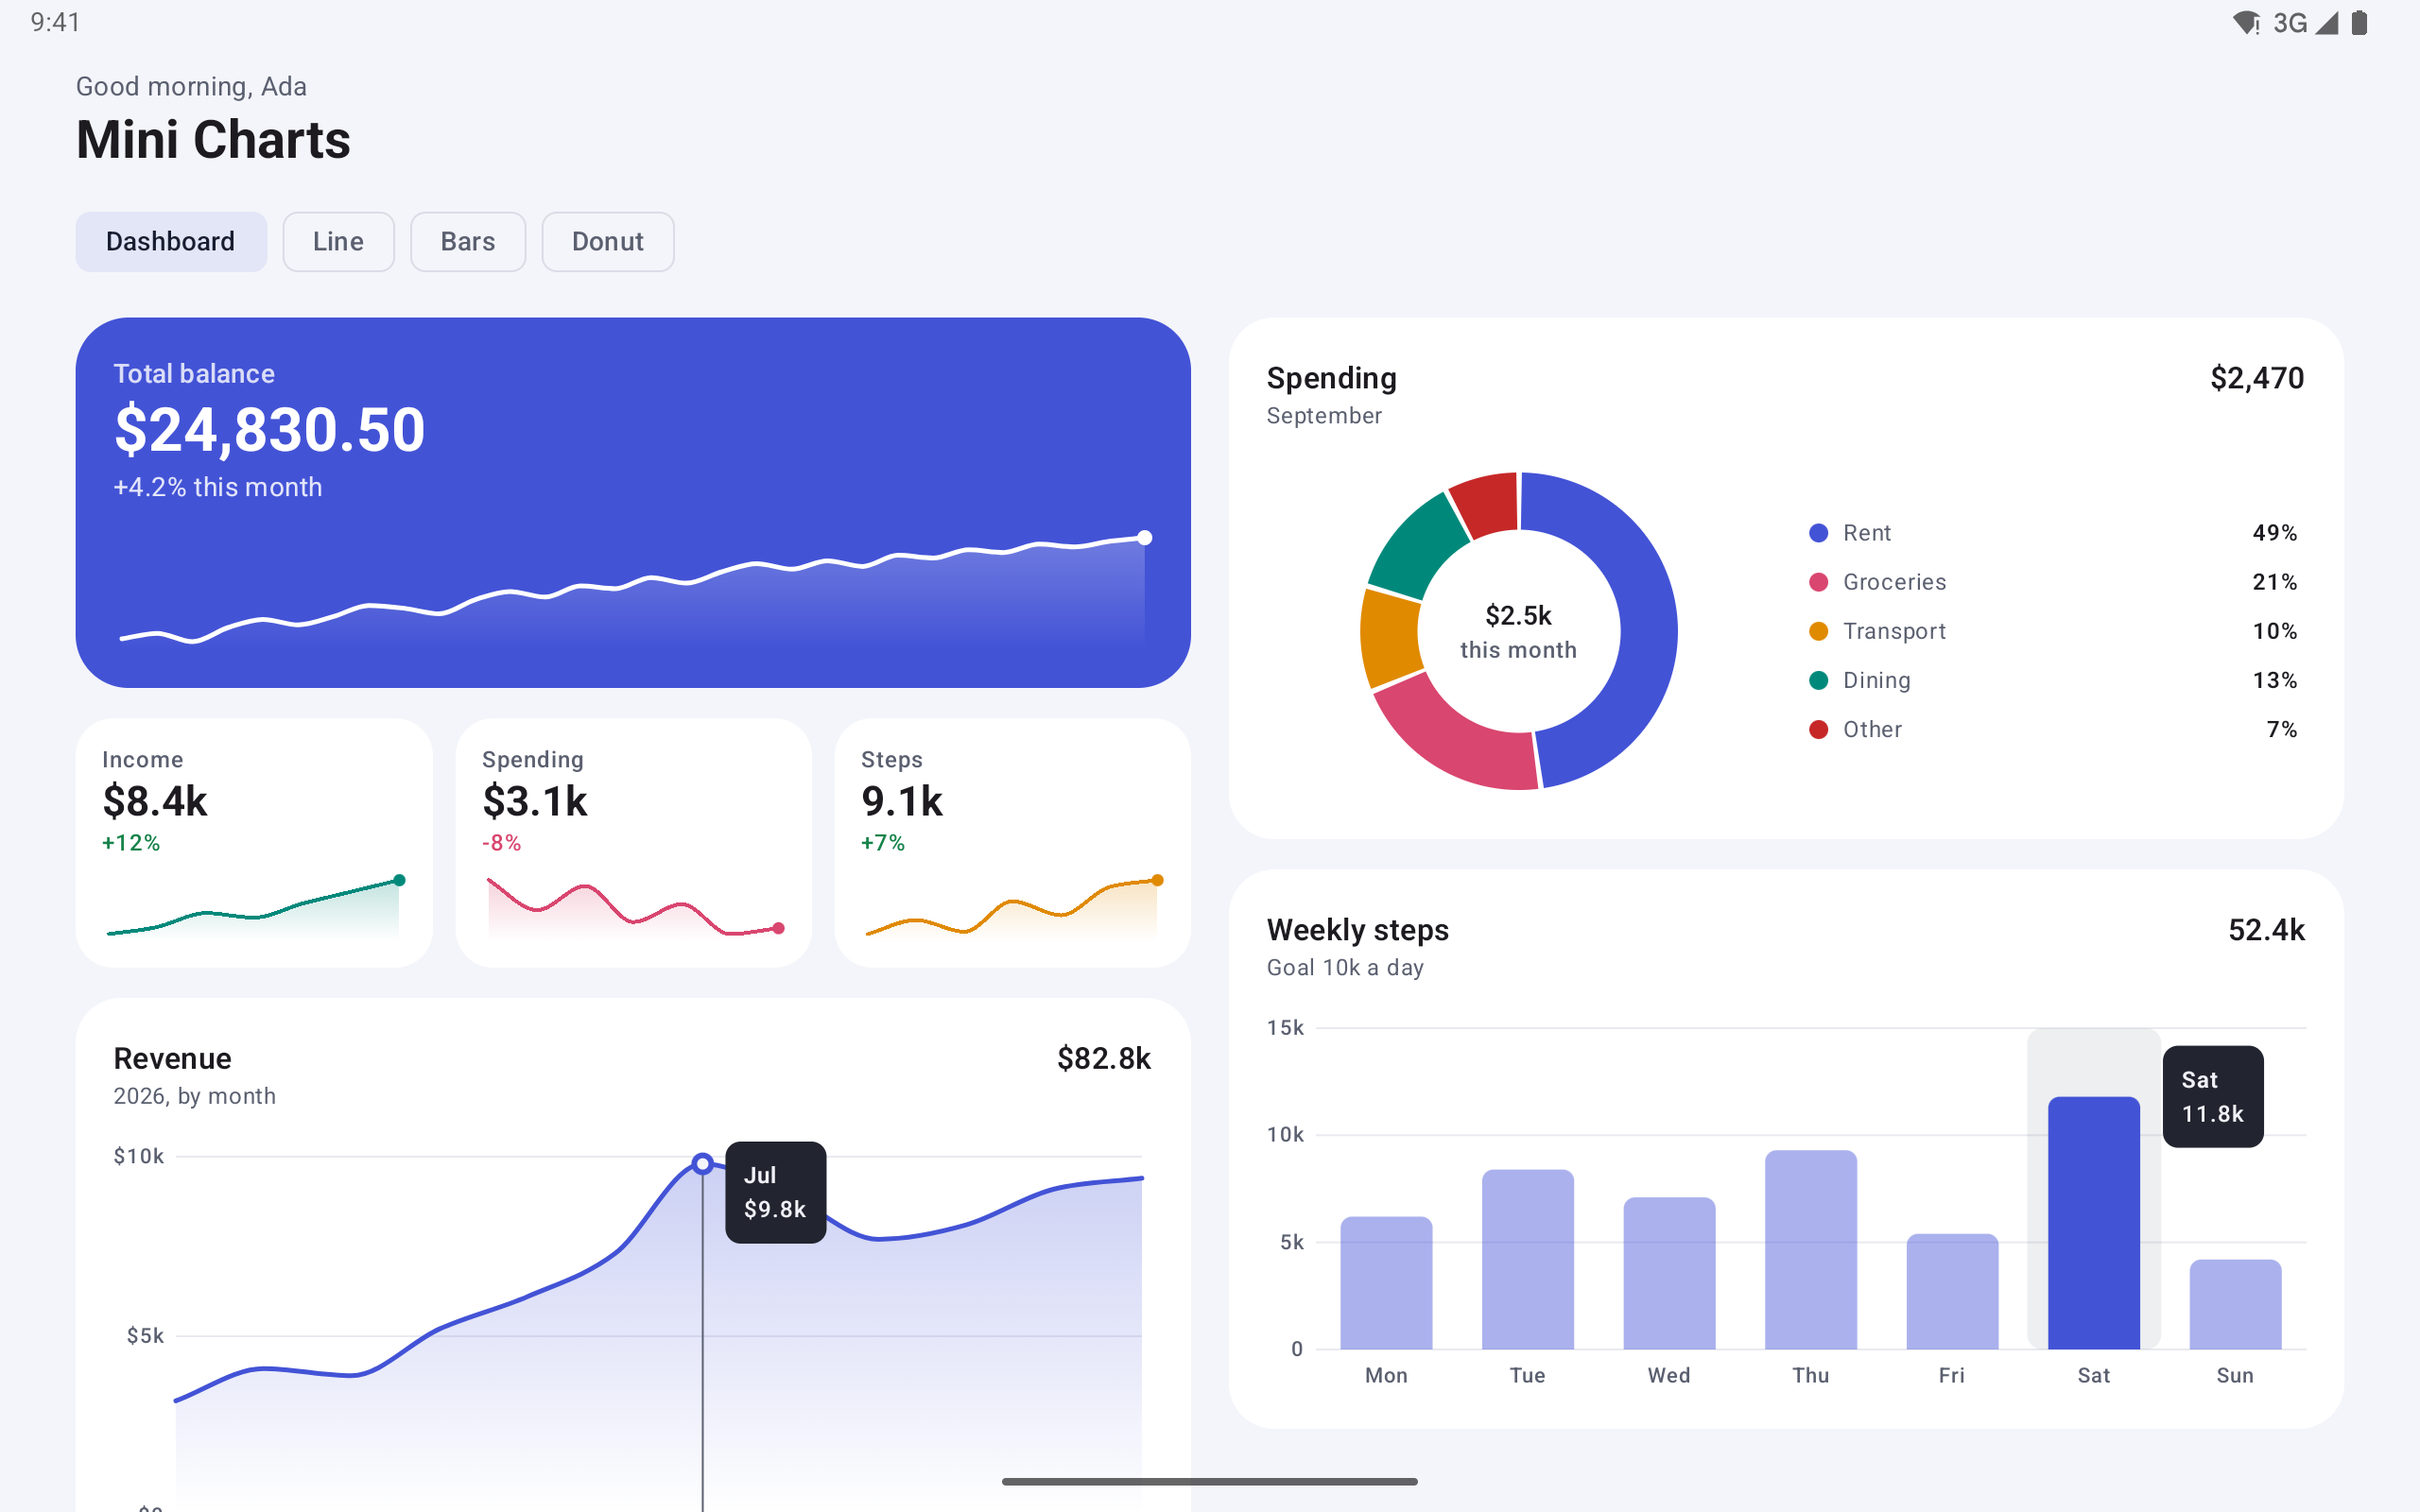
Lightweight charts for Jetpack Compose: sparkline, line, bar and donut with animations, touch highlight and accessibility. Canvas only, no dependencies.
This sample demonstrates a centralized HR app that unifies workforce planning, hiring pipeline, and employee experience in a single dashboard — giving HR leaders real-time visibility into headcount, requisitions and employee growth.