tableau

pygwalker
PyGWalker: Turn your dataframe into an interactive UI for visual analysis
- 16k
- Python
- Apache-2.0
- 3 mo ago

jimureport
积木报表:免费开源的报表与 BI 工具,可视化报表设计、数据大屏、仪表盘、打印设计、数据填报一站搞定;AI 一句话生成报表和大屏,Chat2BI 智能问数,类 Excel 在线设计,兼容国产信创数据源,是帆软、润乾报表的免费替代。
- 8.6k
- Java
- GPL-3.0
- 8 d ago

Rath
Next generation of automated data exploratory analysis and visualization platform.
- 4.7k
- TypeScript
- AGPL-3.0
- 3 mo ago

graphic-walker
An open source alternative to Tableau. Embeddable visual analytic
- 3.3k
- TypeScript
- Apache-2.0
- 16 h ago

DataSphereStudio
DataSphereStudio is a one stop data application development& management portal, covering scenarios including data exchange, desensitization/cleansing, analysis/mining, quality measurement, visualization, and task scheduling.
- 3.3k
- Java
- Apache-2.0
- 13 mo ago


Stock_Analysis_For_Quant
Various Types of Stock Analysis in Excel, Matlab, Power BI, Python, R, and Tableau
- 2.1k
- Jupyter Notebook
- MIT
- 19 mo ago

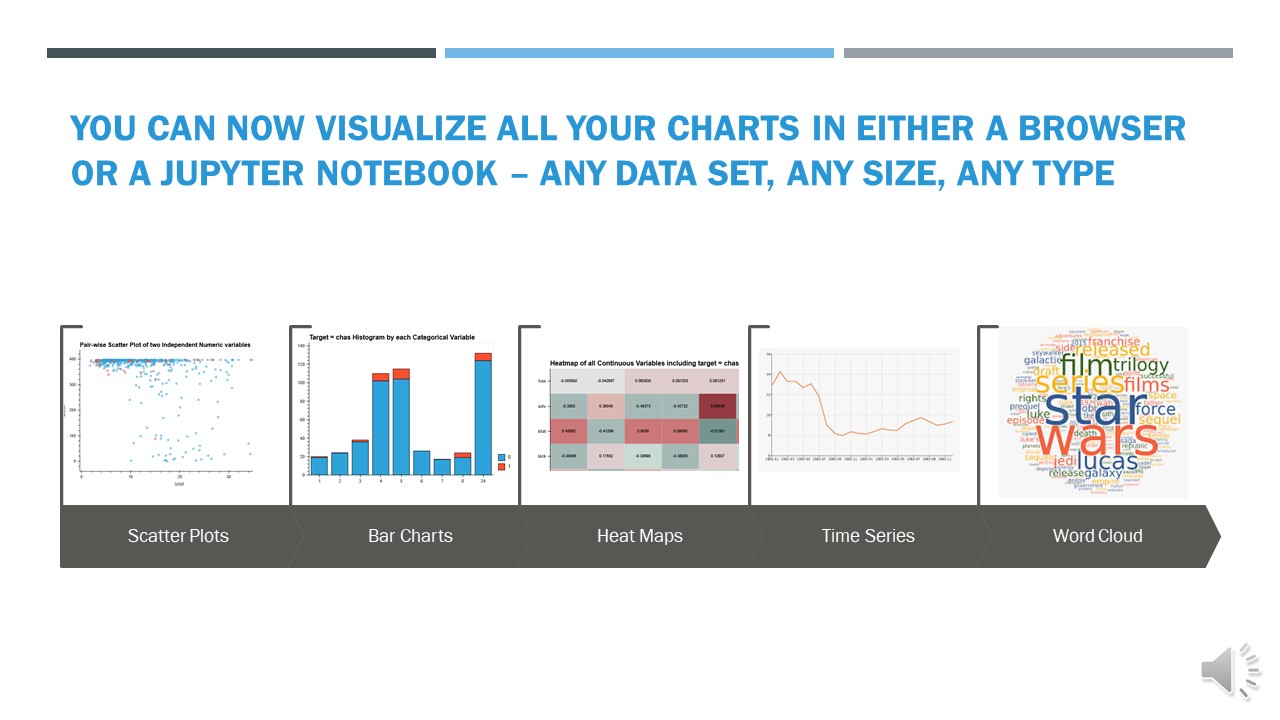
AutoViz
Automatically Visualize any dataset, any size with a single line of code. Created by Ram Seshadri. Collaborators Welcome. Permission Granted upon Request.
- 1.9k
- Python
- Apache-2.0
- 2 y ago

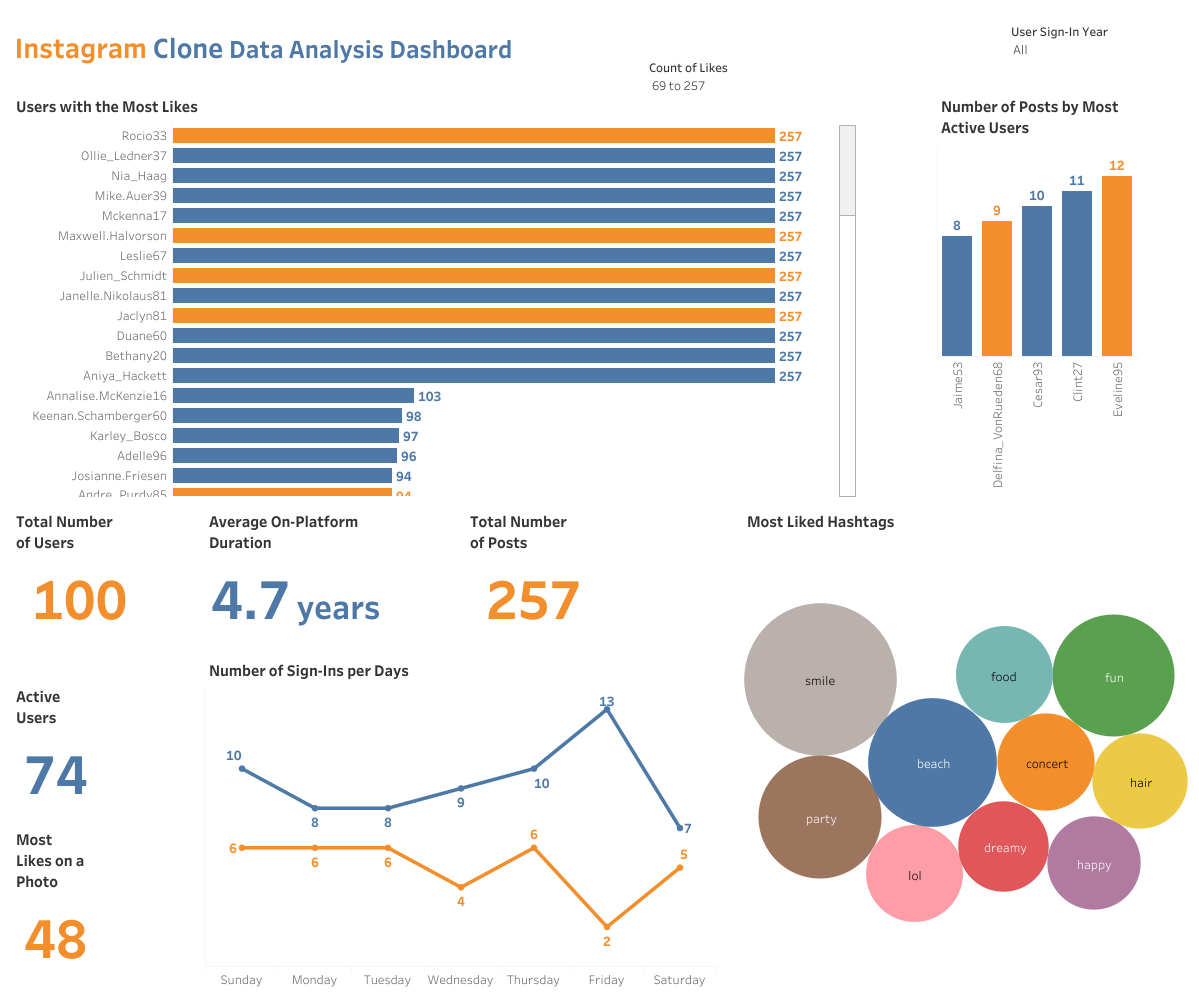
DataAnalystPortfolioProjects
This repository contains my Data Analytics portfolio projects ranging from SQL, Python, Tableau, Excel, and Hadoop (HiveQL).
- 915
- Jupyter Notebook
- 5 y ago

SQL-Data-Analysis-and-Visualization-Projects
SQL data analysis & visualization projects using MySQL, PostgreSQL, SQLite, Tableau, Apache Spark and pySpark.
- 1.8k
- Jupyter Notebook
- MIT
- 4 y ago



Visualis
Visualis is a BI tool for data visualization. It provides financial-grade data visualization capabilities on the basis of data security and permissions, based on the open source project Davinci contributed by CreditEase.
- 270
- TypeScript
- Apache-2.0
- 23 mo ago


MySQL-Tableau-for-Data-Analytics-and-Business-Intelligence
collection of SQL - Tableau integration projects for Data Analytics and Business Intelligence
- 140
- TSQL
- 2 y ago

Netflix-Shows-and-Movies-SQL
Using a combination of Excel, SQL, and Tableau, I delved into the extensive datasets comprising over 82k rows of data from Netflix's shows and movies library. Through data simplification and analysis, I uncovered fascinating insights and intriguing facts about the content available on the platform.
- 125
- 3 y ago

pivot-chart
light and fast implementation of web pivot table / pivot chart components.
- 105
- TypeScript
- MIT
- 3 y ago

tableau-viz-gallery
Gallery-grade dashboard examples and calculations for Tableau Desktop.
- 95
- MIT
- 3 d ago

datapallas
🔥One modern BI and data platform. AI data exploration, dashboards, and pixel-perfect report generation — replacing Qlik, Tableau and Crystal Reports.
- 81
- TypeScript
- 1 d ago

tableau-viz-gallery
Gallery-grade dashboard examples and calculations for Tableau Desktop.
- 93
- MIT
- 3 d ago

Faizs-Data-Portofolio
This documentation is like a quick snapshot of my project in the data field, showing off my skills and know-how in this area.
- 77
- 3 y ago




pygwalker-in-streamlit
build visual exploration app using pygwalker in streamlit
- 60
- Python
- Apache-2.0
- 2 y ago

Supply-Chain-Analytics
This is a supply chain analytics project using Python, Tableau. In which conducted an analysis of supply chain inefficiencies, and developed informative dashboards to inform business stakeholders of potential issues, along with proposing strategic business enhancements.
- 37
- Jupyter Notebook
- 10 mo ago


Data-Analysis-for-Digital-Music-Store
helping Digitial Music Store to optimize their business practices using PostgreSQL
- 28
- 7 y ago


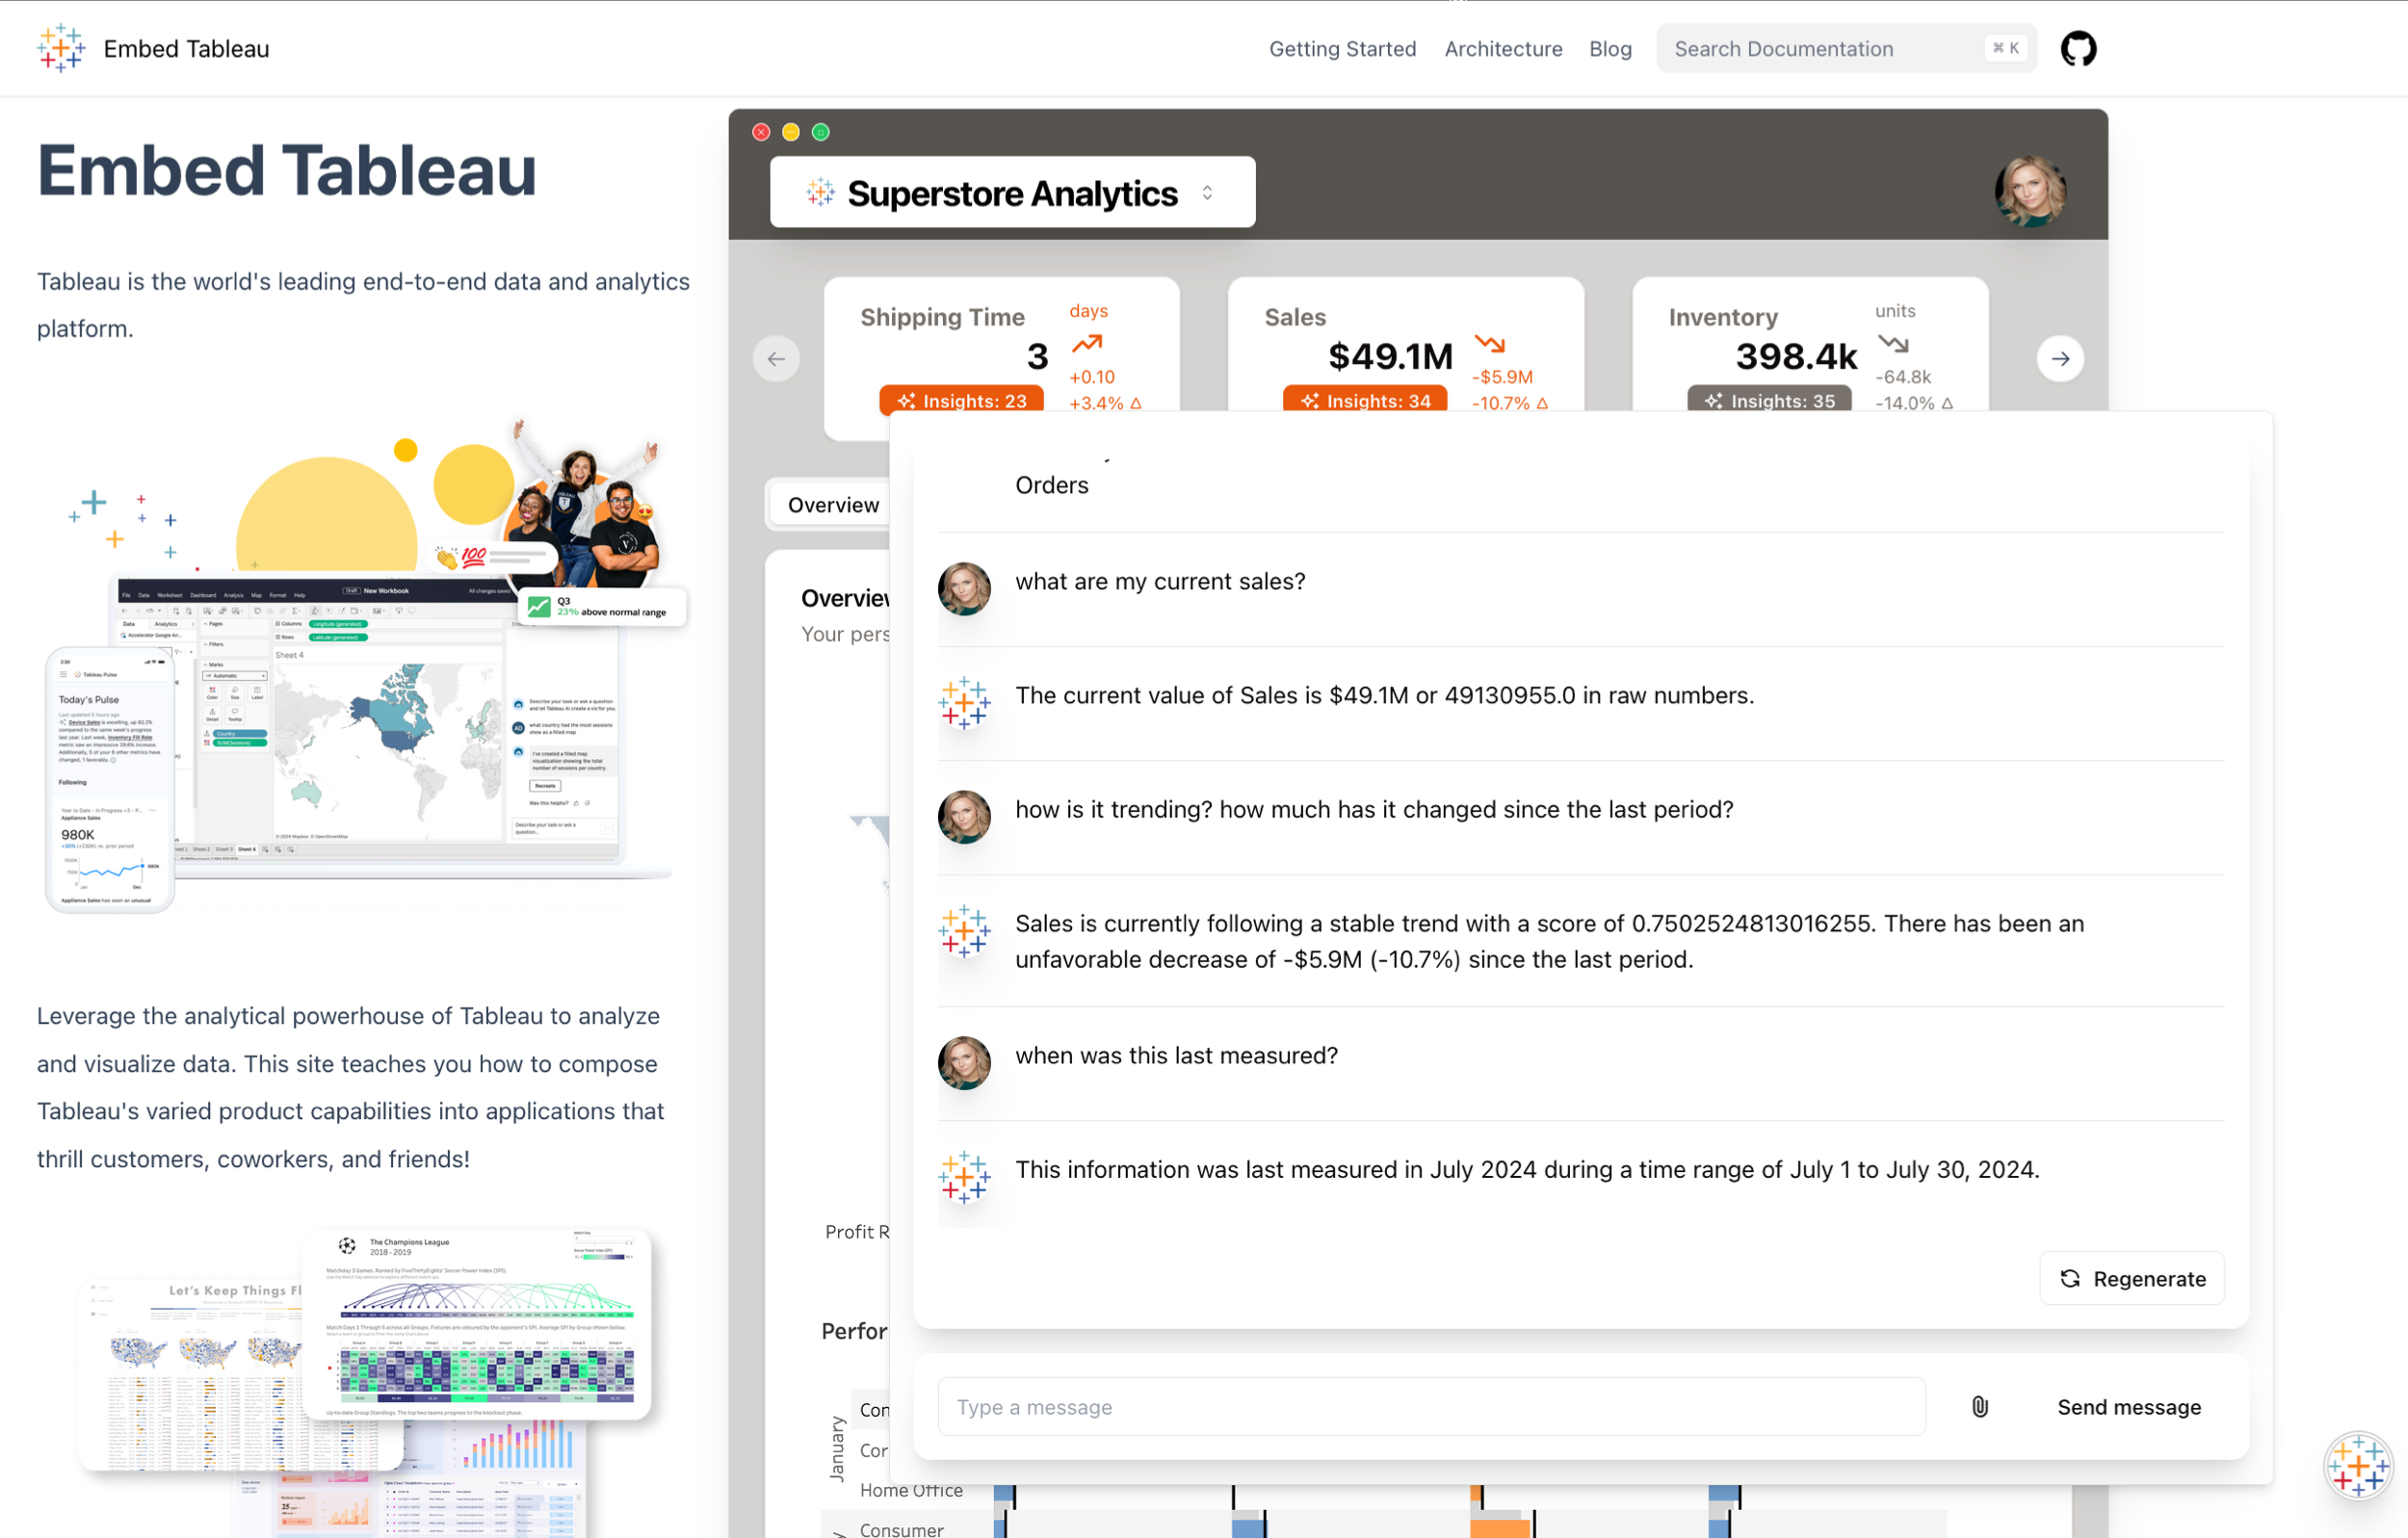
embedding_playbook
This playbook teaches you how to compose Tableau's varied product capabilities into applications that thrill customers, coworkers and friends!
- 23
- JavaScript
- MIT
- 7 h ago


Formula1
Formula1 Grand Prix data analysis with interactive dashboards for the historic data from 1950-2017
- 16
- Jupyter Notebook
- MIT
- 6 y ago

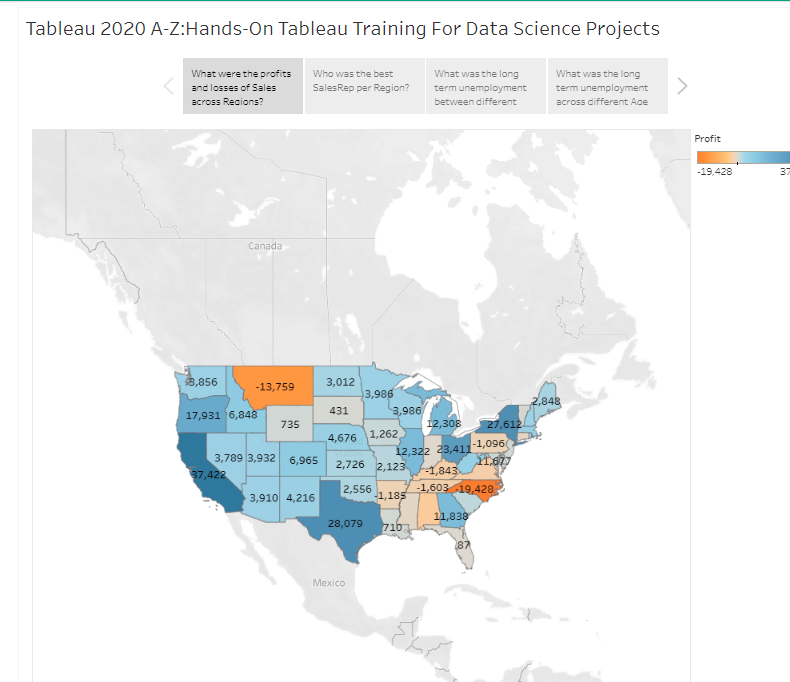
Tableau_2020_A-Z_Hands-On
Tableau Projects for data analysis, data analytics and data visualaization on different data sets
- 16
- MIT
- 6 y ago

vue-graphic-walker
vue componet for graphic walker (tableau alternative)
- 14
- TypeScript
- Apache-2.0
- 3 y ago
ITI-Business-Intelligence-Development
ITI Intensive Code Camp – (Power BI Developer) Specialization
- 15
- Jupyter Notebook
- MIT
- 17 mo ago


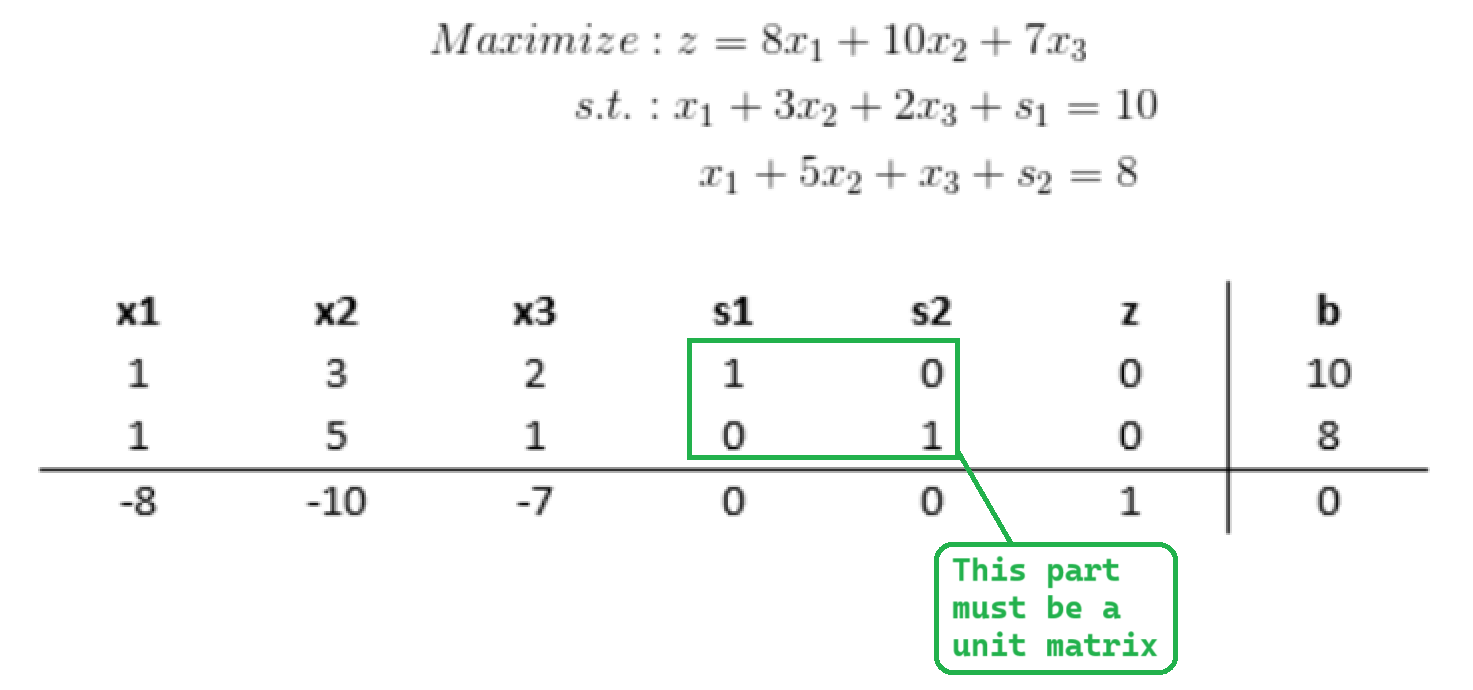
Simplex-Method
📌Simple Method in optimization problem, step by step with C language implementation.
- 12
- C
- 3 y ago


