visualisation


js-code-to-svg-flowchart
js2flowchart - a visualization library to convert any JavaScript code into beautiful SVG flowchart. Learn other’s code. Design your code. Refactor code. Document code. Explain code.
- 7.1k
- JavaScript
- MIT
- 3 y ago

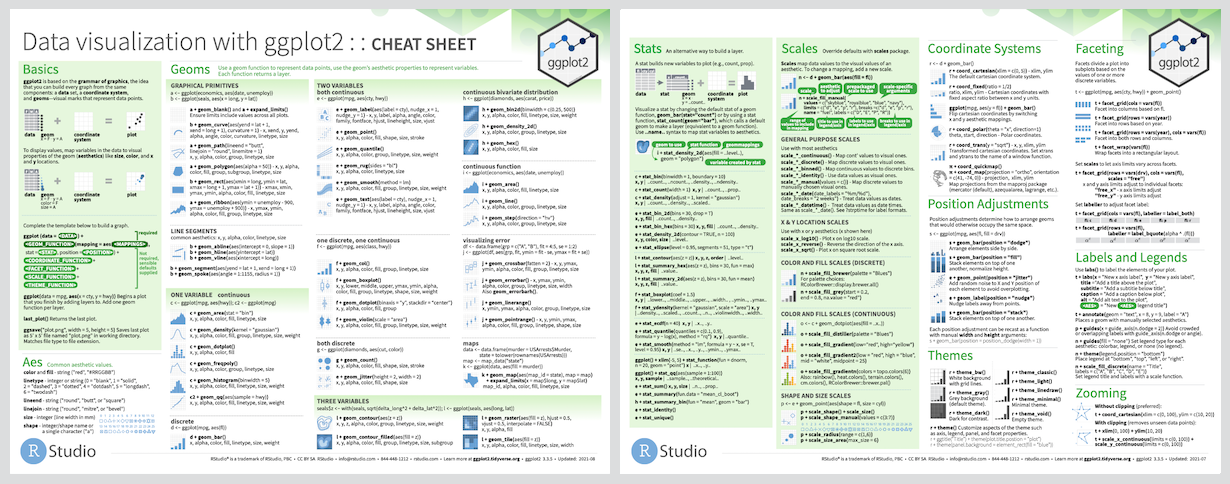

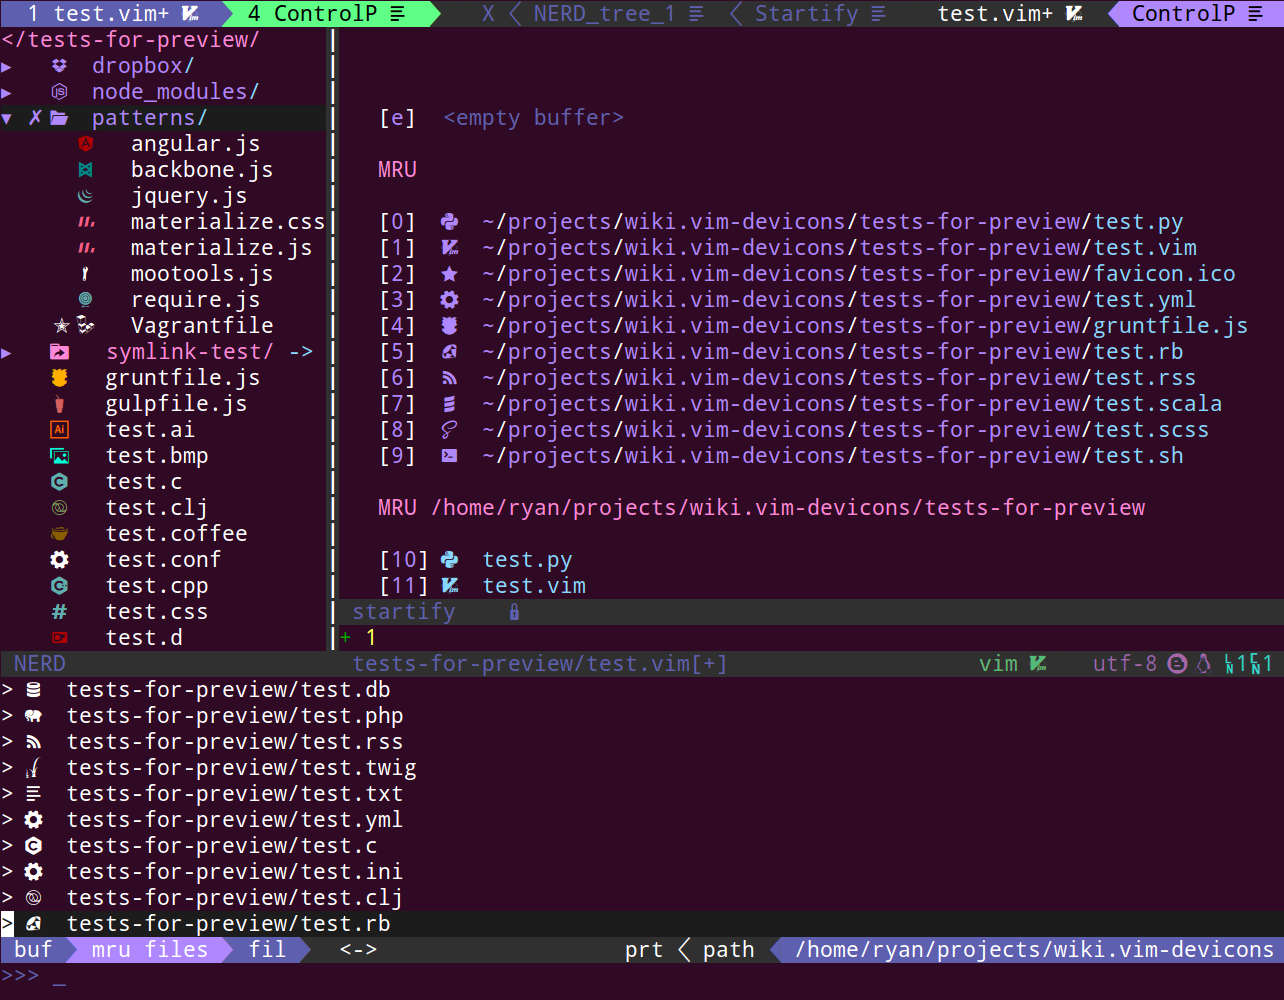
vim-devicons
Adds file type icons to Vim plugins such as: NERDTree, vim-airline, CtrlP, unite, Denite, lightline, vim-startify and many more
- 5.8k
- Vim Script
- MIT
- 3 y ago


Neural-Network-Architecture-Diagrams
Diagrams for visualizing neural network architecture
- 1.2k
- MIT
- 20 mo ago


iris
A powerful, format-agnostic, and community-driven Python package for analysing and visualising Earth science data
- 730
- Python
- BSD-3-Clause
- 12 d ago


plotlars
Plotlars is a Rust library designed to facilitate the integration between the Polars data analysis library and Plotly library.
- 675
- Rust
- MIT
- 6 wk ago


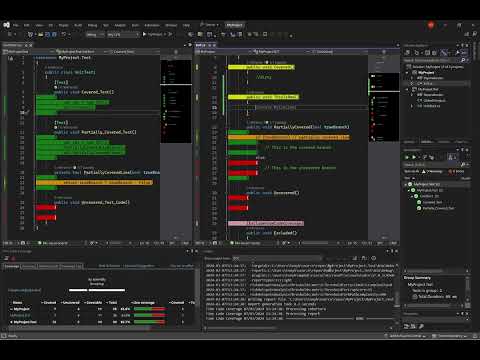
FineCodeCoverage
Visualize unit test code coverage easily for free in Visual Studio Community Edition (and other editions too)
- 607
- C#
- 18 mo ago

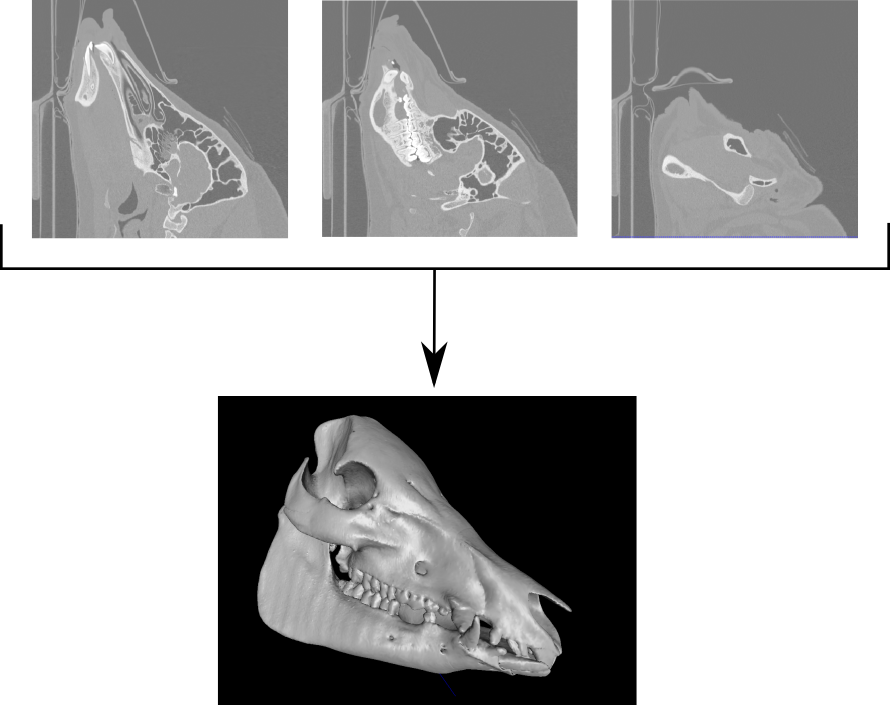
DicomToMesh
A command line tool to transform a DICOM volume into a 3d surface mesh (obj, stl or ply). Several mesh processing routines can be enabled, such as mesh reduction, smoothing or cleaning. Works on Linux, OSX and Windows.
- 533
- C++
- MIT
- 8 mo ago

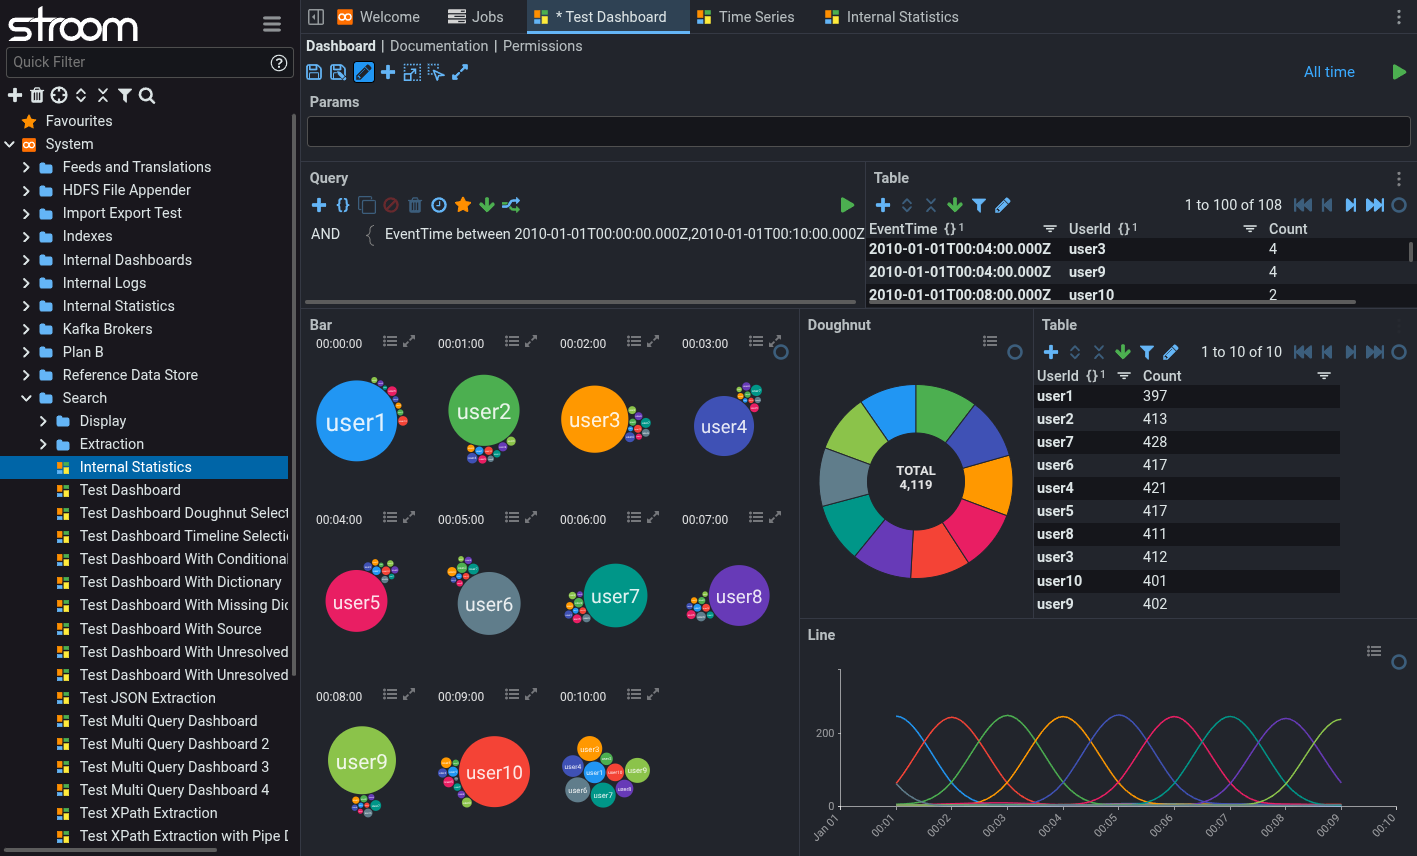
stroom
Stroom is a highly scalable data storage, processing and analysis platform.
- 490
- Java
- Apache-2.0
- 23 h ago

rpd
:ok_hand: A Minimal Engine for creating Node-Based Visual Programming User Interfaces
- 452
- JavaScript
- 19 mo ago

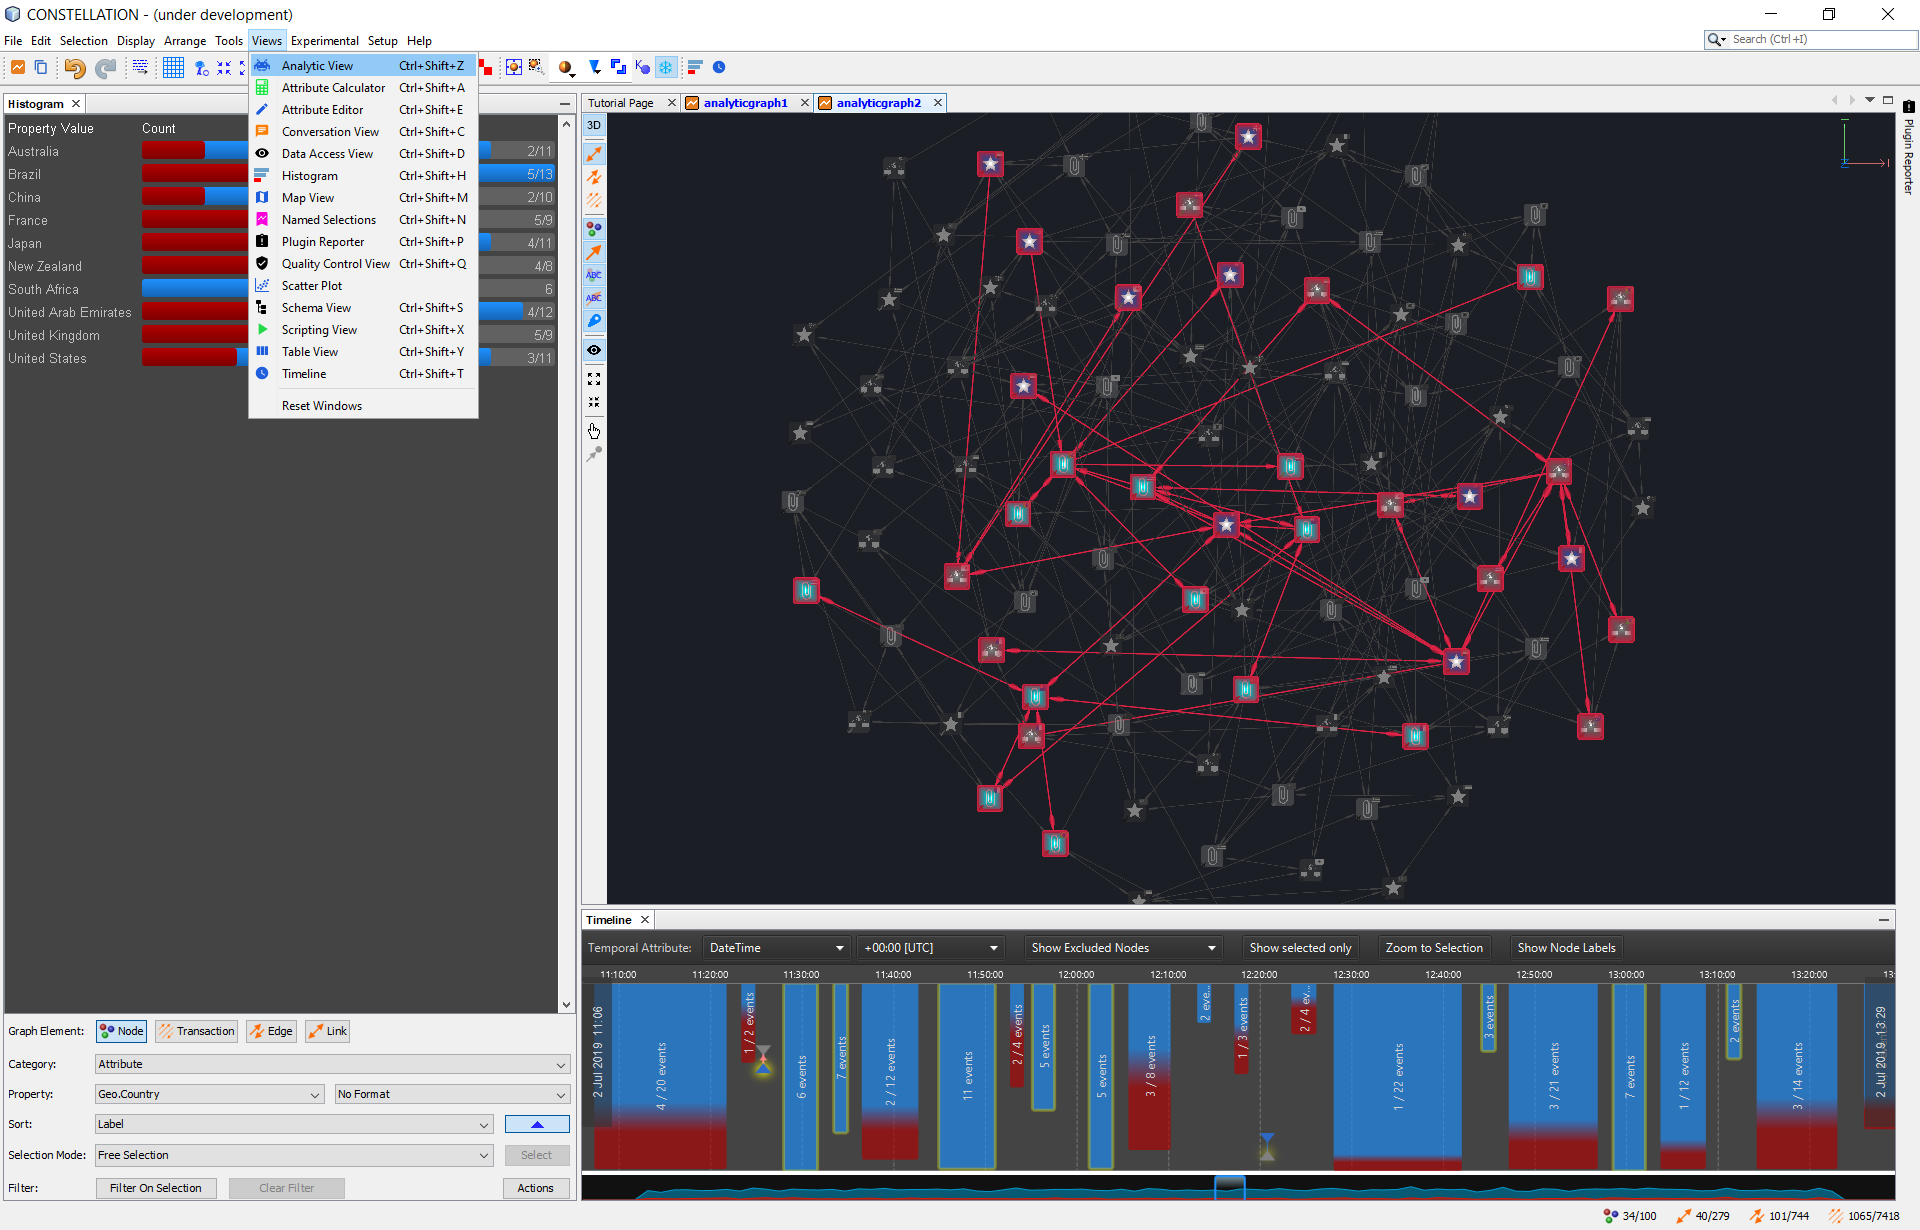
constellation
A graph-focused data visualisation and interactive analysis application.
- 424
- Java
- Apache-2.0
- 1 d ago


blobtools
Modular command-line solution for visualisation, quality control and taxonomic partitioning of genome datasets
- 219
- Python
- GPL-3.0
- 2 y ago


pycobra
python library implementing ensemble methods for regression, classification and visualisation tools including Voronoi tesselations.
- 130
- Python
- MIT
- 7 y ago






Algorithm-Visualizer
👾 📊 React App to Visualise Algorithms. Includes sorting, pathfinding and convexhull visualizer.
- 38
- JavaScript
- MIT
- 6 y ago

matrix-visualiser
This is a project to visualise and evaluate matrix transformations / expressions involving 2x2 matricies, 2D vectors, and floats, such as multiplication, inversing, scaling, addition, determinant, dot product and more.
- 31
- Rust
- 4 mo ago


Praaline
Praaline is an open-source system to manage, annotate, visualise and analyse spoken language corpora
- 30
- C
- GPL-3.0
- 4 y ago

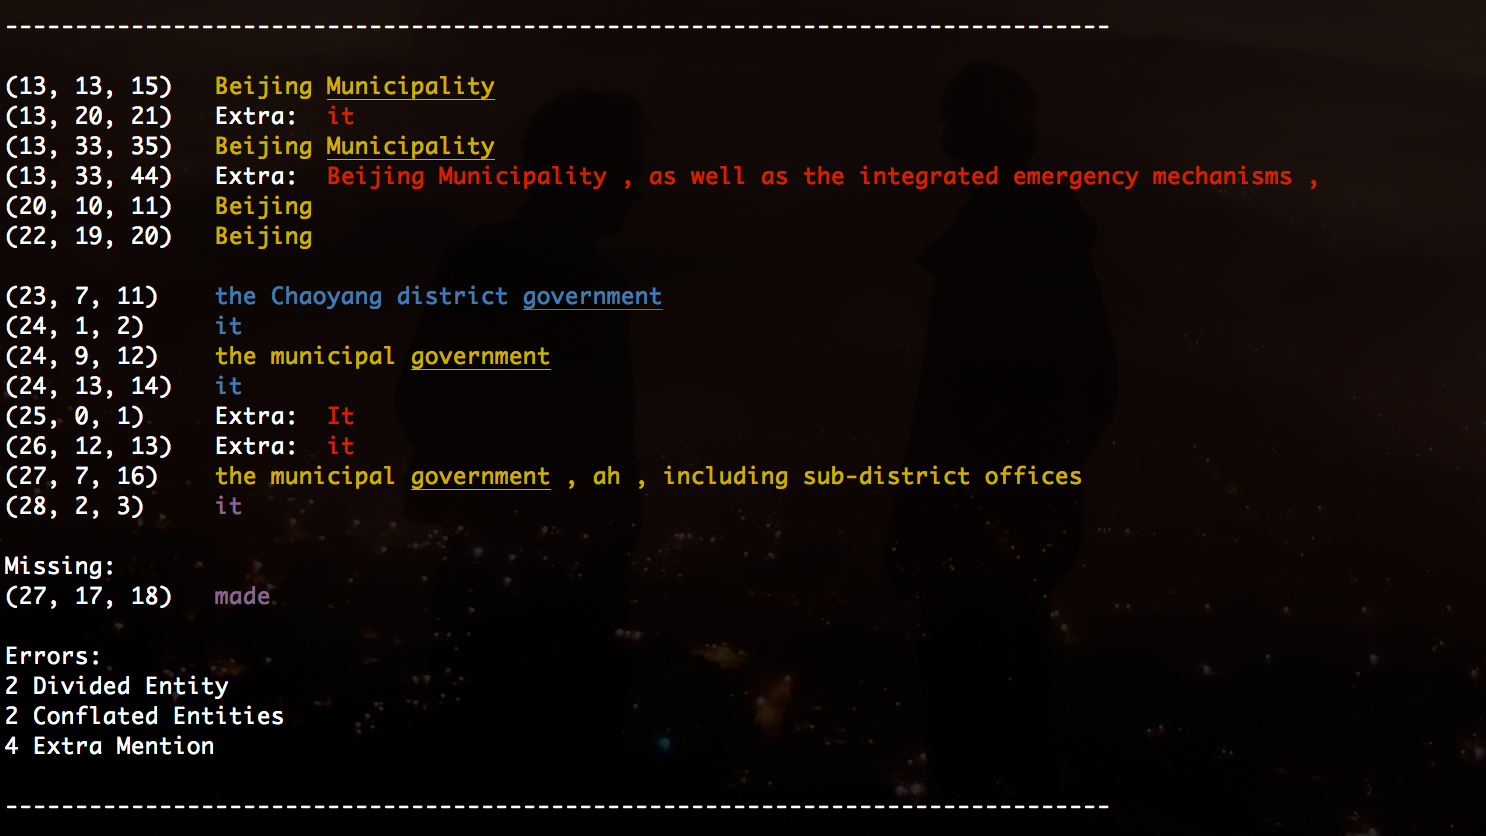
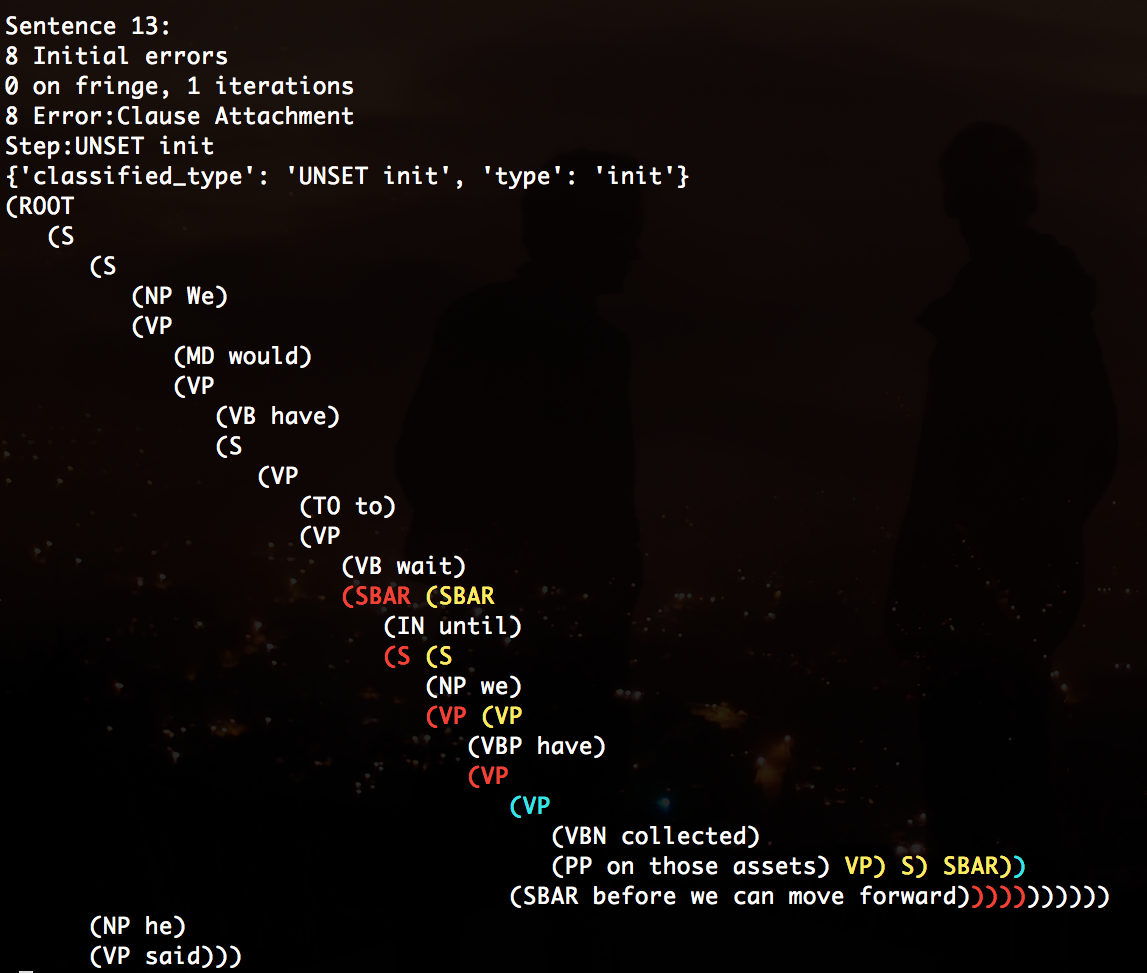
berkeley-coreference-analyser
A tool for classifying errors in coreference resolution
- 29
- Python
- ISC
- 3 y ago

Visualising-LSTM-Activations
Visualising what each LSTM cell learns from data.
- 24
- Jupyter Notebook
- 7 y ago

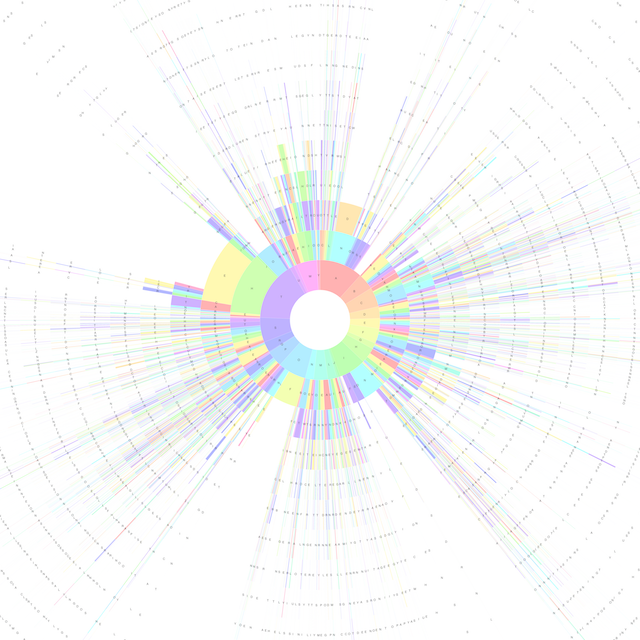
wordvis
This is a Python script to generate Sunburst Charts that visualise the structure of English words.
- 16
- Python
- MIT
- 8 y ago

stroom-visualisations-dev
A set of D3 data visualisations for use in Stroom dashboards or other applications
- 14
- JavaScript
- 3 d ago
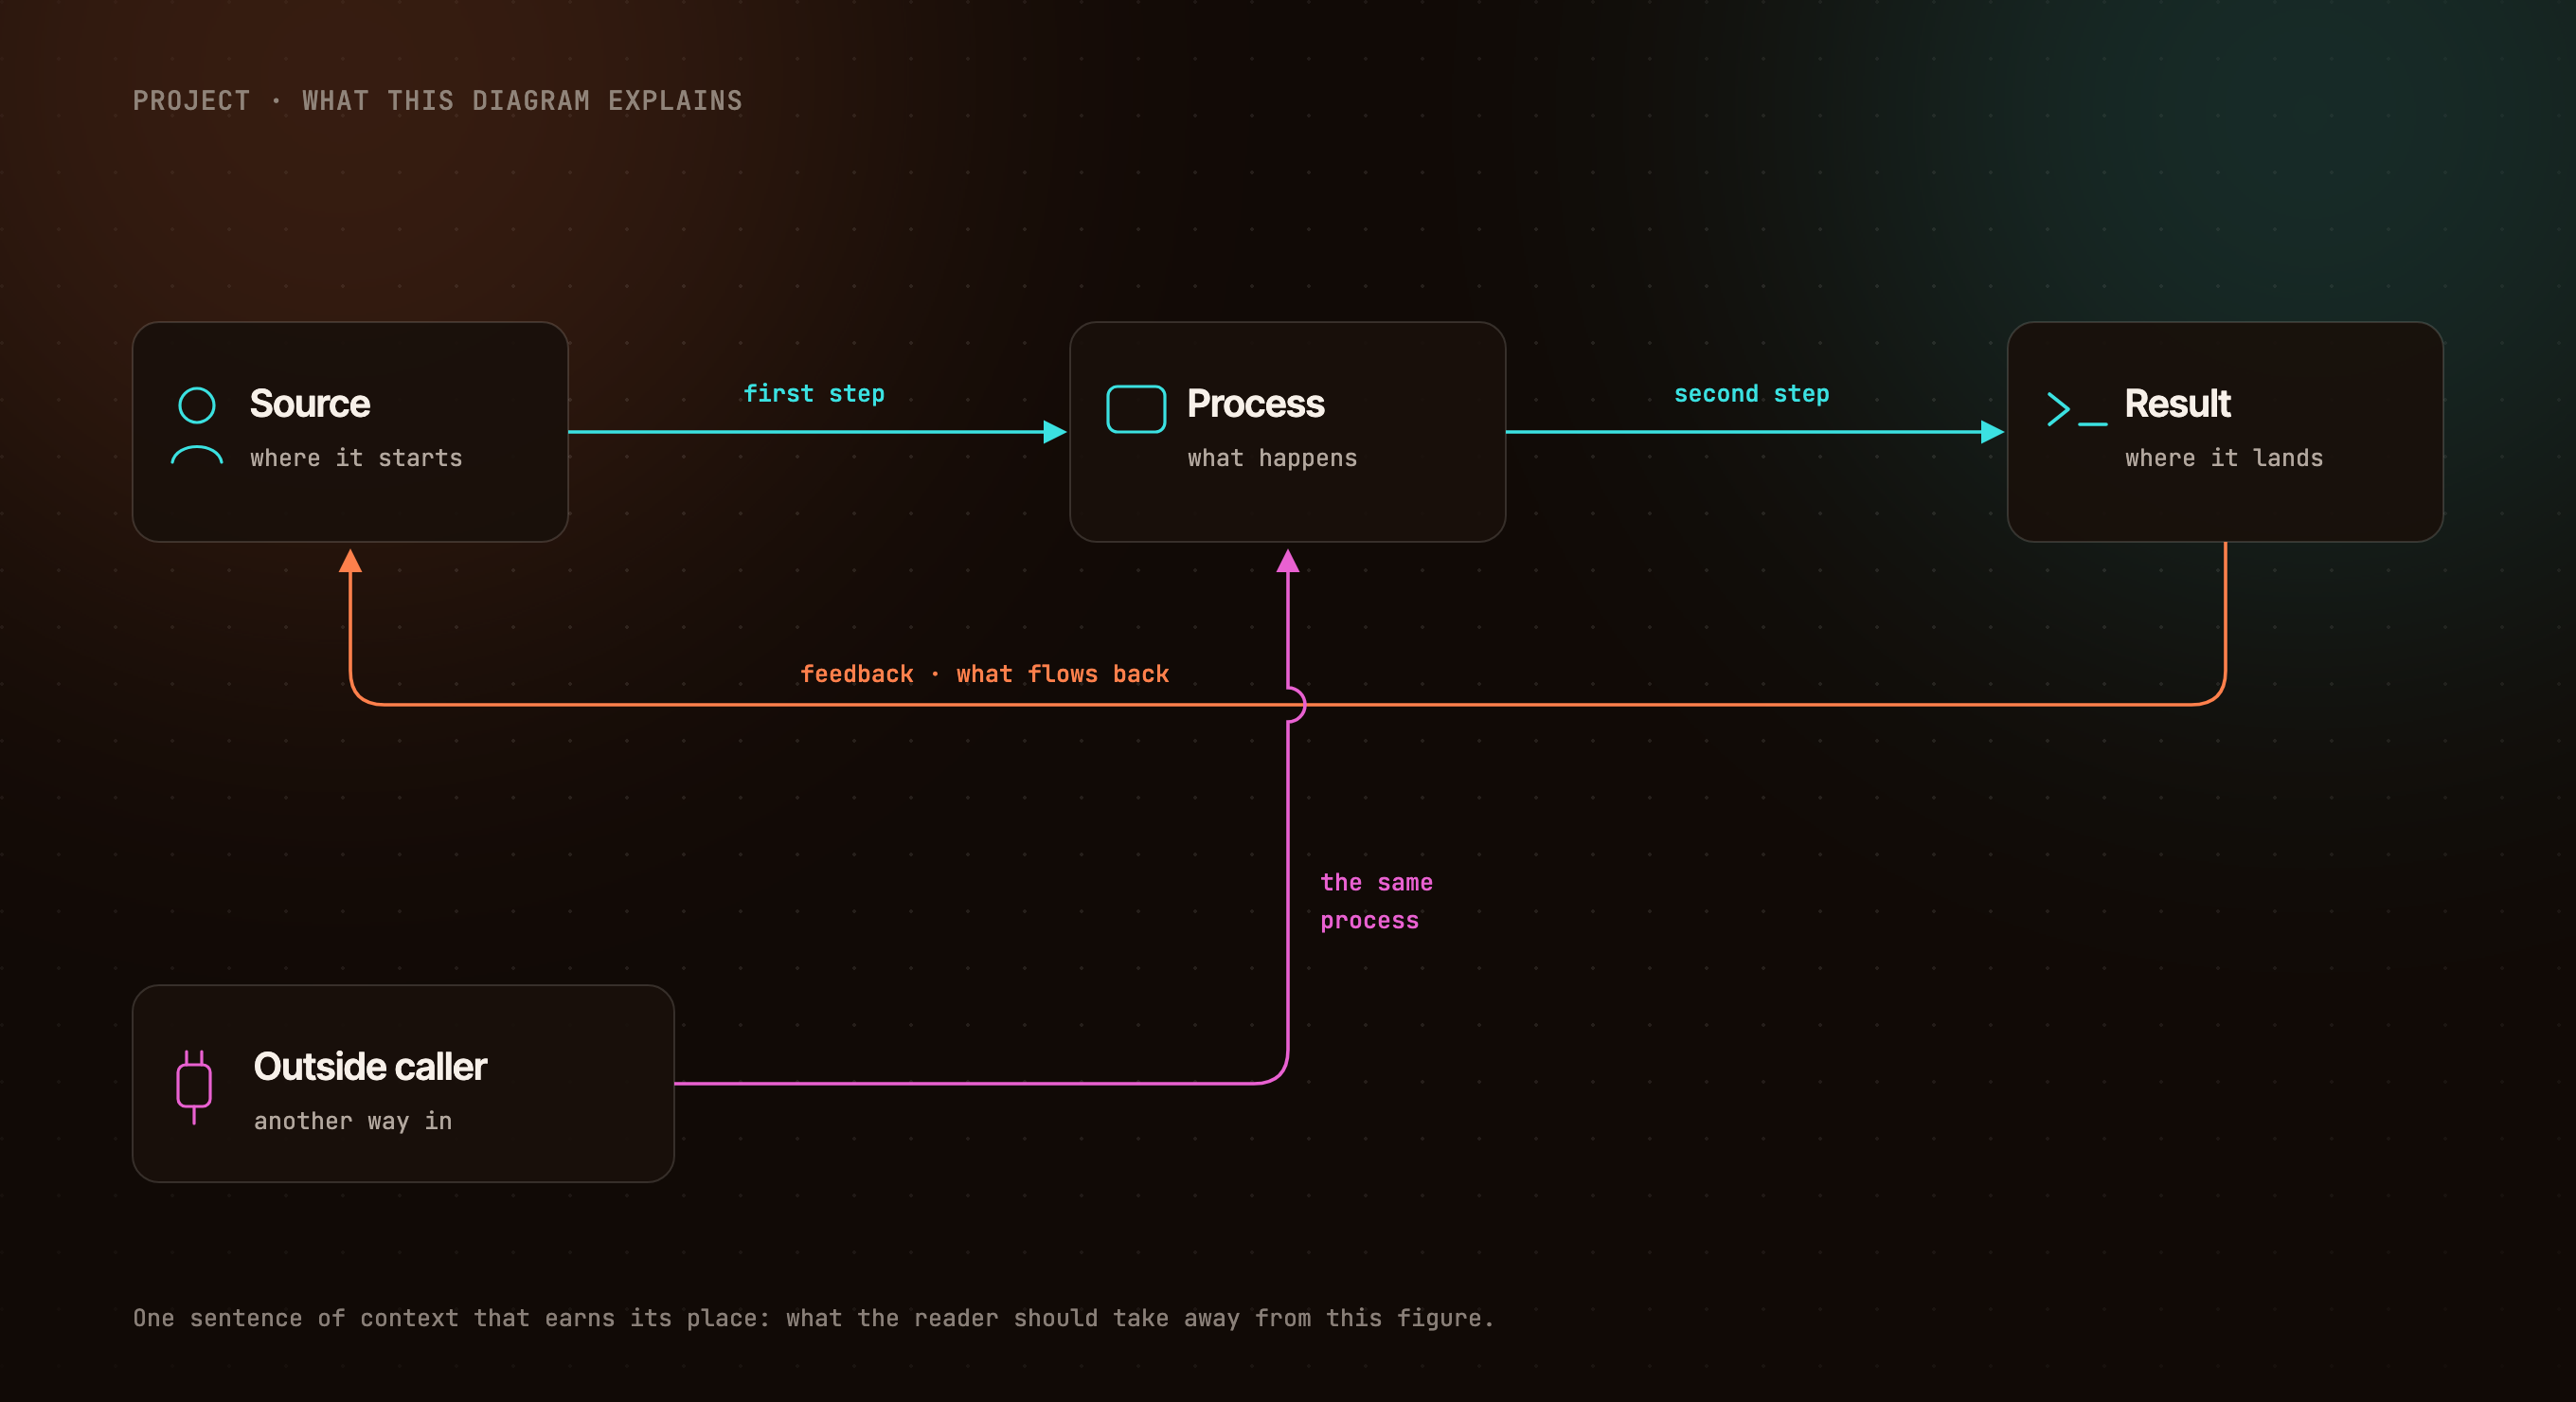
render-visual-skill
An agent-skill & plugin to render programmable visuals (images & animations) for Claude Code, Cursor, Copilot, Codex & others
- 11
- JavaScript
- MIT
- 3 mo ago
