sugartrail
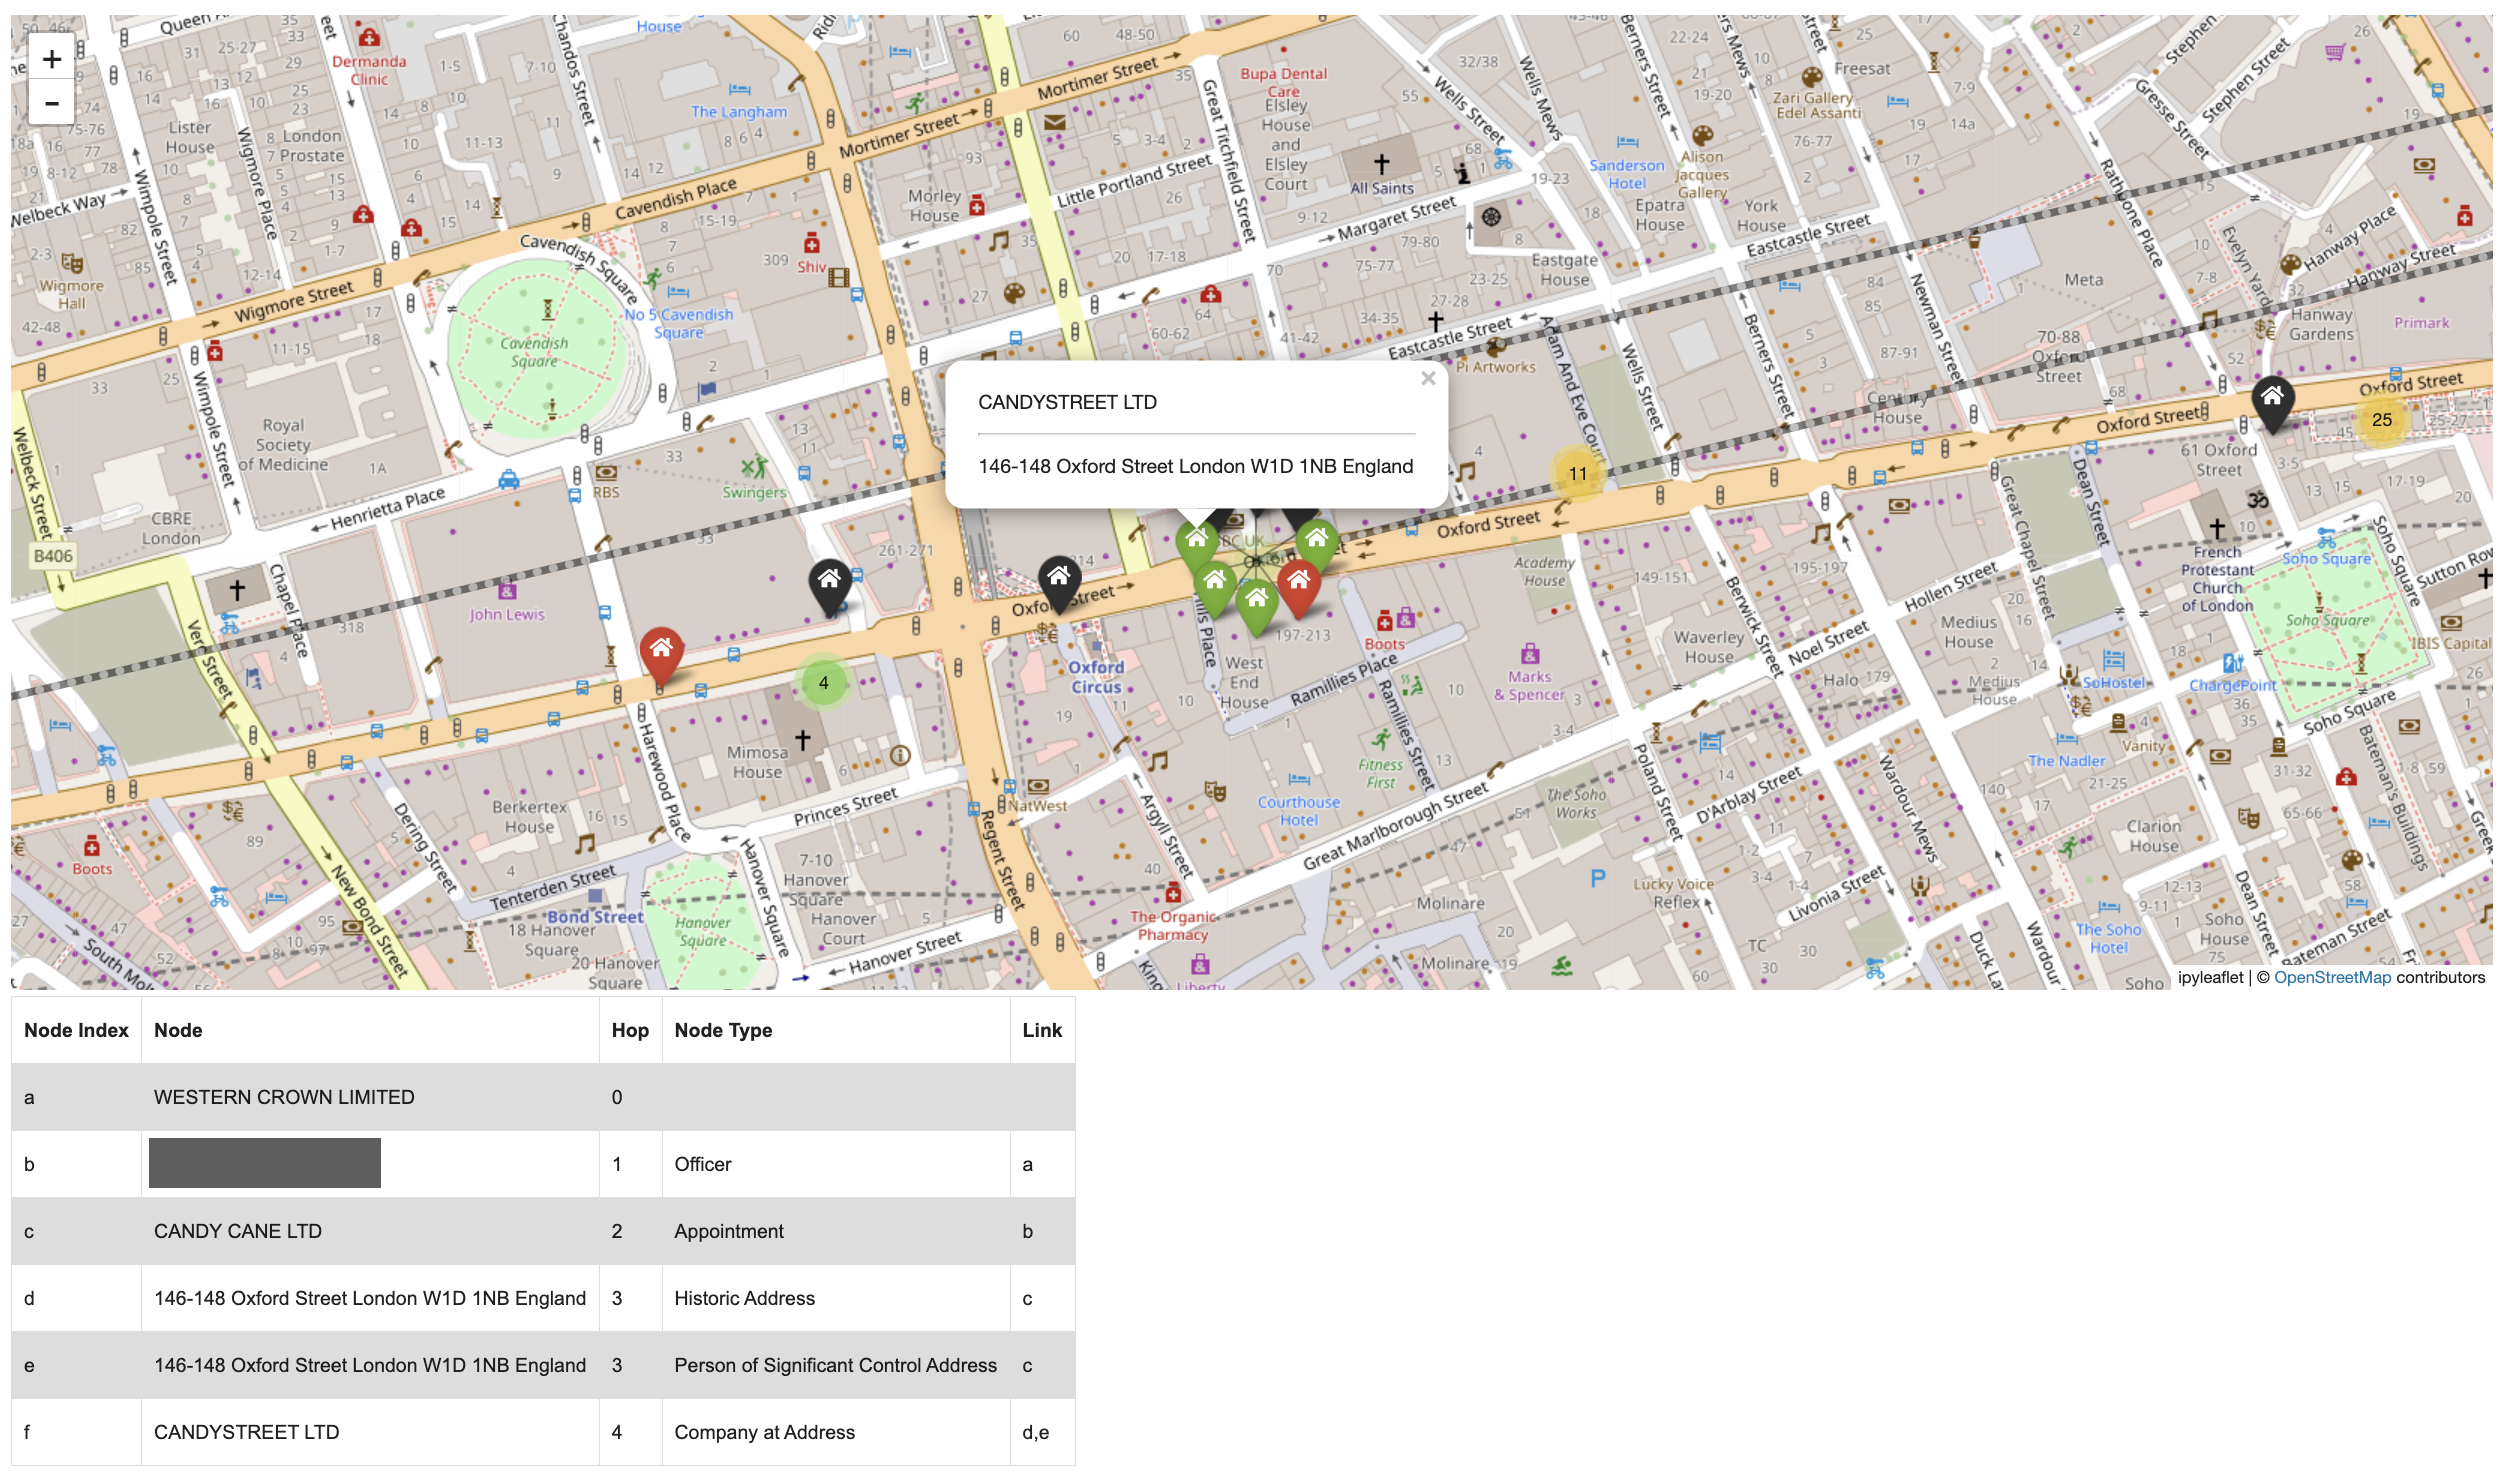
Visualise networks of companies, officers and addresses connected through UK Companies House
- 81
- HTML
- MIT
- 9 mo ago
Visualise networks of companies, officers and addresses connected through UK Companies House
Covid Tweets Analysis, final report as deployed Jupyter notebook, interactive notebook using Plotly and Jupyter widgets
This repo contains demo code for all the libraries discussed in the Analytics Vidya Article. Link for the same:
Gallery of applications built using bqplot and widget libraries like ipywidgets, ipydatagrid etc.
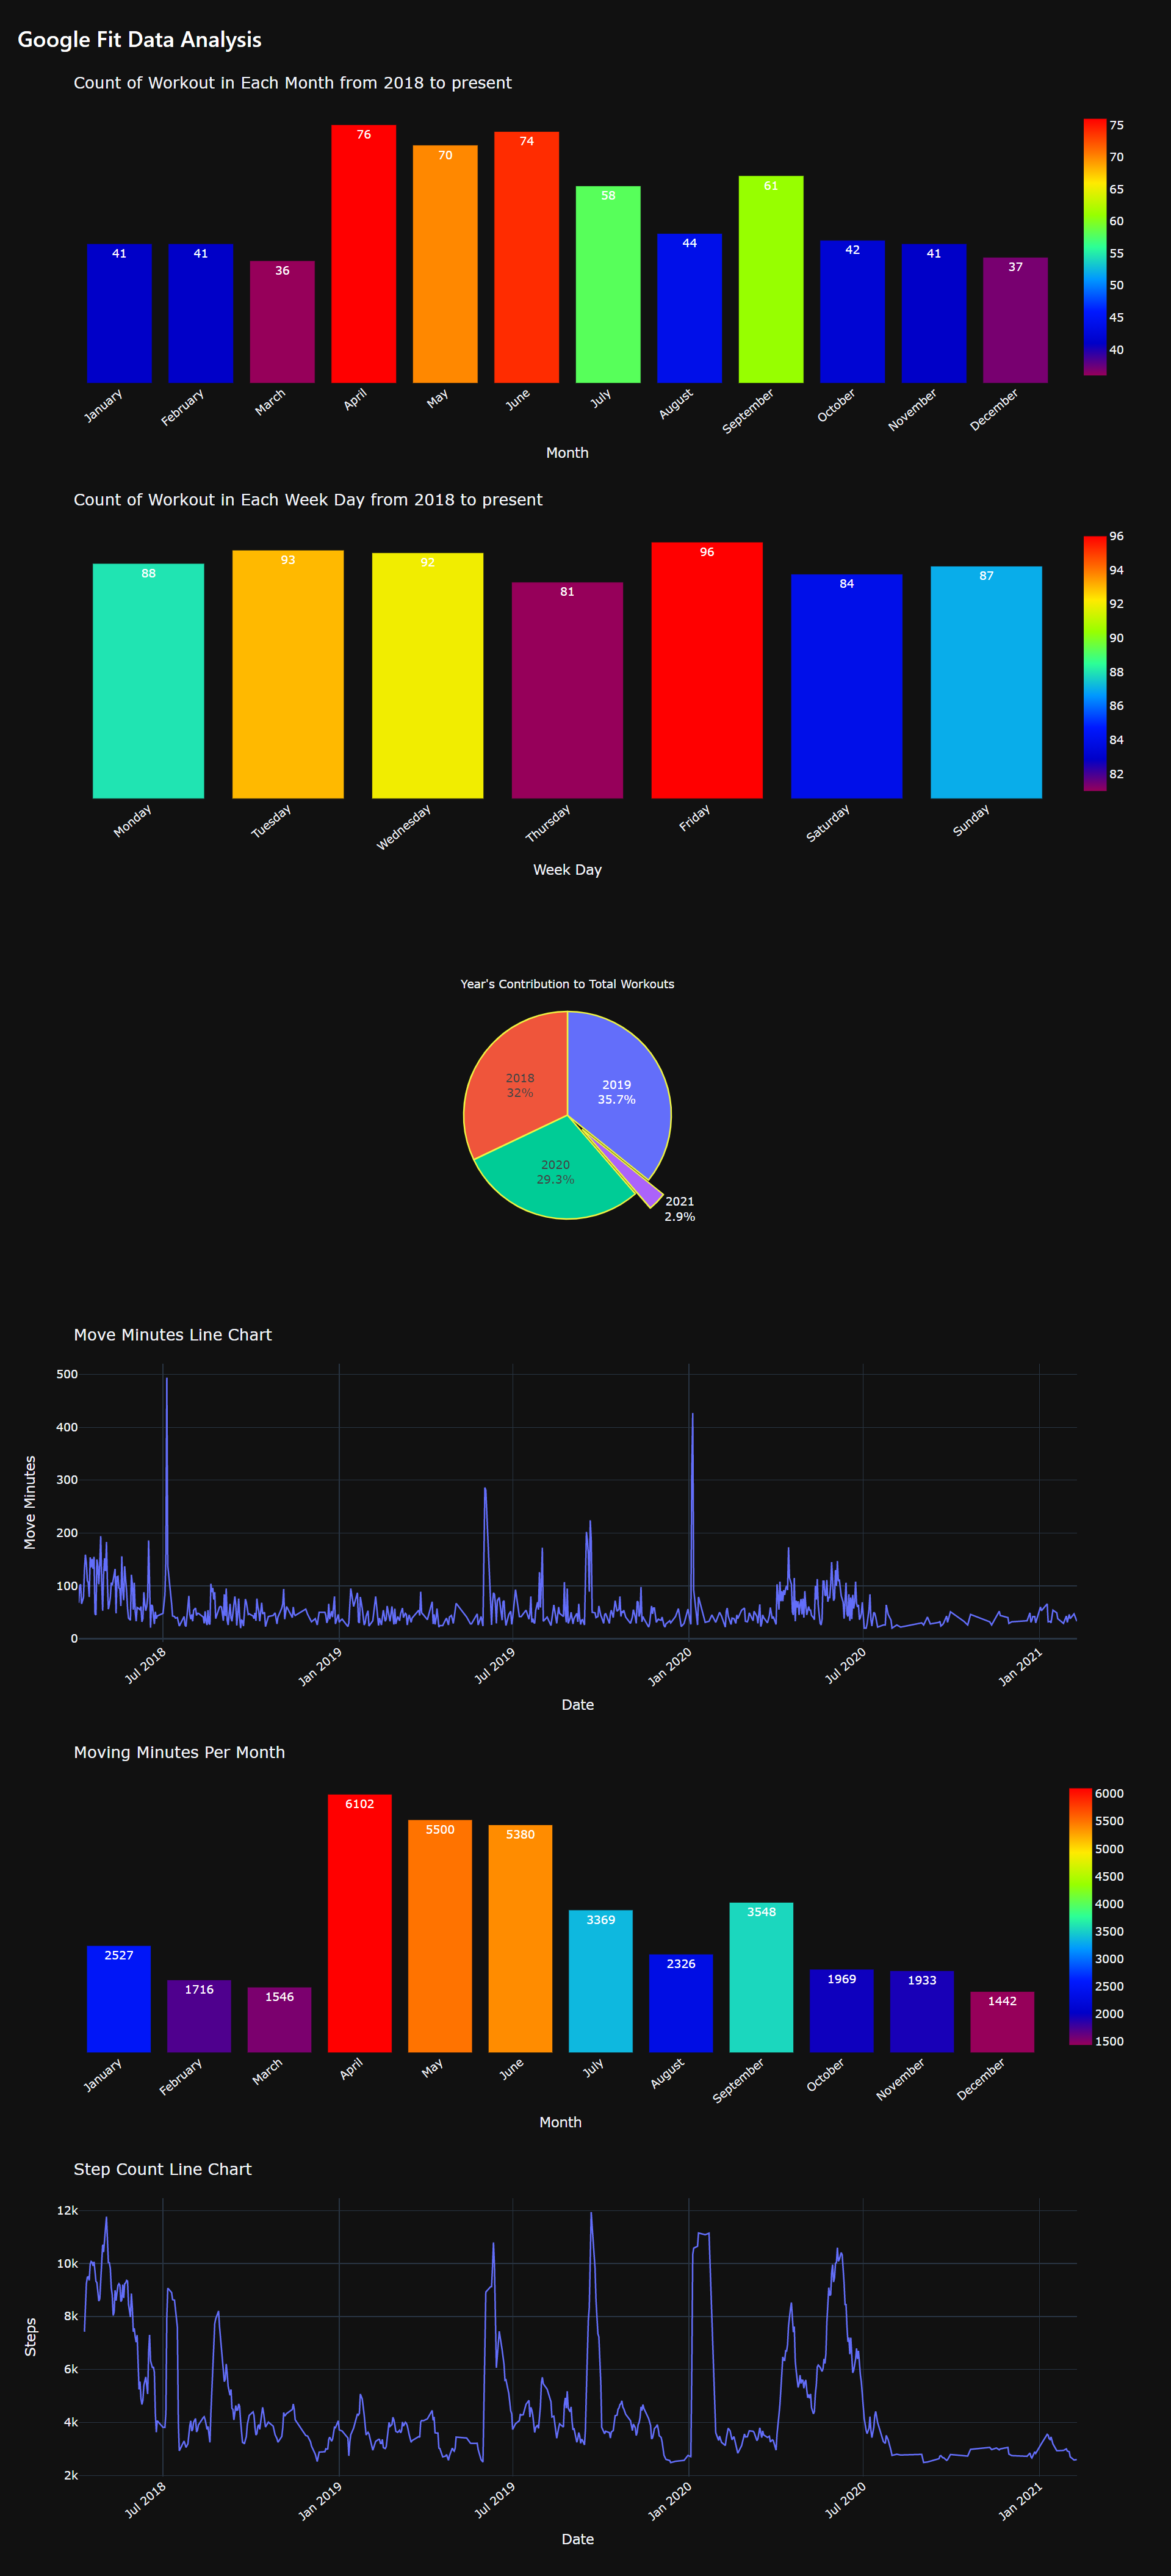
This is the notebook code and the dataset for the Google Fit Analysis I did for Analytics Vidhya Blog.
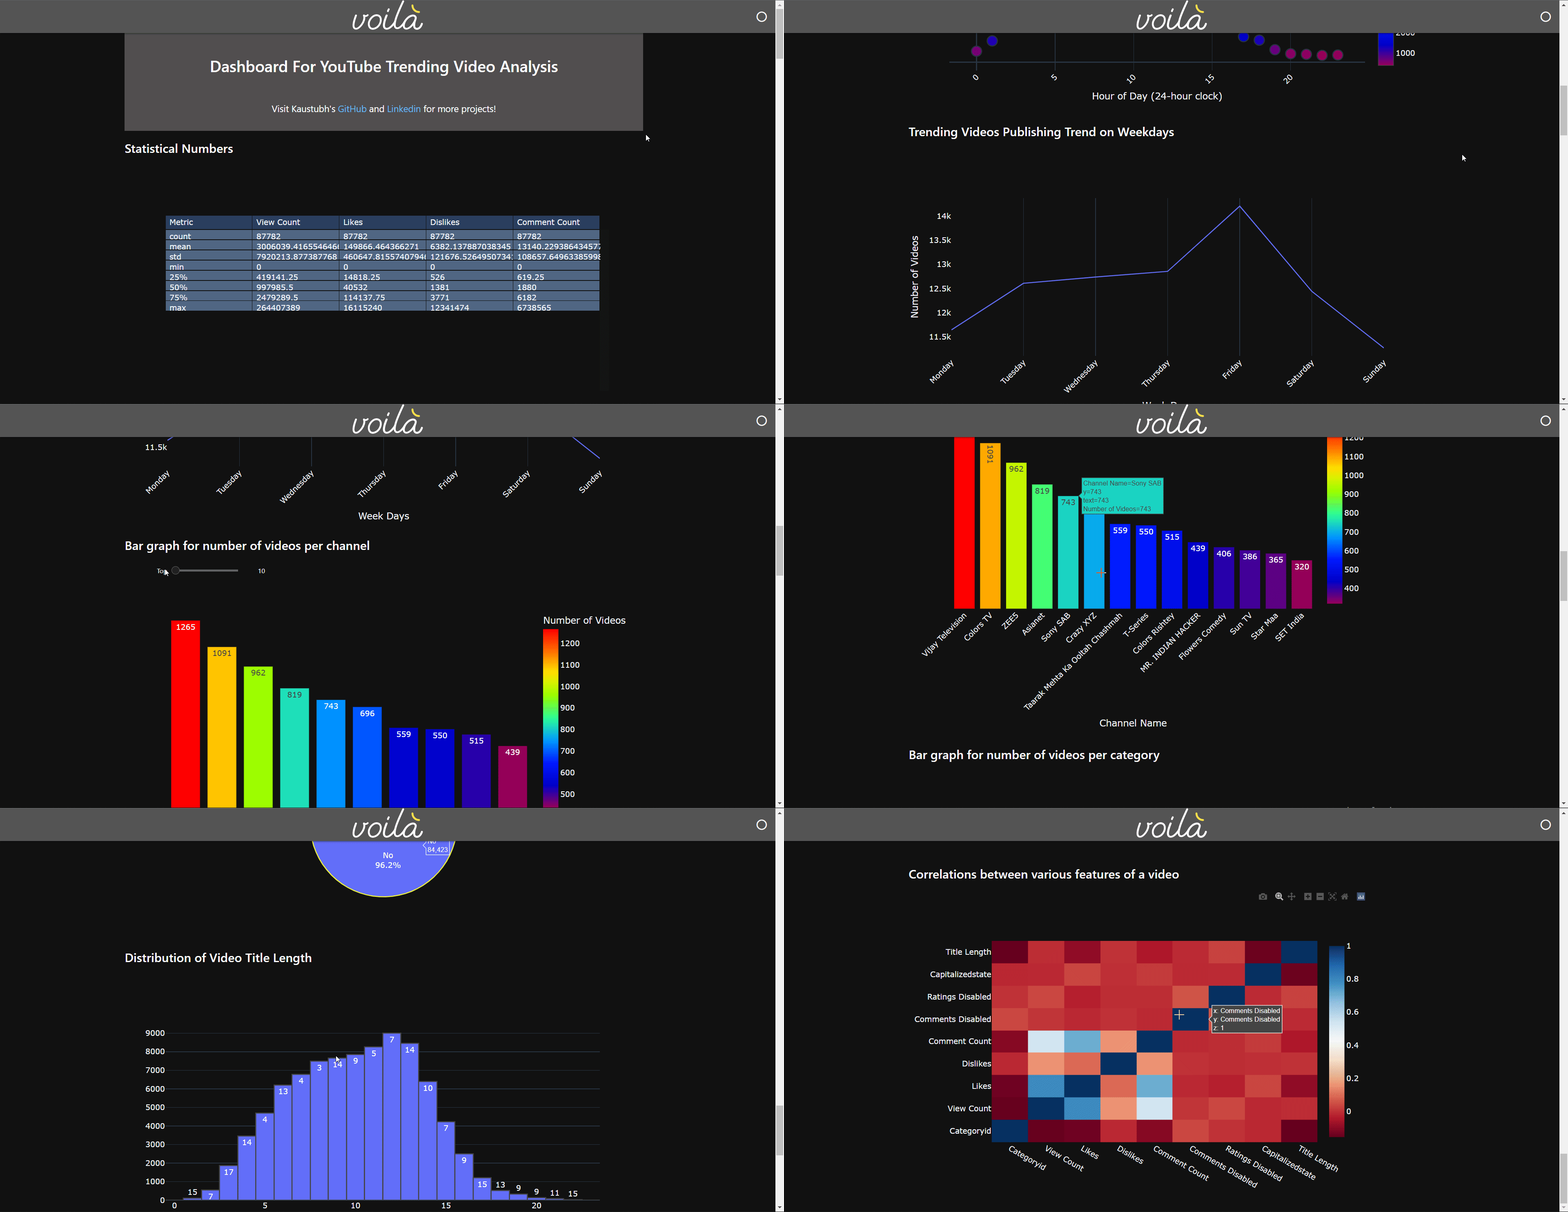
Trending section analysis of YouTube India
Bear Classification app based on Viola, NB widgets and binder
San Diego COVID-19 Dashboard on Kubernetes in the Google Cloud