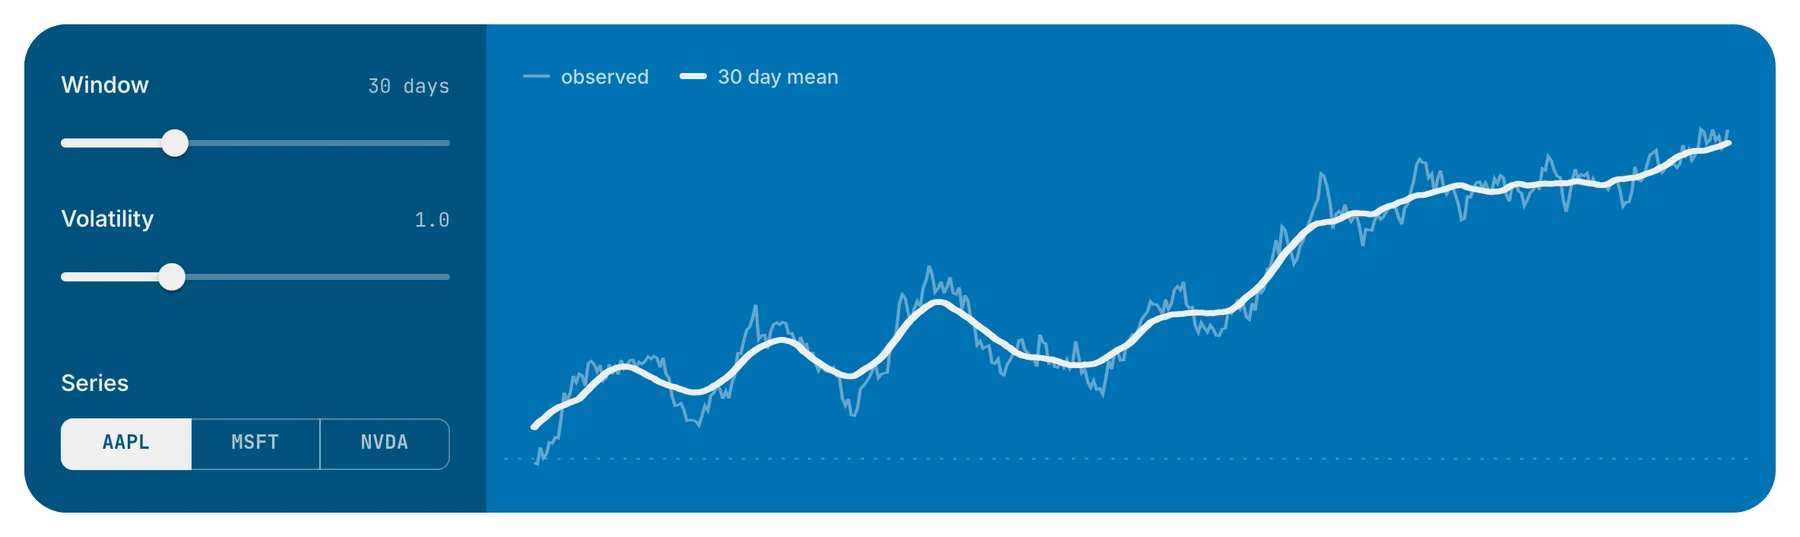
visualization-curriculum
A data visualization curriculum of interactive notebooks.
- 1.4k
- Jupyter Notebook
- BSD-3-Clause
- 6 mo ago
A data visualization curriculum of interactive notebooks.
Apache Superset is a Data Visualization and Data Exploration Platform
12 weeks, 26 lessons, 52 quizzes, classic Machine Learning for all
Bring data to life with SVG, Canvas and HTML. :bar_chart::chart_with_upwards_trend::tada:
Present your data as an effective and compelling story
Panel: The powerful data exploration & web app framework for Python
The 30 Days of Python programming challenge is a step-by-step guide to learn the Python programming language in 30 days. This challenge may take more than 100 days. Follow your own pace. These videos may help too: https://www.youtube.com/channel/UC7PNRuno1rzYPb1xLa4yktw
Full-stack observability · Metrics · Logs · Traces · Flows · Topology · Infrastructure · APM · NPM · DBM · RUM · Synthetics · Cloud · AI SRE · OpenTelemetry · SNMP · NetFlow/IPFIX/sFlow · IPMI · Redfish · 2000+ integrations
Lineage metadata API, artifacts streams, sandbox, API, and spaces for Polyaxon
⭐AI-driven public opinion & trend monitor with multi-platform aggregation, RSS, and smart alerts.🎯 告别信息过载,你的 AI 舆情监控助手与热点筛选工具!聚合多平台热点 + RSS 订阅,支持关键词精准筛选。AI 智能筛选新闻 + AI 翻译 + AI 分析简报直推手机,也支持接入 MCP 架构,赋能 AI 自然语言对话分析、情感洞察与趋势预测等。支持 Docker ,数据本地/云端自持。集成微信/飞书/钉钉/Telegram/邮件/ntfy/bark/slack 等渠道智能推送。
| Name | Stars | License | Language | Last change | In common | Compare |
|---|---|---|---|---|---|---|
| javedali99/python-data-visualization | 61 | GPL-3.0 | Jupyter Notebook | 23 mo ago | ||
| uwdata/visualization-curriculum | 1.4k | BSD-3-Clause | Jupyter Notebook | 6 mo ago | altair | Compare |
| bokeh/bokeh | 20k | BSD-3-Clause | TypeScript | 20 h ago | bokeh, visualization | Compare |
| apache/superset | 76k | Apache-2.0 | Python | 11 h ago | data-analysis, data-science, data-visualization | Compare |
| microsoft/ML-For-Beginners | 92k | MIT | Jupyter Notebook | 13 d ago | data-science | Compare |
| d3/d3 | 114k | ISC | Shell | 2 wk ago | data-visualization, visualization | Compare |
| TrainingByPackt/Interactive-Data-Visualization-with-Python | 116 | MIT | Jupyter Notebook | 7 y ago | altair, seaborn | Compare |
| holoviz/panel | 5.8k | BSD-3-Clause | Python | 12 h ago | bokeh, matplotlib, plotly | Compare |
| scikit-learn/scikit-learn | 68k | BSD-3-Clause | Python | 7 h ago | data-analysis, data-science | Compare |
| Asabeneh/30-Days-Of-Python | 79k | None declared | Python | 7 wk ago | data-science, matplotlib, python3 | Compare |
| netdata/netdata | 81k | GPL-3.0 | Go | 6 h ago | data-visualization | Compare |
| polyaxon/haupt | 452 | AGPL-3.0 | Python | 12 h ago | bokeh, data-science, data-visualization | Compare |
| sansan0/TrendRadar | 64k | GPL-3.0 | Python | 4 d ago | data-analysis | Compare |