practical-python-data-viz-guide
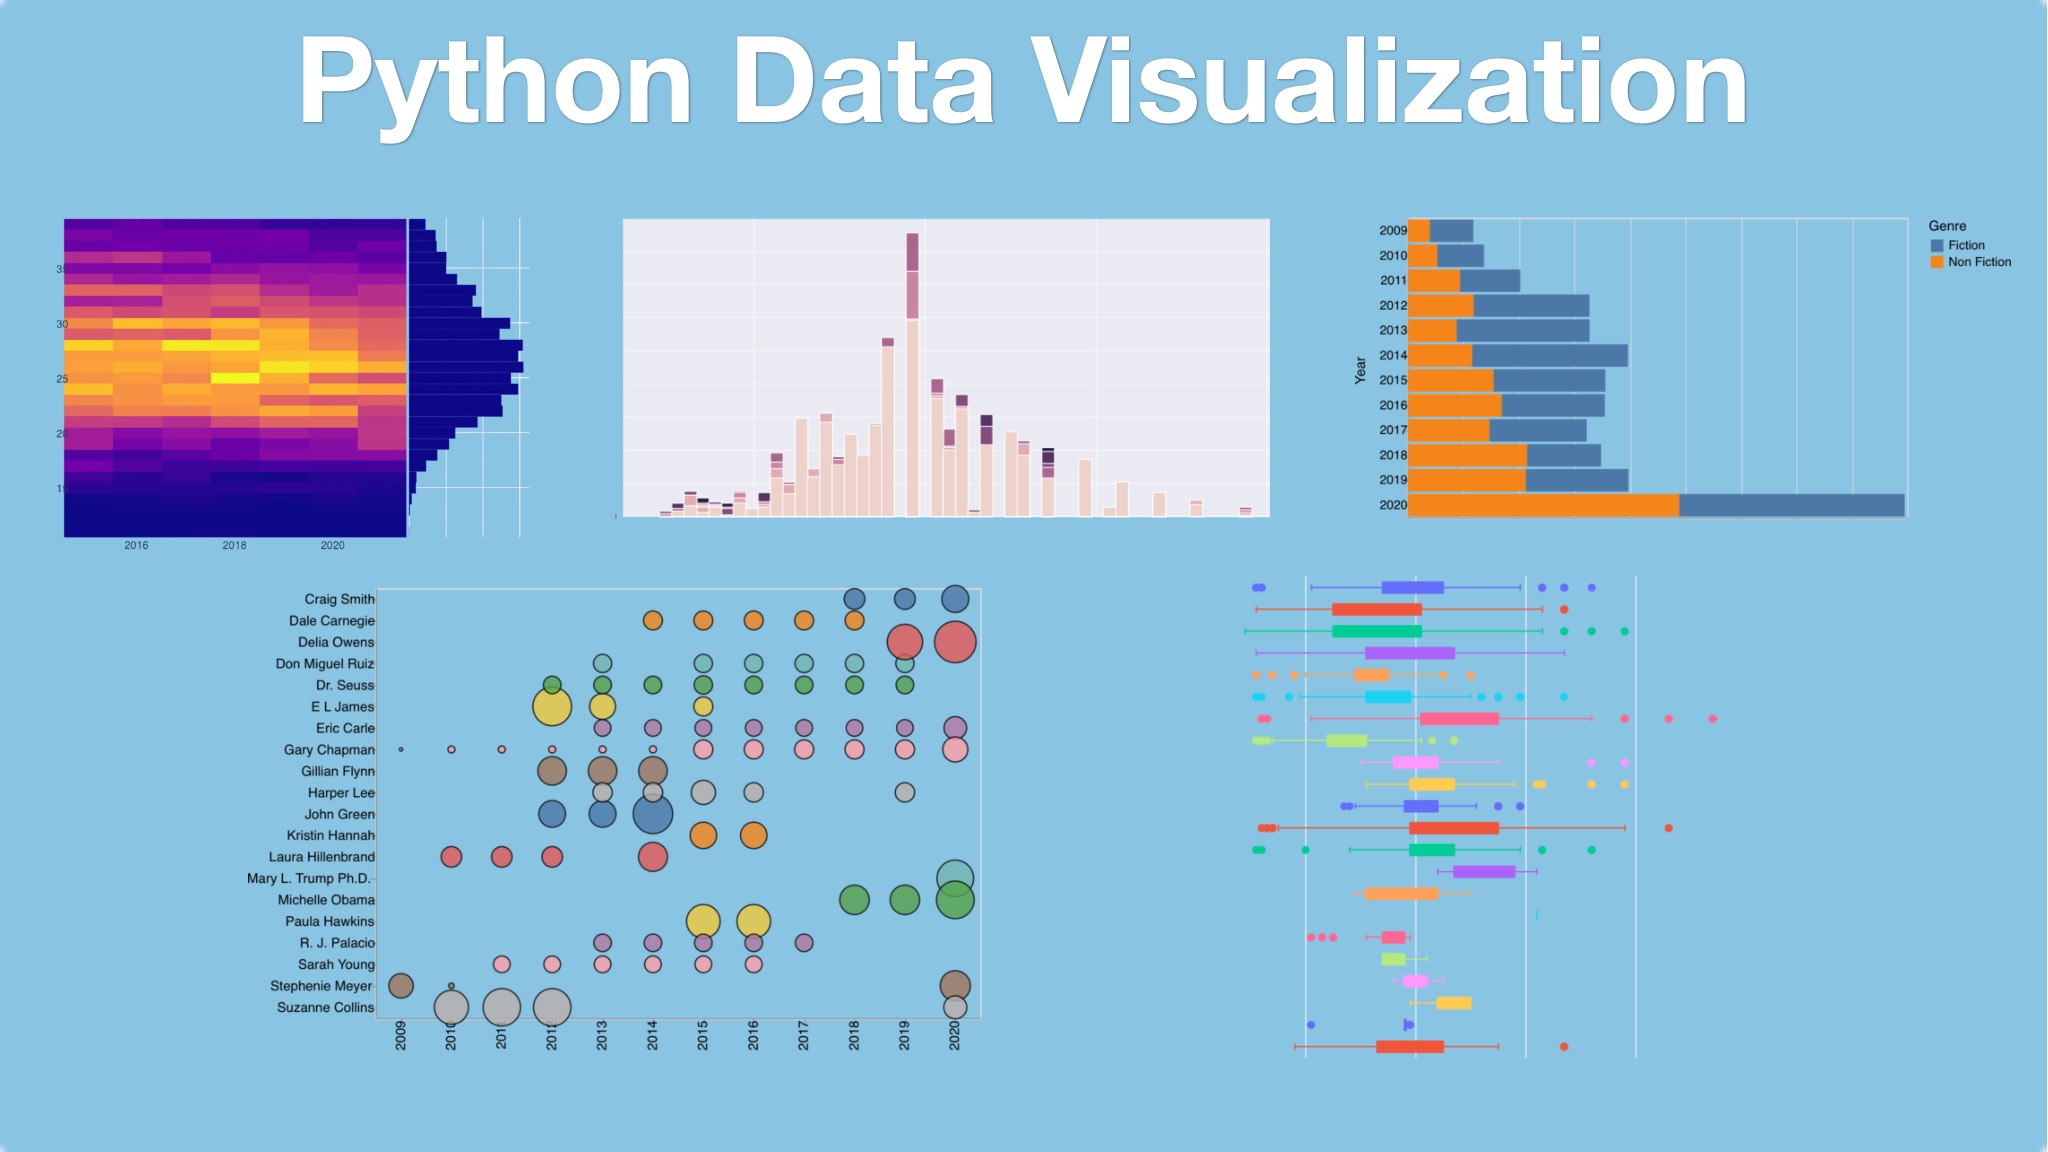
Resources for teaching & learning practical data visualization with python.
- 111
- Jupyter Notebook
- MIT
- 21 mo ago
Resources for teaching & learning practical data visualization with python.
Present your data as an effective and compelling story
A data visualization curriculum of interactive notebooks.
Curated Python Notebooks for Amazing Data Visualization
Python Data Visualization course code and examples
AI-powered plotting gallery. One spec, 15 libraries across Python, JavaScript, R and Julia — matplotlib, plotly, ggplot2, D3, Makie & more. Compare and copy working code, or adapt a plot to your own data with an AI agent.
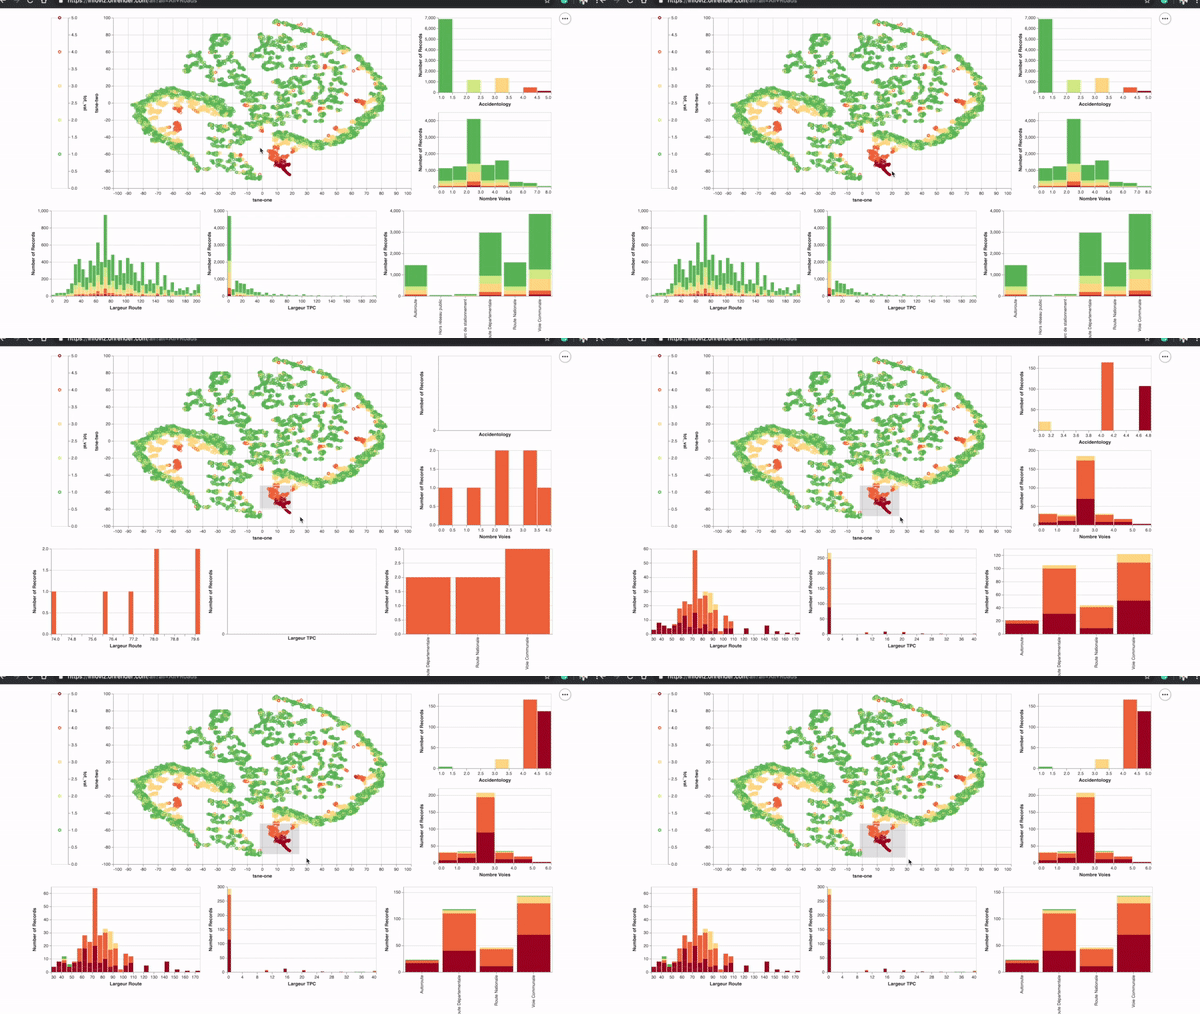
A Data Visualization project on the French traffic accidents database
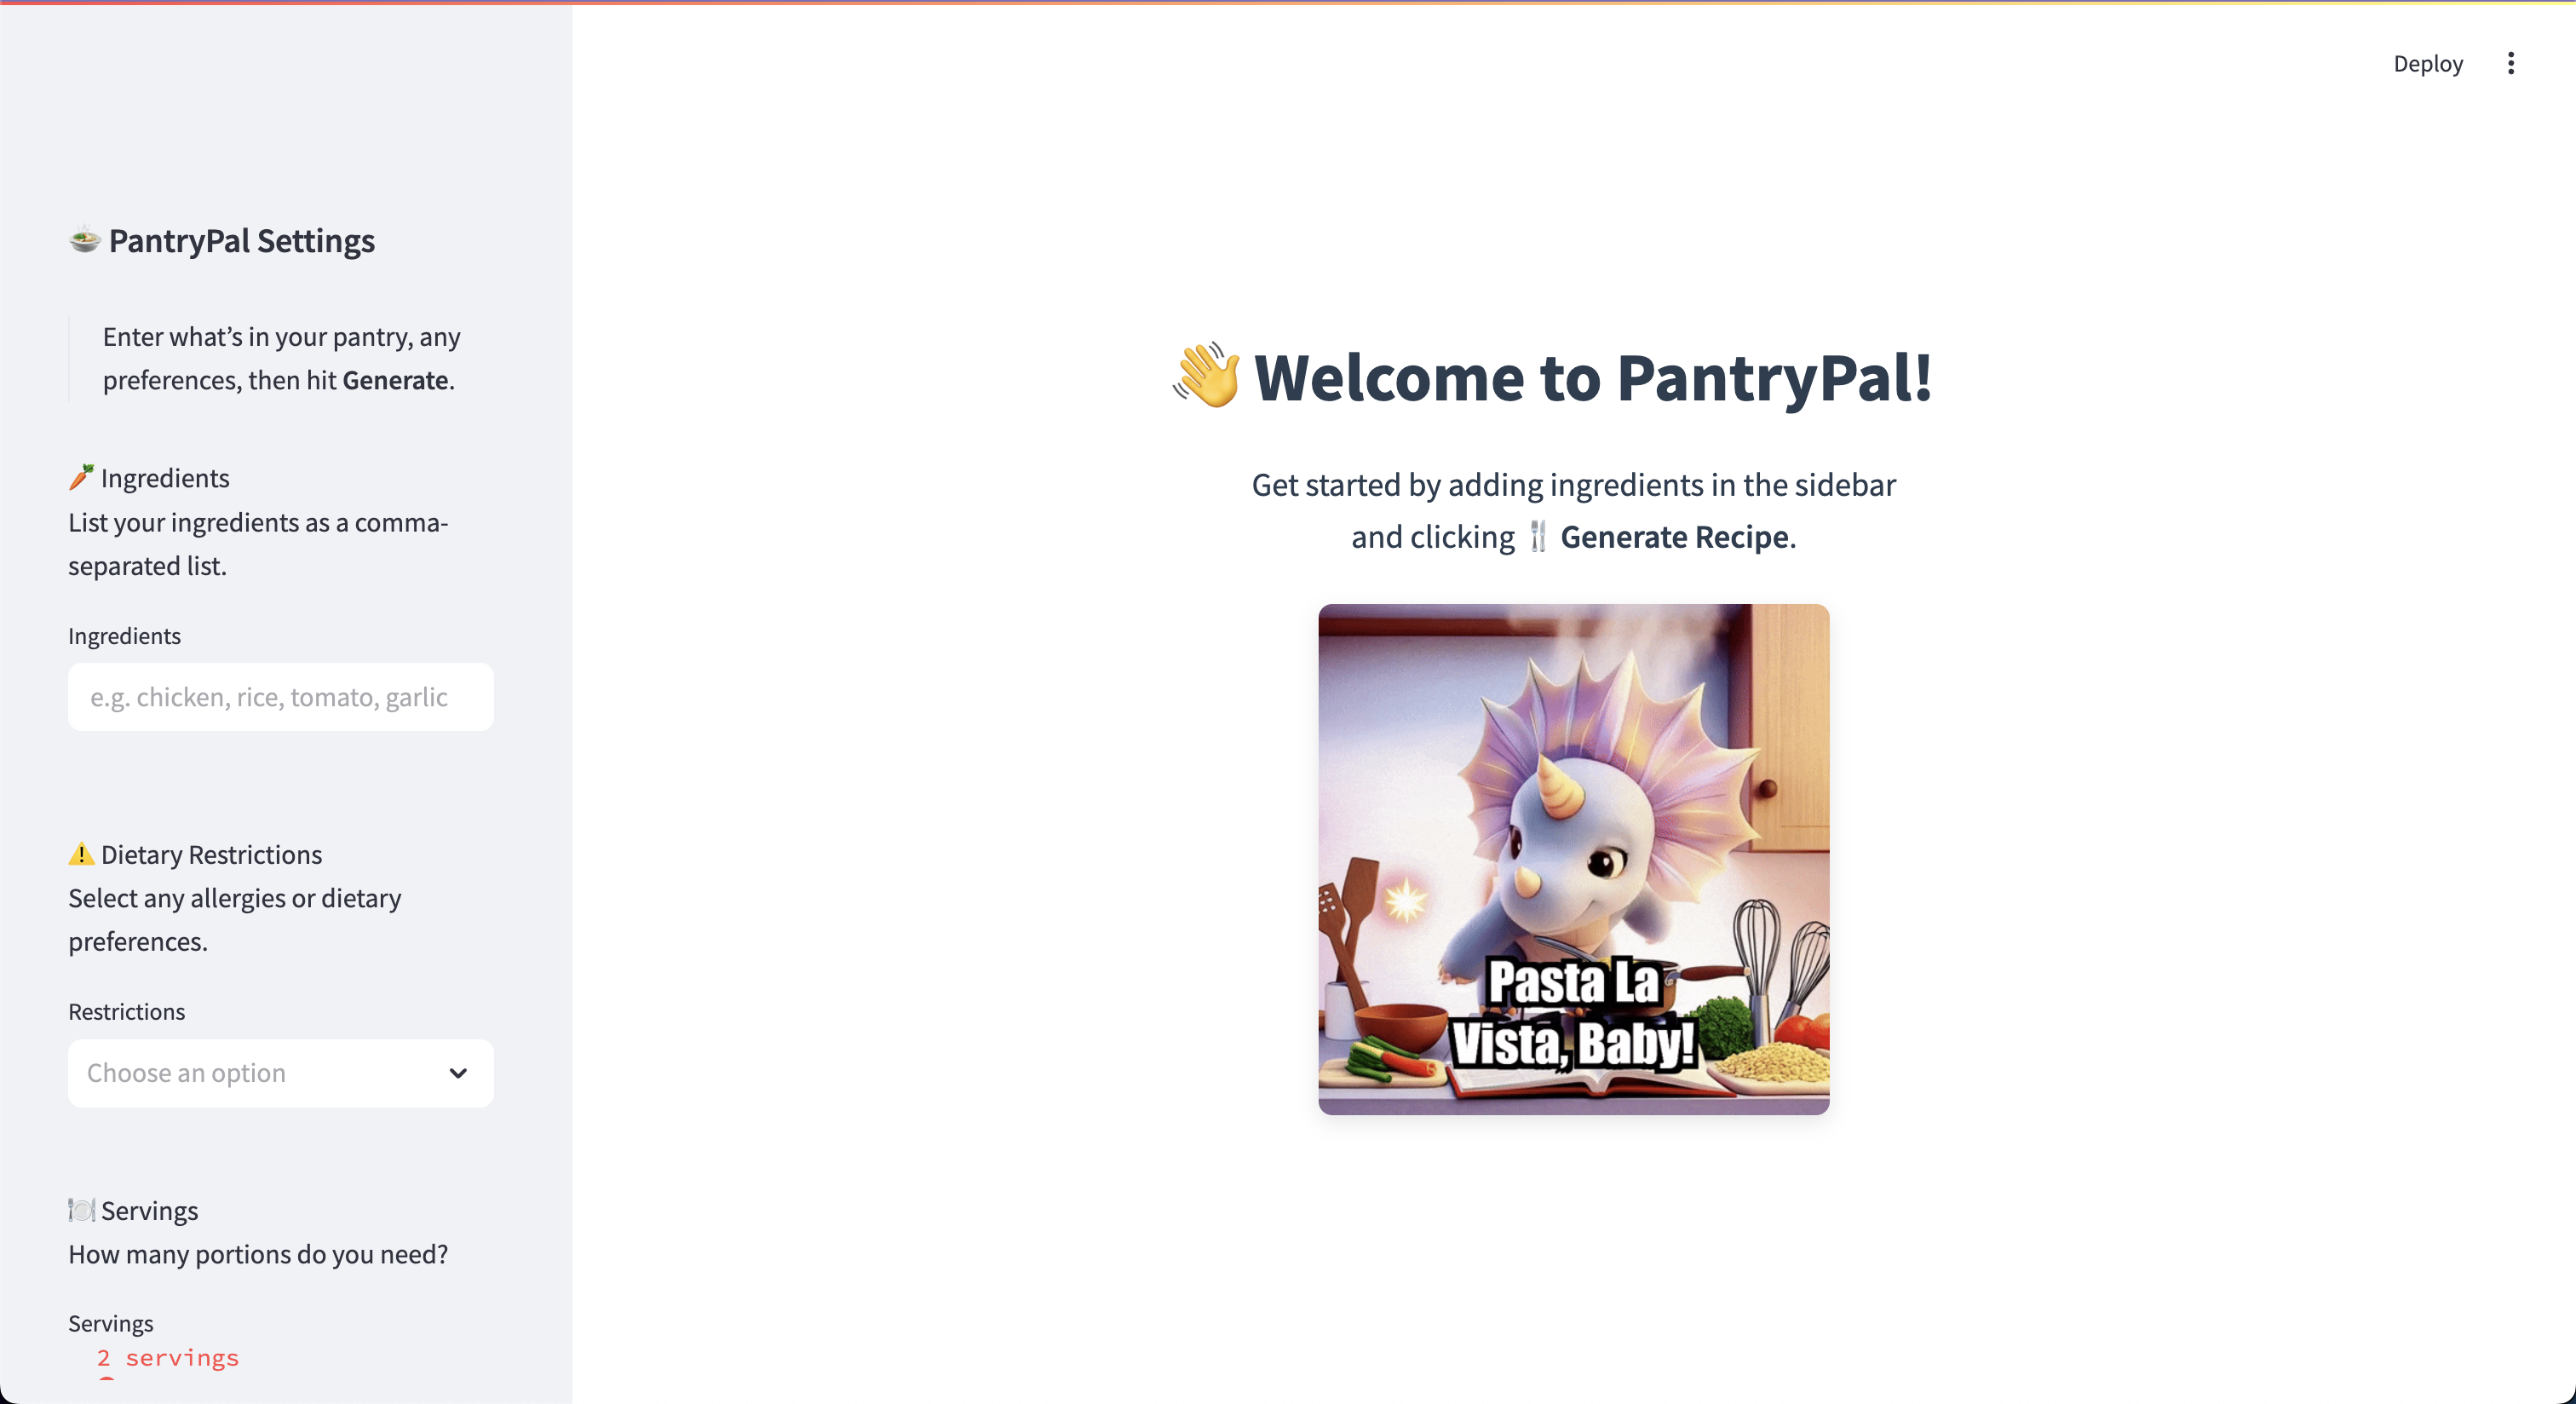
🍲 A Streamlit app powered by AI that transforms your pantry ingredients and dietary restrictions into chef-worthy recipes, complete with nutrition charts, shopping lists, and more!
Input (scripts, etc.) and output (scripts, performance results, etc.) for Gunrock and other graph engines
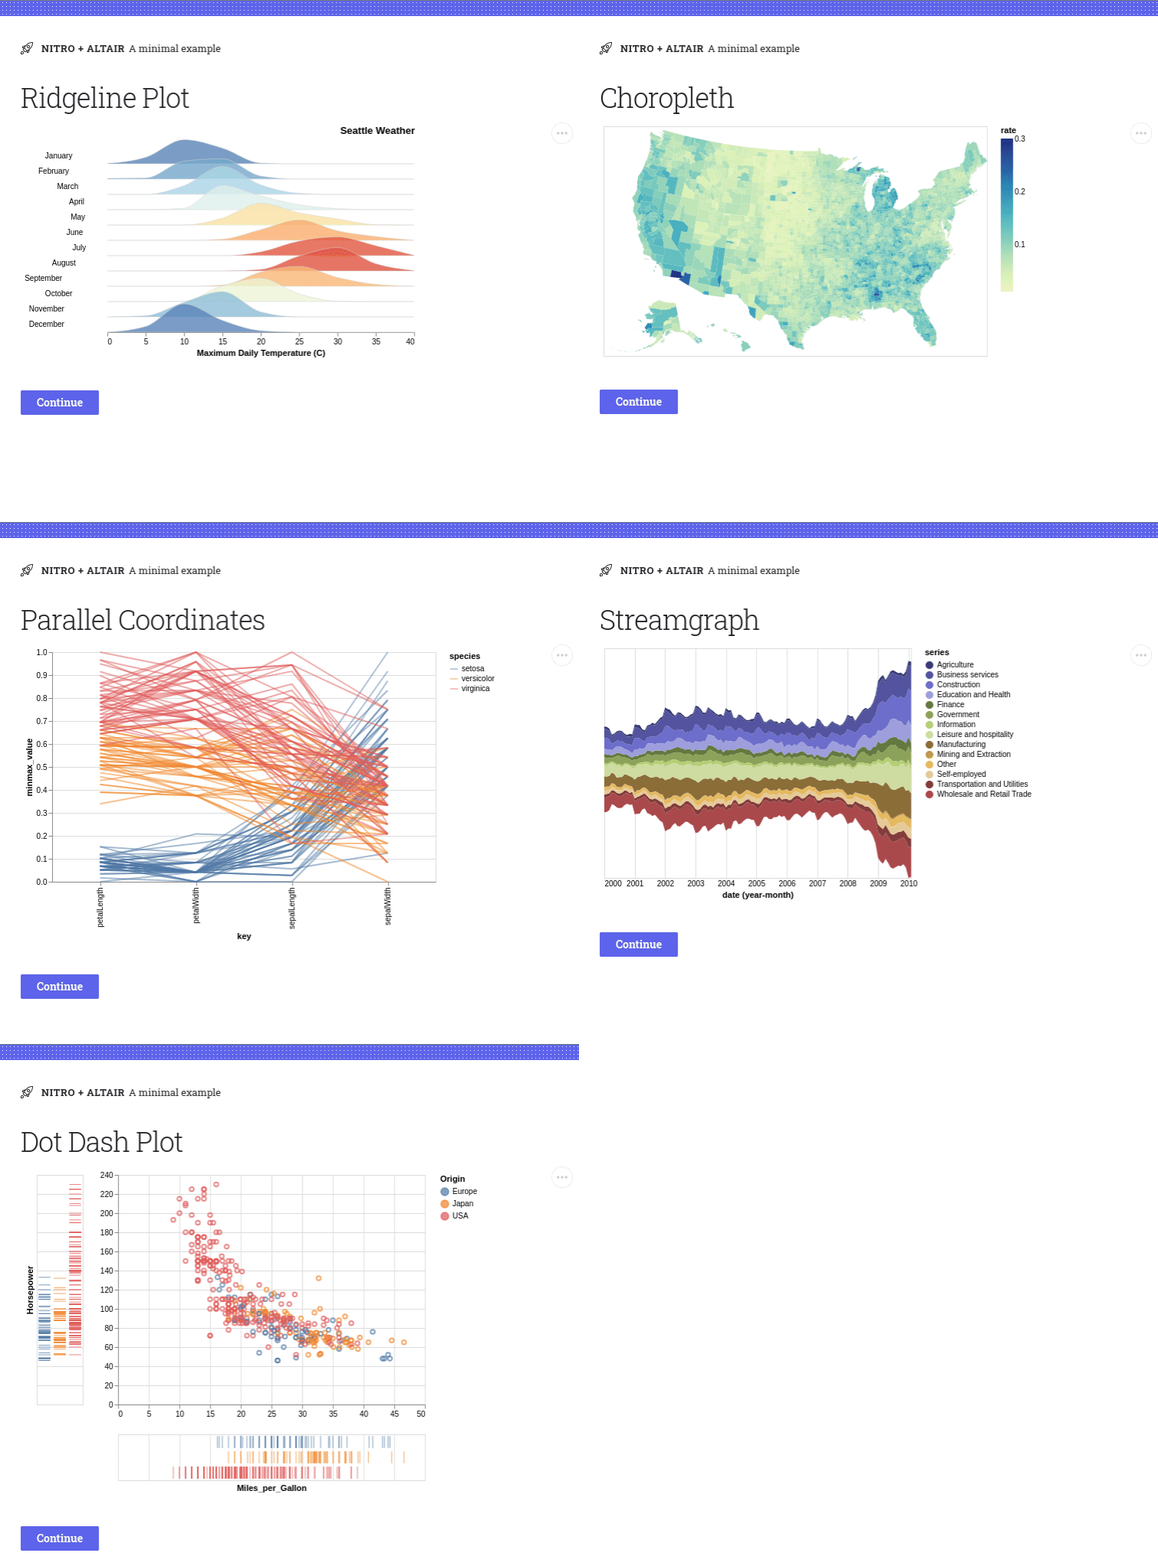
Dash components & demos to create Altair, Matplotlib, Highcharts , and Bokeh graphs within Dash apps.
wokwi sim for ATMega2560 Altair880-duino - local work by wa1tnr - port of dhansel's work here. May 2022
Codebase for my submission to Kaggle's yearly March Machine Learning Mania competition
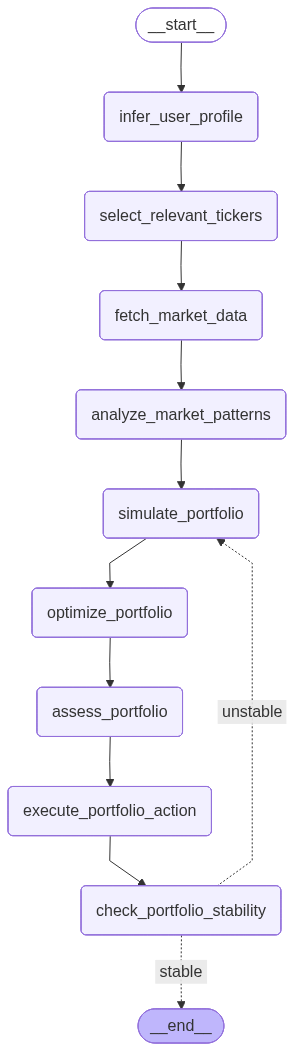
Successfully developed an AI-powered Investment Portfolio Optimization Workflow using LangGraph that infers user risk profiles, selects tickers, fetches market data, and simulates & optimizes portfolios with actionable recommendations. It integrates advanced financial metrics, risk assessment, and dynamic portfolio management for decision-making.
A Streamlit application to visualise the number of COVID vaccines done in the UK using the Altair visualisation library.