

flutter
Flutter makes it easy and fast to build beautiful apps for mobile and beyond
- 181k
- Dart
- BSD-3-Clause
- 11 h ago
📈📊🎓🎓🎓AAChartKit-Pro is a professional version of AAChartKit, it is an elegant and friendly chart framework for iOS, iPadOS, macOS. AAChartKit-Pro is a more powerful data visualization framework that supports more types beautiful chart like bellcurve, bullet, columnpyramid, cylinder, dependencywheel, heatmap, histogram, networkgraph, organization, packedbubble, pareto, sankey, series, solidgau
Repo AAChartModel/AAChartKit-Pro, read from GitHub 1 min ago. AAChartModel has not joined Take My Repo.
AAChartModel/AAChartKit-Pro is a public repo on GitHub by AAChartModel. 📈📊🎓🎓🎓AAChartKit-Pro is a professional version of AAChartKit, it is an elegant and friendly chart framework for iOS, iPadOS, macOS. AAChartKit-Pro is a more powerful data visualization framework that supports more types beautiful chart like bellcurve, bullet, columnpyramid, cylinder, dependencywheel, heatmap, histogram, networkgraph, organization, packedbubble, pareto, sankey, series, solidgau. It declares the MIT license on GitHub. It is written mainly in Objective-C, has 42 stars and last changed on 2026-05-12. Nobody has reviewed it on Take My Repo yet, which says nothing about its quality. Read from GitHub on 2026-11-18.
AAChartKit-Pro is a professional version of AAChartKit, it is an elegant and friendly chart framework for iOS, iPadOS, tvOS, macOS. AAChartKit-Pro is a more powerful data visualization framework that supports more types beautiful chart like bellcurve, bullet, columnpyramid, cylinder, dependencywheel, heatmap, histogram, networkgraph, organization, packedbubble, pareto, sankey, series, solidgauge, streamgraph, sunburst, tilemap, timeline, treemap, variablepie, variwide, vector, venn, windbarb, wordcloud, xrange charts and so on. More chart types are planned to be supported. AAChartKit-Pro gives you easy and fast access to a wide range of chart types, hassle-free and quick to integrate into your own project.
iOS 8+, ARC support.column chart, bar chart, area chart, areaspline chart, line chart, spline chart, radar chart, polar chart, pie chart, bubble chart, pyramid chart, funnel chart, columnrange chart, arearange chart, mixed chart and other graphics. Support for more chart types is planned.animation effect is exquisite, delicate, smooth and beautiful.chain programming syntax like MasonryAAChartView + AAChartModel = Chart. The AAChartKit follows a minimalist formula: Chart view + Chart model = The chart you want, just like the powerful and beautiful charts lib AAInfographics| Column Chart | Column Range Chart | Area Chart |
|---|---|---|
 |
 |
 |
| Line Chart | Step Area Chart | Step Line Chart |
|---|---|---|
 |
 |
 |
| Spline Chart | Areaspline Chart | Stacked Polar Chart |
|---|---|---|
 |
 |
 |
| Bubble Chart | Arearange Average Value Chart | Column Mixed Line Chart |
|---|---|---|
 |
 |
 |
Drag the AAChartKitLib folder into your project.
Add the following to your .pch file.
#import "AAGlobalMacro.h"
#import "AAChartKit.h"
AAChartViewCGFloat chartViewWidth = self.view.frame.size.width; CGFloat chartViewHeight = self.view.frame.size.height-250; _aaChartView = [[AAChartView alloc]init]; _aaChartView.frame = CGRectMake(0, 60, chartViewWidth, chartViewHeight); //_aaChartView.scrollEnabled = NO; //// set the content height of aaChartView // _aaChartView.contentHeight = chartViewHeight; [self.view addSubview:_aaChartView];
AAChartModelAAChartModel *aaChartModel= AAObject(AAChartModel) .chartTypeSet(AAChartTypeColumn) .titleSet(@"THE HEAT OF PROGRAMMING LANGUAGE") .subtitleSet(@"Virtual Data") .categoriesSet(@[@"Java",@"Swift",@"Python",@"Ruby", @"PHP",@"Go",@"C",@"C#",@"C++"]) .yAxisTitleSet(@"Degrees Celsius") .seriesSet(@[ AAObject(AASeriesElement) .nameSet(@"2017") .dataSet(@[@7.0, @6.9, @9.5, @14.5, @18.2, @21.5, @25.2, @26.5, @23.3, @18.3, @13.9, @9.6]), AAObject(AASeriesElement) .nameSet(@"2018") .dataSet(@[@0.2, @0.8, @5.7, @11.3, @17.0, @22.0, @24.8, @24.1, @20.1, @14.1, @8.6, @2.5]), AAObject(AASeriesElement) .nameSet(@"2019") .dataSet(@[@0.9, @0.6, @3.5, @8.4, @13.5, @17.0, @18.6, @17.9, @14.3, @9.0, @3.9, @1.0]), AAObject(AASeriesElement) .nameSet(@"2020") .dataSet(@[@3.9, @4.2, @5.7, @8.5, @11.9, @15.2, @17.0, @16.6, @14.2, @10.3, @6.6, @4.8]), ]) ;
//The chart view object calls the instance object of AAChartModel and draws the final graphic
[_aaChartView aa_drawChartWithChartModel:aaChartModel];
🌹🌹🌹Congratulations! Everything was done!!! You will get what you want!!!🌈🌈🌈
if you want to refresh chart content,you should do something as follow.According to your actual needs, select the function that fits you.
//Refresh the chart dynamically only when the series attribute of the AAChartModel object is updated
[_aaChartView aa_onlyRefreshTheChartDataWithChartModelSeries:aaChartModelSeriesArray];
aa_onlyRefreshTheChartDataWithChartModelSeries)//Refresh the chart after the AAChartModel content is updated [_aaChartView aa_refreshChartWithChartModel:aaChartModel];


- Note: The following
DEMO pictureis aGIF dynamic picturewhich has a size of around 6M. If you don't see any dynamic preview, then this is because the picture resources were not fully loaded. In such a case please be patient and wait for the contents to finish loading. Maybe you need to reload this page.

The pie chart as well as the bubble chart are special in AAChartKit. If you want to draw these types of charts, you need to prepare the property series of AAChartModel differently:
AAChartModel like this: AAChartModel *chartModel= AAObject(AAChartModel)
.chartTypeSet(AAChartTypePie)
.titleSet(@"THE HEAT OF PROGRAMMING LANGUAGE")
.subtitleSet(@"Virtual Data")
.yAxisTitleSet(@"Degrees Celsius")
.seriesSet(
@[AAObject(AASeriesElement)
.nameSet(@"Percent")
.dataSet(@[
@[@"Java" , @67],
@[@"Swift" , @44],
@[@"Python", @83],
@[@"OC" , @11],
@[@"Ruby" , @42],
@[@"PHP" , @31],
@[@"Go" , @63],
@[@"C" , @24],
@[@"C#" , @888],
@[@"C++" , @66],
]),
]
)
;AAChartModel like this: AAChartModel *chartModel= AAObject(AAChartModel)
.chartTypeSet(AAChartTypeBubble)
.titleSet(@"THE HEAT OF PROGRAMMING LANGUAGE")
.subtitleSet(@"Virtual Data")
.yAxisTitleSet(@"Degrees Celsius")
.seriesSet(
@[
AAObject(AASeriesElement)
.nameSet(@"2017")
.dataSet(
@[
@[@97, @36, @79],
@[@94, @74, @60],
@[@68, @76, @58],
@[@64, @87, @56],
@[@68, @27, @73],
@[@74, @99, @42],
@[@7, @93, @87],
@[@51, @69, @40],
@[@38, @23, @33],
@[@57, @86, @31]
]),
AAObject(AASeriesElement)
.nameSet(@"2018")
.dataSet(
@[
@[@25, @10, @87],
@[@2, @75, @59],
@[@11, @54, @8 ],
@[@86, @55, @93],
@[@5, @3, @58],
@[@90, @63, @44],
@[@91, @33, @17],
@[@97, @3, @56],
@[@15, @67, @48],
@[@54, @25, @81]
]),
AAObject(AASeriesElement)
.nameSet(@"2019")
.dataSet(
@[
@[@47, @47, @21],
@[@20, @12, @4 ],
@[@6, @76, @91],
@[@38, @30, @60],
@[@57, @98, @64],
@[@61, @17, @80],
@[@83, @60, @13],
@[@67, @78, @75],
@[@64, @12, @10],
@[@30, @77, @82]
]),
]
)
;typedef NSString *AAChartType; AACHARTKIT_EXTERN AAChartType const AAChartTypeColumn; //column chart AACHARTKIT_EXTERN AAChartType const AAChartTypeBar; //bar chart AACHARTKIT_EXTERN AAChartType const AAChartTypeArea; //area chart AACHARTKIT_EXTERN AAChartType const AAChartTypeAreaspline; //area spline chart AACHARTKIT_EXTERN AAChartType const AAChartTypeLine; //line chart AACHARTKIT_EXTERN AAChartType const AAChartTypeSpline; //spline chart AACHARTKIT_EXTERN AAChartType const AAChartTypeScatter; //scatter chart AACHARTKIT_EXTERN AAChartType const AAChartTypePie; //pie chart AACHARTKIT_EXTERN AAChartType const AAChartTypeBubble; //bubble chart AACHARTKIT_EXTERN AAChartType const AAChartTypePyramid; //pyramid chart AACHARTKIT_EXTERN AAChartType const AAChartTypeFunnel; //funnel chart AACHARTKIT_EXTERN AAChartType const AAChartTypeColumnrange; //column range chart AACHARTKIT_EXTERN AAChartType const AAChartTypeArearange; //area range chart AACHARTKIT_EXTERN AAChartType const AAChartTypeAreasplinerange; //area spline range chart AACHARTKIT_EXTERN AAChartType const AAChartTypeBoxplot; //box plot chart AACHARTKIT_EXTERN AAChartType const AAChartTypeWaterfall; //Waterfall chart AACHARTKIT_EXTERN AAChartType const AAChartTypePolygon; //polygon chart
typedef NSString *AAChartZoomType;

AACHARTKIT_EXTERN AAChartZoomType const AAChartZoomTypeNone;
AACHARTKIT_EXTERN AAChartZoomType const AAChartZoomTypeX;
AACHARTKIT_EXTERN AAChartZoomType const AAChartZoomTypeY;
AACHARTKIT_EXTERN AAChartZoomType const AAChartZoomTypeXY;
typedef NS_ENUM(NSInteger,AAChartAnimation) {
    AAChartAnimationLinear = 0,
    AAChartAnimationEaseInQuad,
    AAChartAnimationEaseOutQuad,
    AAChartAnimationEaseInOutQuad,
    AAChartAnimationEaseInCubic,
    AAChartAnimationEaseOutCubic,
    AAChartAnimationEaseInOutCubic,
    AAChartAnimationEaseInQuart,
    AAChartAnimationEaseOutQuart,
    AAChartAnimationEaseInOutQuart,
    AAChartAnimationEaseInQuint,
    AAChartAnimationEaseOutQuint,
    AAChartAnimationEaseInOutQuint,
    AAChartAnimationEaseInSine,
    AAChartAnimationEaseOutSine,
    AAChartAnimationEaseInOutSine,
    AAChartAnimationEaseInExpo,
    AAChartAnimationEaseOutExpo,
    AAChartAnimationEaseInOutExpo,
    AAChartAnimationEaseInCirc,
    AAChartAnimationEaseOutCirc,
    AAChartAnimationEaseInOutCirc,
    AAChartAnimationEaseOutBounce,
    AAChartAnimationEaseInBack,
    AAChartAnimationEaseOutBack,
    AAChartAnimationEaseInOutBack,
    AAChartAnimationElastic,
    AAChartAnimationSwingFromTo,
    AAChartAnimationSwingFrom,
    AAChartAnimationSwingTo,
    AAChartAnimationBounce,
    AAChartAnimationBouncePast,
    AAChartAnimationEaseFromTo,
    AAChartAnimationEaseFrom,
    AAChartAnimationEaseTo,
};
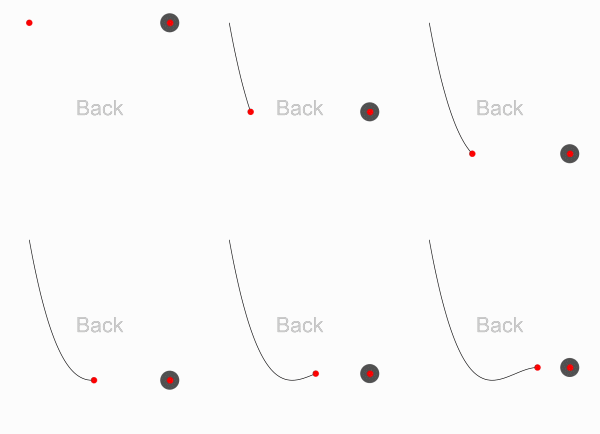
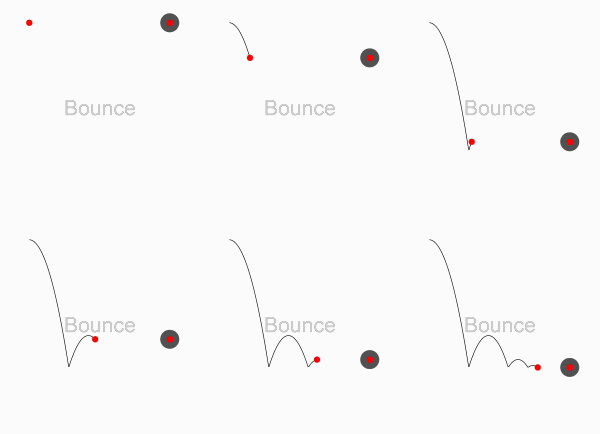
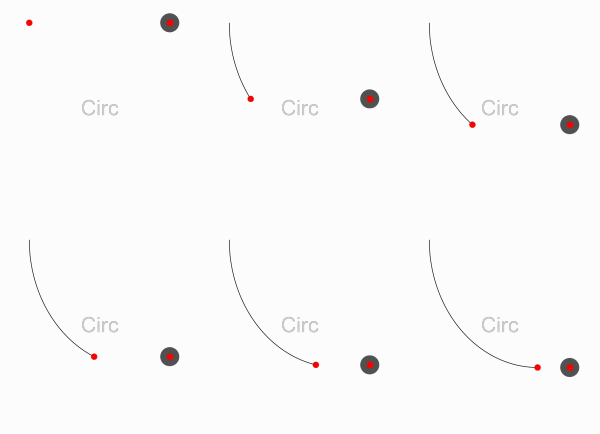
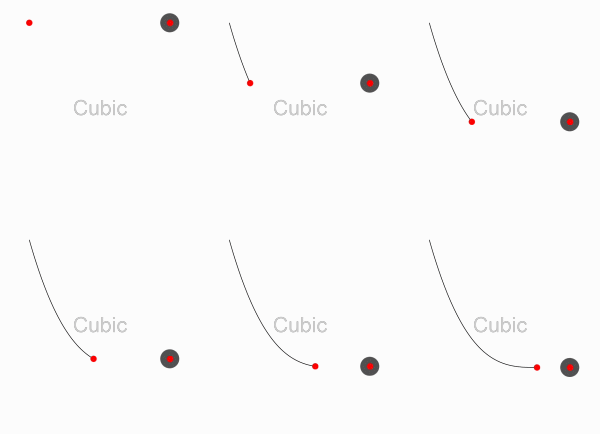
Here are the ten concrete animation types of AAChartKit
| Back | Bounce | Circ | Cubic | Elastic |
|---|---|---|---|---|
 |
 |
 |
 |
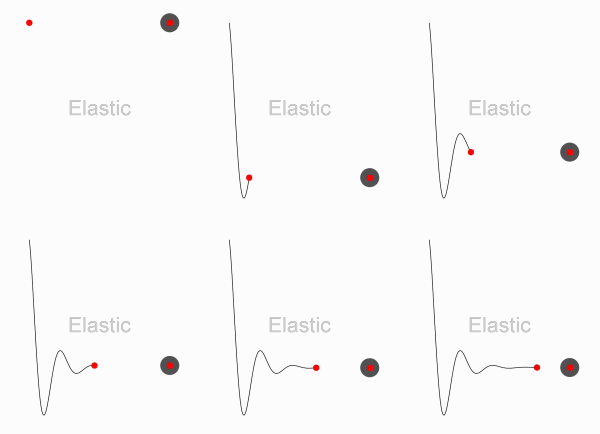 |
| Expo | Quad | Quart | Quint | Sine |
|---|---|---|---|---|
 |
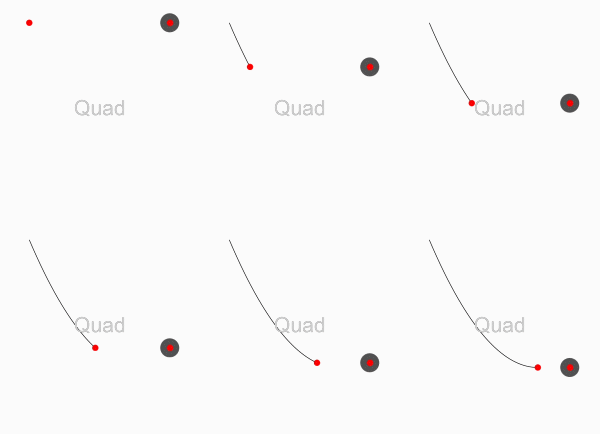 |
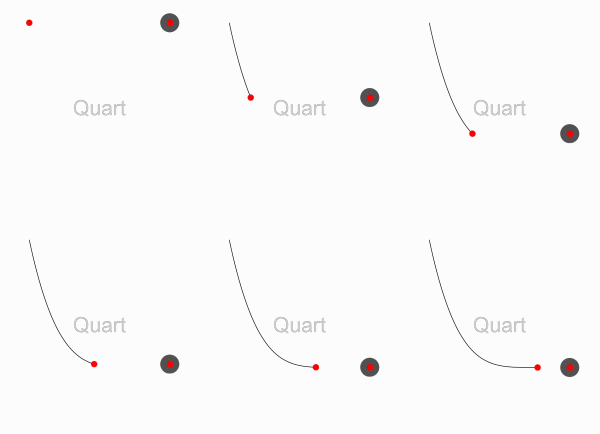 |
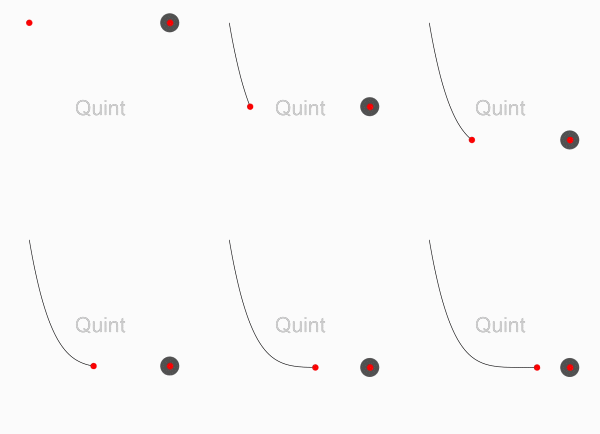 |
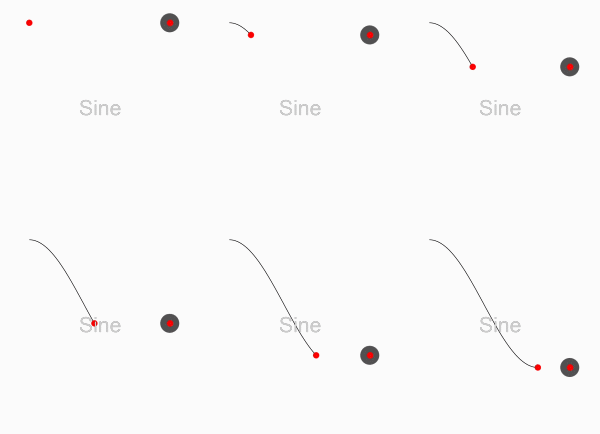 |
AAPropStatementAndPropSetFuncStatement(copy,   AAChartModel, NSString *, title);
AAPropStatementAndPropSetFuncStatement(copy,   AAChartModel, NSNumber *, titleFontSize);
AAPropStatementAndPropSetFuncStatement(copy,   AAChartModel, NSString *, titleFontColor);
AAPropStatementAndPropSetFuncStatement(copy,   AAChartModel, NSString *, titleFontWeight);

AAPropStatementAndPropSetFuncStatement(copy,   AAChartModel, NSString *, subtitle);
AAPropStatementAndPropSetFuncStatement(copy,   AAChartModel, NSNumber *, subtitleFontSize);
AAPropStatementAndPropSetFuncStatement(copy,   AAChartModel, NSString *, subtitleFontColor);
AAPropStatementAndPropSetFuncStatement(copy,   AAChartModel, NSString *, subtitleFontWeight);

AAPropStatementAndPropSetFuncStatement(strong, AAChartModel, NSArray  *, series);

AAPropStatementAndPropSetFuncStatement(copy,   AAChartModel, AAChartSubtitleAlignType, subtitleAlign);
AAPropStatementAndPropSetFuncStatement(copy,   AAChartModel, AAChartType,              chartType);
AAPropStatementAndPropSetFuncStatement(copy,   AAChartModel, AAChartStackingType,      stacking);
AAPropStatementAndPropSetFuncStatement(copy,   AAChartModel, AAChartSymbolType,        symbol);
AAPropStatementAndPropSetFuncStatement(assign, AAChartModel, AAChartSymbolStyleType,   symbolStyle);
AAPropStatementAndPropSetFuncStatement(copy,   AAChartModel, AAChartZoomType,          zoomType);
AAPropStatementAndPropSetFuncStatement(assign, AAChartModel, AAChartAnimation,         animationType);

AAPropStatementAndPropSetFuncStatement(strong, AAChartModel, NSNumber *, animationDuration);
AAPropStatementAndPropSetFuncStatement(assign, AAChartModel, BOOL,       inverted);
AAPropStatementAndPropSetFuncStatement(assign, AAChartModel, BOOL,       xAxisReversed);
AAPropStatementAndPropSetFuncStatement(assign, AAChartModel, BOOL,       yAxisReversed);
AAPropStatementAndPropSetFuncStatement(assign, AAChartModel, BOOL,       gradientColorEnabled);
AAPropStatementAndPropSetFuncStatement(assign, AAChartModel, BOOL,       polar);
AAPropStatementAndPropSetFuncStatement(assign, AAChartModel, BOOL,       dataLabelEnabled);
AAPropStatementAndPropSetFuncStatement(copy,   AAChartModel, NSString *, dataLabelFontColor);
AAPropStatementAndPropSetFuncStatement(strong, AAChartModel, NSNumber *, dataLabelFontSize);
AAPropStatementAndPropSetFuncStatement(copy,   AAChartModel, NSString *, dataLabelFontWeight);
AAPropStatementAndPropSetFuncStatement(assign, AAChartModel, BOOL,       xAxisLabelsEnabled);
AAPropStatementAndPropSetFuncStatement(copy,   AAChartModel, NSNumber *, xAxisLabelsFontSize);
AAPropStatementAndPropSetFuncStatement(copy,   AAChartModel, NSString *, xAxisLabelsFontColor);
AAPropStatementAndPropSetFuncStatement(copy,   AAChartModel, NSString *, xAxisLabelsFontWeight);
AAPropStatementAndPropSetFuncStatement(strong, AAChartModel, NSArray  *, categories);
AAPropStatementAndPropSetFuncStatement(strong, AAChartModel, NSNumber *, xAxisGridLineWidth);
AAPropStatementAndPropSetFuncStatement(strong, AAChartModel, NSNumber *, xAxisTickInterval);

AAPropStatementAndPropSetFuncStatement(assign, AAChartModel, BOOL,       xAxisVisible);
AAPropStatementAndPropSetFuncStatement(assign, AAChartModel, BOOL,       yAxisVisible);
AAPropStatementAndPropSetFuncStatement(assign, AAChartModel, BOOL,       yAxisLabelsEnabled);
AAPropStatementAndPropSetFuncStatement(copy,   AAChartModel, NSString *, yAxisTitle);
AAPropStatementAndPropSetFuncStatement(copy,   AAChartModel, NSNumber *, yAxisLabelsFontSize);
AAPropStatementAndPropSetFuncStatement(copy,   AAChartModel, NSString *, yAxisLabelsFontColor);
AAPropStatementAndPropSetFuncStatement(copy,   AAChartModel, NSString *, yAxisLabelsFontWeight);
AAPropStatementAndPropSetFuncStatement(strong, AAChartModel, NSNumber *, yAxisGridLineWidth);
AAPropStatementAndPropSetFuncStatement(strong, AAChartModel, NSArray     <NSString *>*, colorsTheme);
AAPropStatementAndPropSetFuncStatement(copy,   AAChartModel, NSString *, backgroundColor);

AAPropStatementAndPropSetFuncStatement(assign, AAChartModel, BOOL,       tooltipEnabled);
AAPropStatementAndPropSetFuncStatement(copy,   AAChartModel, NSString *, tooltipValueSuffix);
AAPropStatementAndPropSetFuncStatement(copy  , AAChartModel, NSString *, tooltipValueString);
AAPropStatementAndPropSetFuncStatement(assign, AAChartModel, BOOL,       tooltipCrosshairs);
AAPropStatementAndPropSetFuncStatement(assign, AAChartModel, BOOL,       connectNulls);
AAPropStatementAndPropSetFuncStatement(assign, AAChartModel, BOOL,       legendEnabled);

AAPropStatementAndPropSetFuncStatement(strong, AAChartModel, NSNumber *, borderRadius);
AAPropStatementAndPropSetFuncStatement(strong, AAChartModel, NSNumber *, markerRadius);

AAPropStatementAndPropSetFuncStatement(assign, AAChartModel, BOOL,       yAxisAllowDecimals);
AAPropStatementAndPropSetFuncStatement(strong, AAChartModel, NSArray  *, yAxisPlotLines);
AAPropStatementAndPropSetFuncStatement(strong, AAChartModel, NSNumber *, yAxisMax);
AAPropStatementAndPropSetFuncStatement(strong, AAChartModel, NSNumber *, yAxisMin);
AAPropStatementAndPropSetFuncStatement(strong, AAChartModel, NSArray  *, yAxisTickPositions);
AAPropStatementAndPropSetFuncStatement(copy,   AAChartModel, NSString *, zoomResetButtonText);

                         _0_
                       _oo0oo_
                      o8888888o
                      88" . "88
                      (| -_- |)
                      0\  =  /0
                    ___/`---'\___
                  .' \\|     |// '.
                 / \\|||  :  |||// \
                / _||||| -:- |||||- \
               |   | \\\  -  /// |   |
               | \_|  ''\---/''  |_/ |
               \  .-\__  '-'  ___/-. /
             ___'. .'  /--.--\  `. .'___
          ."" '<  `.___\_<|>_/___.' >' "".
         | | :  `- \`.;`\ _ /`;.`/ - ` : | |
         \  \ `_.   \_ __\ /__ _/   .-` /  /
     =====`-.____`.___ \_____/___.-`___.-'=====
                       `=---='
*****************************************************
     ¥¥¥¥¥¥¥¥¥¥¥¥¥¥¥¥¥¥¥¥¥¥¥¥¥¥¥¥¥¥¥¥¥¥¥¥¥¥¥¥¥¥¥
         €€€€€€€€€€€€€€€€€€€€€€€€€€€€€€€€€€
               $$$$$$$$$$$$$$$$$$$$$$$
                   BUDDHA_BLESS_YOU
                      AWAY_FROM
                         BUG
| Language Version | Project Name | Source Code Link |
|---|---|---|
| Objective C | AAChartKit | https://github.com/AAChartModel/AAChartKit |
| Swift | AAInfographics | https://github.com/AAChartModel/AAChartKit-Swift |
AAChartKit is available under the MIT license. See the LICENSE file for more information.
If you want to shrink the size of the AAChartKit lib, you should do something like this:
.js file of AAJSFiles folder in AAChartKit. The names of the files that need to be deleted are the following:2.Change the content of AAChartView.html file
<script src="AAHighchartsLib.js">
</script>
<script src="AAHighchartsMore.js">
</script>
<script src="AAHighcharts-3d.js">
</script>
<script src="AAFunnel.js">
</script>
to be
<script src="https://img.hcharts.cn/highcharts/highcharts.js">
</script>
<script src="https://img.hcharts.cn/highcharts/highcharts-more.js">
</script>
series) content dynamicallycolumn chart、bar chart、pie charts、scatterplot chart、bubble chart, etc.CocoaPodsCarthageAAOptions model object properties freelyAAChartModel/AAChartKit-Pro is a public repo on GitHub by AAChartModel. 📈📊🎓🎓🎓AAChartKit-Pro is a professional version of AAChartKit, it is an elegant and friendly chart framework for iOS, iPadOS, macOS. AAChartKit-Pro is a more powerful data visualization framework that supports more types beautiful chart like bellcurve, bullet, columnpyramid, cylinder, dependencywheel, heatmap, histogram, networkgraph, organization, packedbubble, pareto, sankey, series, solidgau.
It declares the MIT license on GitHub.
Its maker tagged it for macOS. That is declared by the maker; Take My Repo has not tested it.
Open "Take it" on its page: Take My Repo writes an install plan for your machine and hands it to your AI agent (Claude Code, Codex or Cursor), which asks you before each step. Take My Repo has not tested it on any machine.
Flutter makes it easy and fast to build beautiful apps for mobile and beyond
Its last change on GitHub was on 2026-05-12. Take My Repo does not judge from that whether it is maintained.
Nobody has reviewed it on Take My Repo yet, which says nothing about its quality.
f.k.a. Awesome ChatGPT Prompts. Share, discover, and collect prompts from the community. Free and open source — self-host for your organization with complete privacy.
Build Agentic workflows, RAG pipelines, with rich AI model and tool support on one collaborative workspace. Deploy on cloud, VPC, or self-hosted, so teams move from prototype to production without rebuilding the stack.
📈📊🚀🚀🚀An elegant modern declarative data visualization chart framework for iOS, iPadOS and macOS. Extremely powerful, supports line, spline, area, areaspline, column, bar, pie, scatter, angular gauges, arearange, areasplinerange, columnrange, bubble, box plot, error bars, funnel, waterfall and polar chart types. 极其精美而又强大的现代化声明式数据可视化图表框架,支持柱状图、条形图、折线图、曲线图、折线填充图、曲线填充图、气泡图、扇形图、环形图、散点图、雷达图、混合图等各种类
📈📊📱💻🖥️An elegant modern declarative data visualization chart framework for iOS, iPadOS and macOS. Extremely powerful, supports line, spline, area, areaspline, column, bar, pie, scatter, angular gauges, arearange, areasplinerange, columnrange, bubble, box plot, error bars, funnel, waterfall and polar chart types. 极其精美而又强大的现代化声明式数据可视化图表框架,支持柱状图、条形图、折线图、曲线图、折线填充图、曲线填充图、气泡图、扇形图、环形图、散点图、雷达图、混合图等各种
An easy way to creat universal table view cell for iOS project


