VoiceStudio
VoiceStudio is the open-source, fully-local ElevenLabs alternative — voice cloning, voice design, video dubbing, dictation, transcription & audiobook creation in 646 languages.
- 116k
- Python
- AGPL-3.0
- 3 h ago
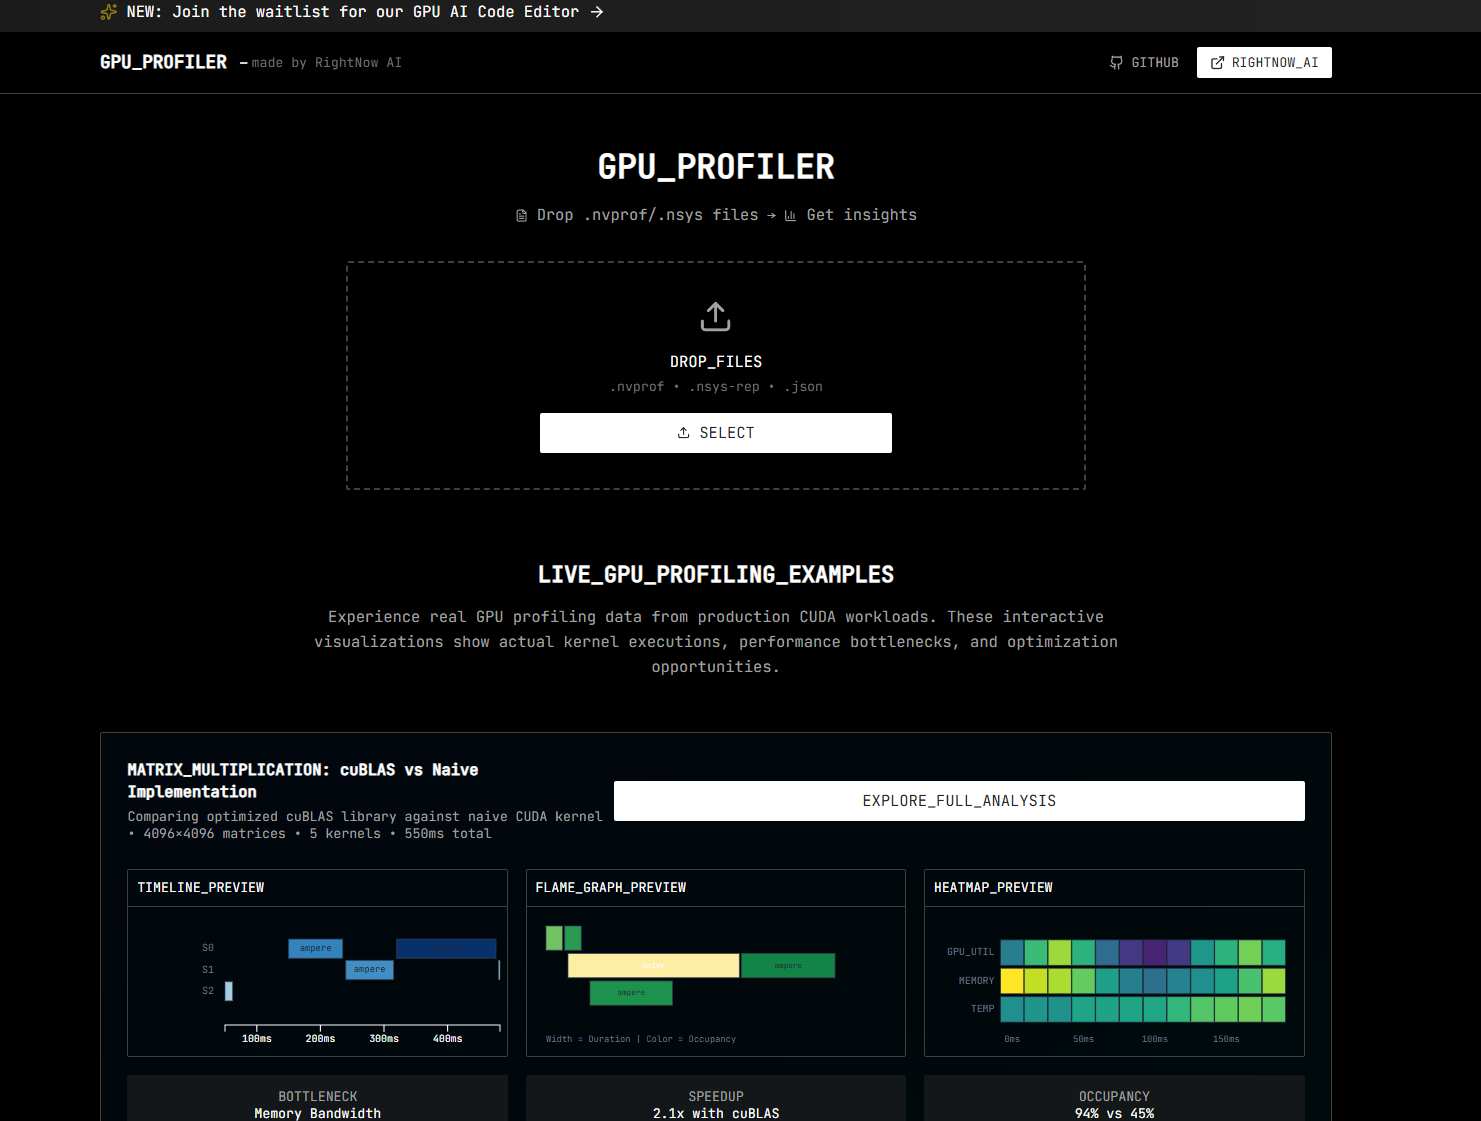
Open-source web-based GPU performance visualization tool that transforms NVIDIA profiling data into interactive insights for CUDA engineers. Features timeline views, flame graphs, heatmaps, and AI-powered bottleneck detection.
Repo RightNow-AI/gpu-profiler, read from GitHub 22 h ago. RightNow-AI has not joined Take My Repo.
RightNow-AI/gpu-profiler is a public repo on GitHub by RightNow-AI. Open-source web-based GPU performance visualization tool that transforms NVIDIA profiling data into interactive insights for CUDA engineers. Features timeline views, flame graphs, heatmaps, and AI-powered bottleneck detection. It declares the MIT license on GitHub. It is written mainly in TypeScript, has 13 stars and last changed on 2025-08-29. Nobody has reviewed it on Take My Repo yet, which says nothing about its quality. Read from GitHub on 2026-11-21.
Open-source web-based GPU performance visualization tool that transforms NVIDIA profiling data into interactive insights for CUDA engineers.
Part of the RightNow AI ecosystem. Want 180x more powerful AI assistance for your entire codebase? Try RightNow AI Code Editor.
# Clone and install
git clone https://github.com/RightNow-AI/gpu-profiler.git
cd gpu-profiler
npm install

# Start development server
npm run dev

# Open http://localhost:3000 and drop your .nvprof files!
Try GPU Profiler - Upload your profiling files instantly
graph LR
    A[Upload .nvprof/.nsys] --> B[Parse Profile Data]
    B --> C[Generate Visualizations]
    C --> D[Timeline View]
    C --> E[Flame Graph]
    C --> F[Heatmap]
    D --> G[Bottleneck Analysis]
    E --> G
    F --> G
    G --> H[Export & Share]

    style A fill:#e1f5fe
    style H fill:#c8e6c9
    style G fill:#fff3e0
# Clone repository
git clone https://github.com/RightNow-AI/gpu-profiler.git
cd gpu-profiler

# Install dependencies
npm install

# Start development server
npm run dev

# Build for production
npm run build
npm start

# Verify installation at http://localhost:3000
app/
├── components/           # React components
│   ├── visualizations/  # D3.js visualization components
│   ├── file-upload.tsx  # Drag & drop upload
│   └── profiler-interface.tsx
├── lib/
│   ├── parsers/         # File format parsers
│   ├── utils.ts         # Utility functions
│   ├── sharing.ts       # URL sharing logic
│   └── export.ts        # Export functionality
├── store/               # Zustand state management
├── types/               # TypeScript definitions
└── globals.css          # Tailwind + custom styles
We welcome contributions! Please see our Contributing Guide for details.
git checkout -b feature/amazing-featurenpm testgit commit -m 'Add amazing feature'git push origin feature/amazing-featureFound a bug or have a feature request? Open an issue with:
Need advanced features for your team? RightNow AI offers:
GPU Profiler provides comprehensive performance insights:
| Category | Features |
|---|---|
| Kernel Analysis | Execution time, occupancy, register usage, memory throughput |
| Memory Profiling | Transfer patterns, bandwidth utilization, cache efficiency |
| Bottleneck Detection | AI-powered optimization suggestions and performance hints |
| Visual Analytics | Interactive charts, zoom capabilities, data export |
We welcome contributions! See CONTRIBUTING.md for guidelines.
MIT License - free for personal, educational, and commercial use.
Made with love by the RightNow AI Team
RightNow-AI/gpu-profiler is a public repo on GitHub by RightNow-AI. Open-source web-based GPU performance visualization tool that transforms NVIDIA profiling data into interactive insights for CUDA engineers. Features timeline views, flame graphs, heatmaps, and AI-powered bottleneck detection.
It declares the MIT license on GitHub.
Its maker has not tagged a system, so it is unknown here. Its README says what it needs.
Open "Take it" on its page: Take My Repo writes an install plan for your machine and hands it to your AI agent (Claude Code, Codex or Cursor), which asks you before each step. Take My Repo has not tested it on any machine.
Its last change on GitHub was on 2025-08-29. Take My Repo does not judge from that whether it is maintained.
VoiceStudio is the open-source, fully-local ElevenLabs alternative — voice cloning, voice design, video dubbing, dictation, transcription & audiobook creation in 646 languages.
Nobody has reviewed it on Take My Repo yet, which says nothing about its quality.
Research on advanced profiling of high-performance web applications (primarily WebGL applications).
Run agents like Hermes, LangChain Deep Agents, and OpenClaw more securely inside NVIDIA OpenShell with managed inference
A high-throughput and memory-efficient inference and serving engine for LLMs
Autoresearch for GPU kernels. Give it any PyTorch model, go to sleep, wake up to optimized Triton kernels.
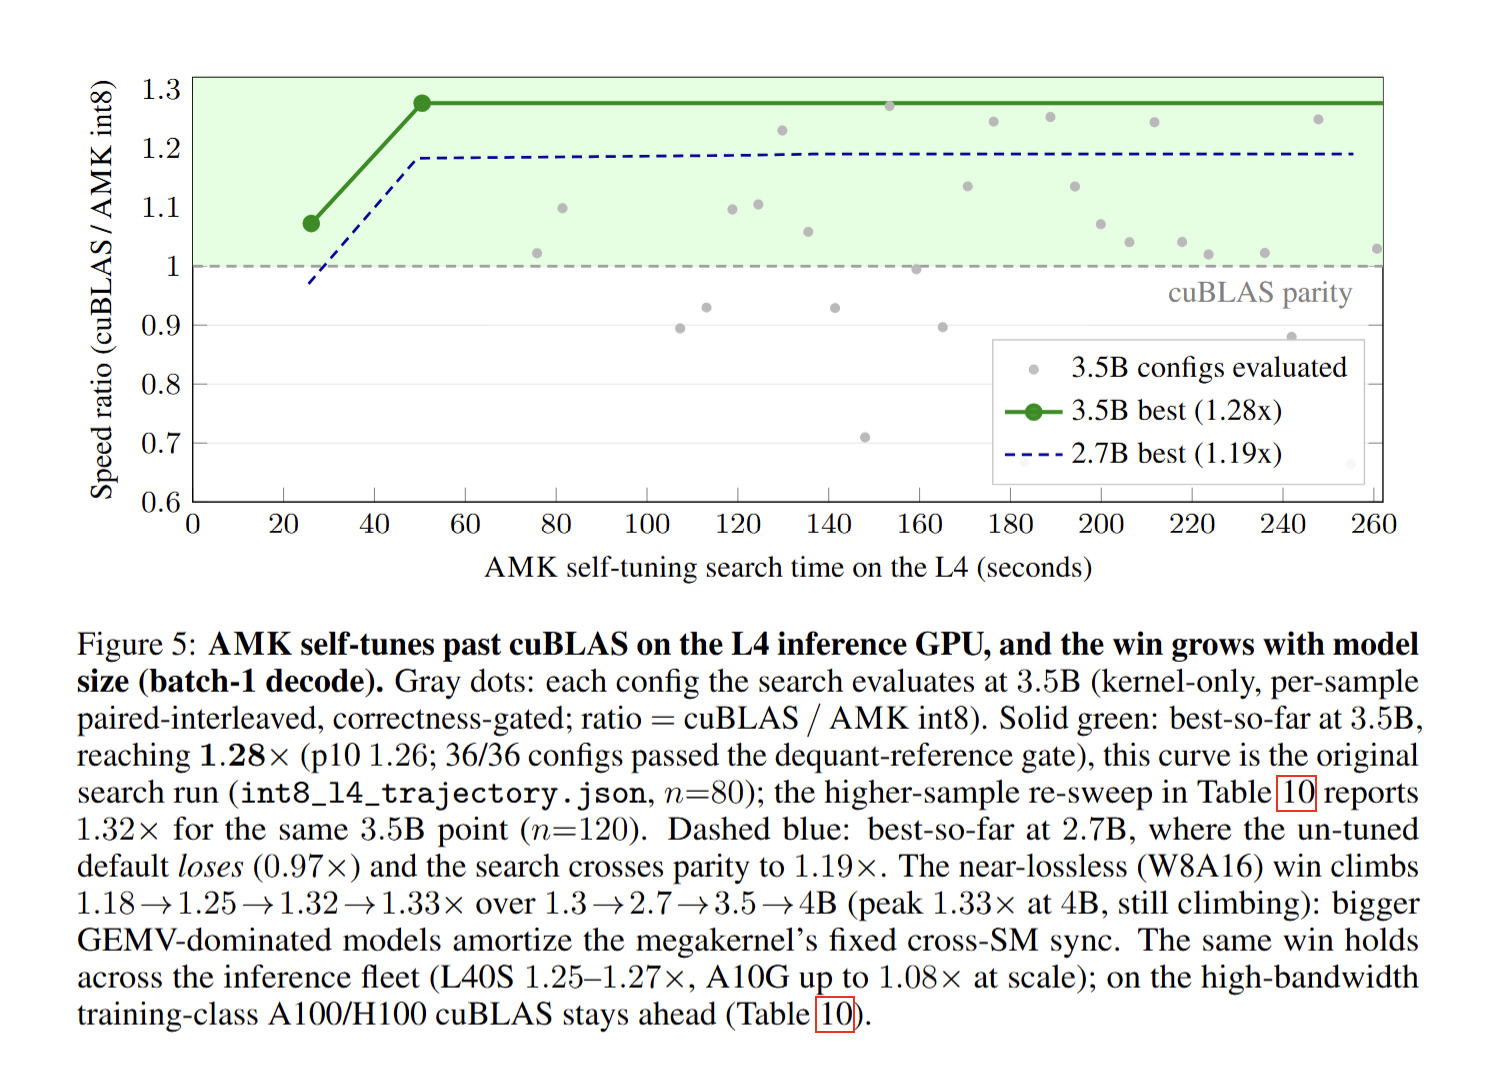
An agent harness that compiles a model into one provably-correct, self-retargeting CUDA megakernel and self-tunes it past cuBLAS at batch-1 LLM decode, paper: https://arxiv.org/abs/2606.09682
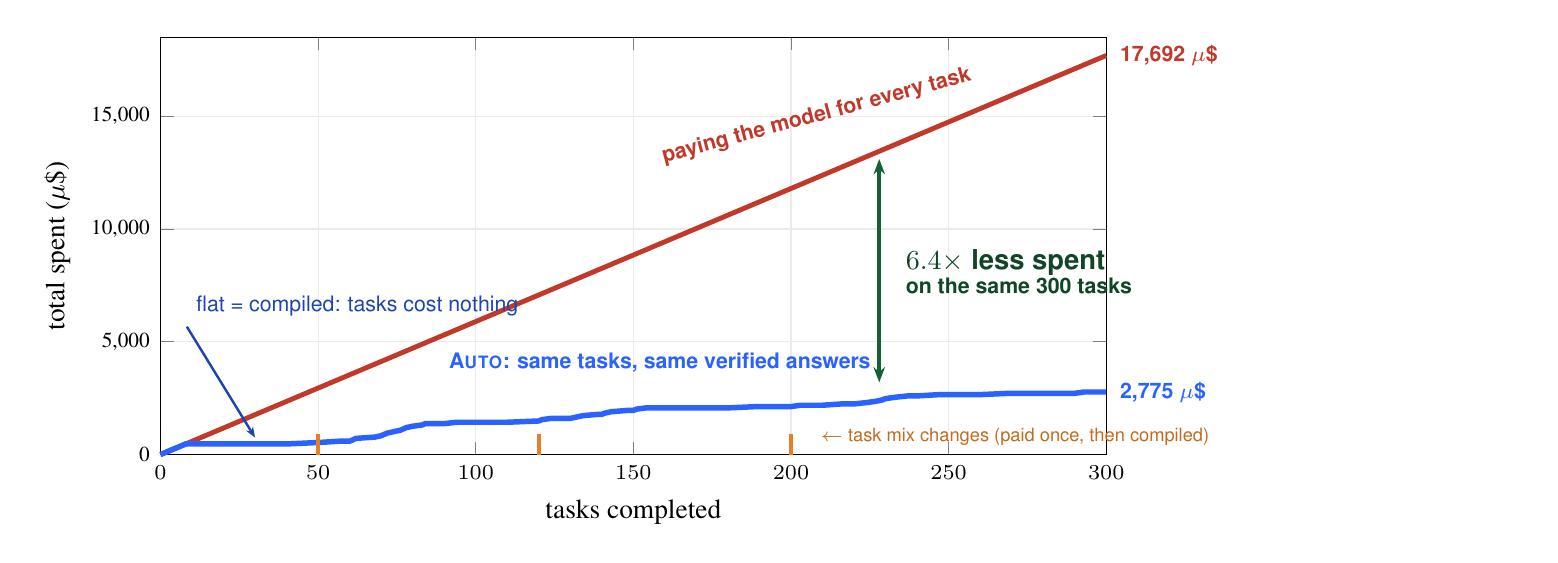
the agi compiler: records llm agent behavior, proves what repeats, and compiles it into verified, sandboxed wasm binaries that run for microdollars. nothing figured out twice, paper: https://arxiv.org/abs/2607.04542
Comprehensive GPU specifications database with 2,824 GPUs across NVIDIA, AMD, and Intel