echarts-map-demo
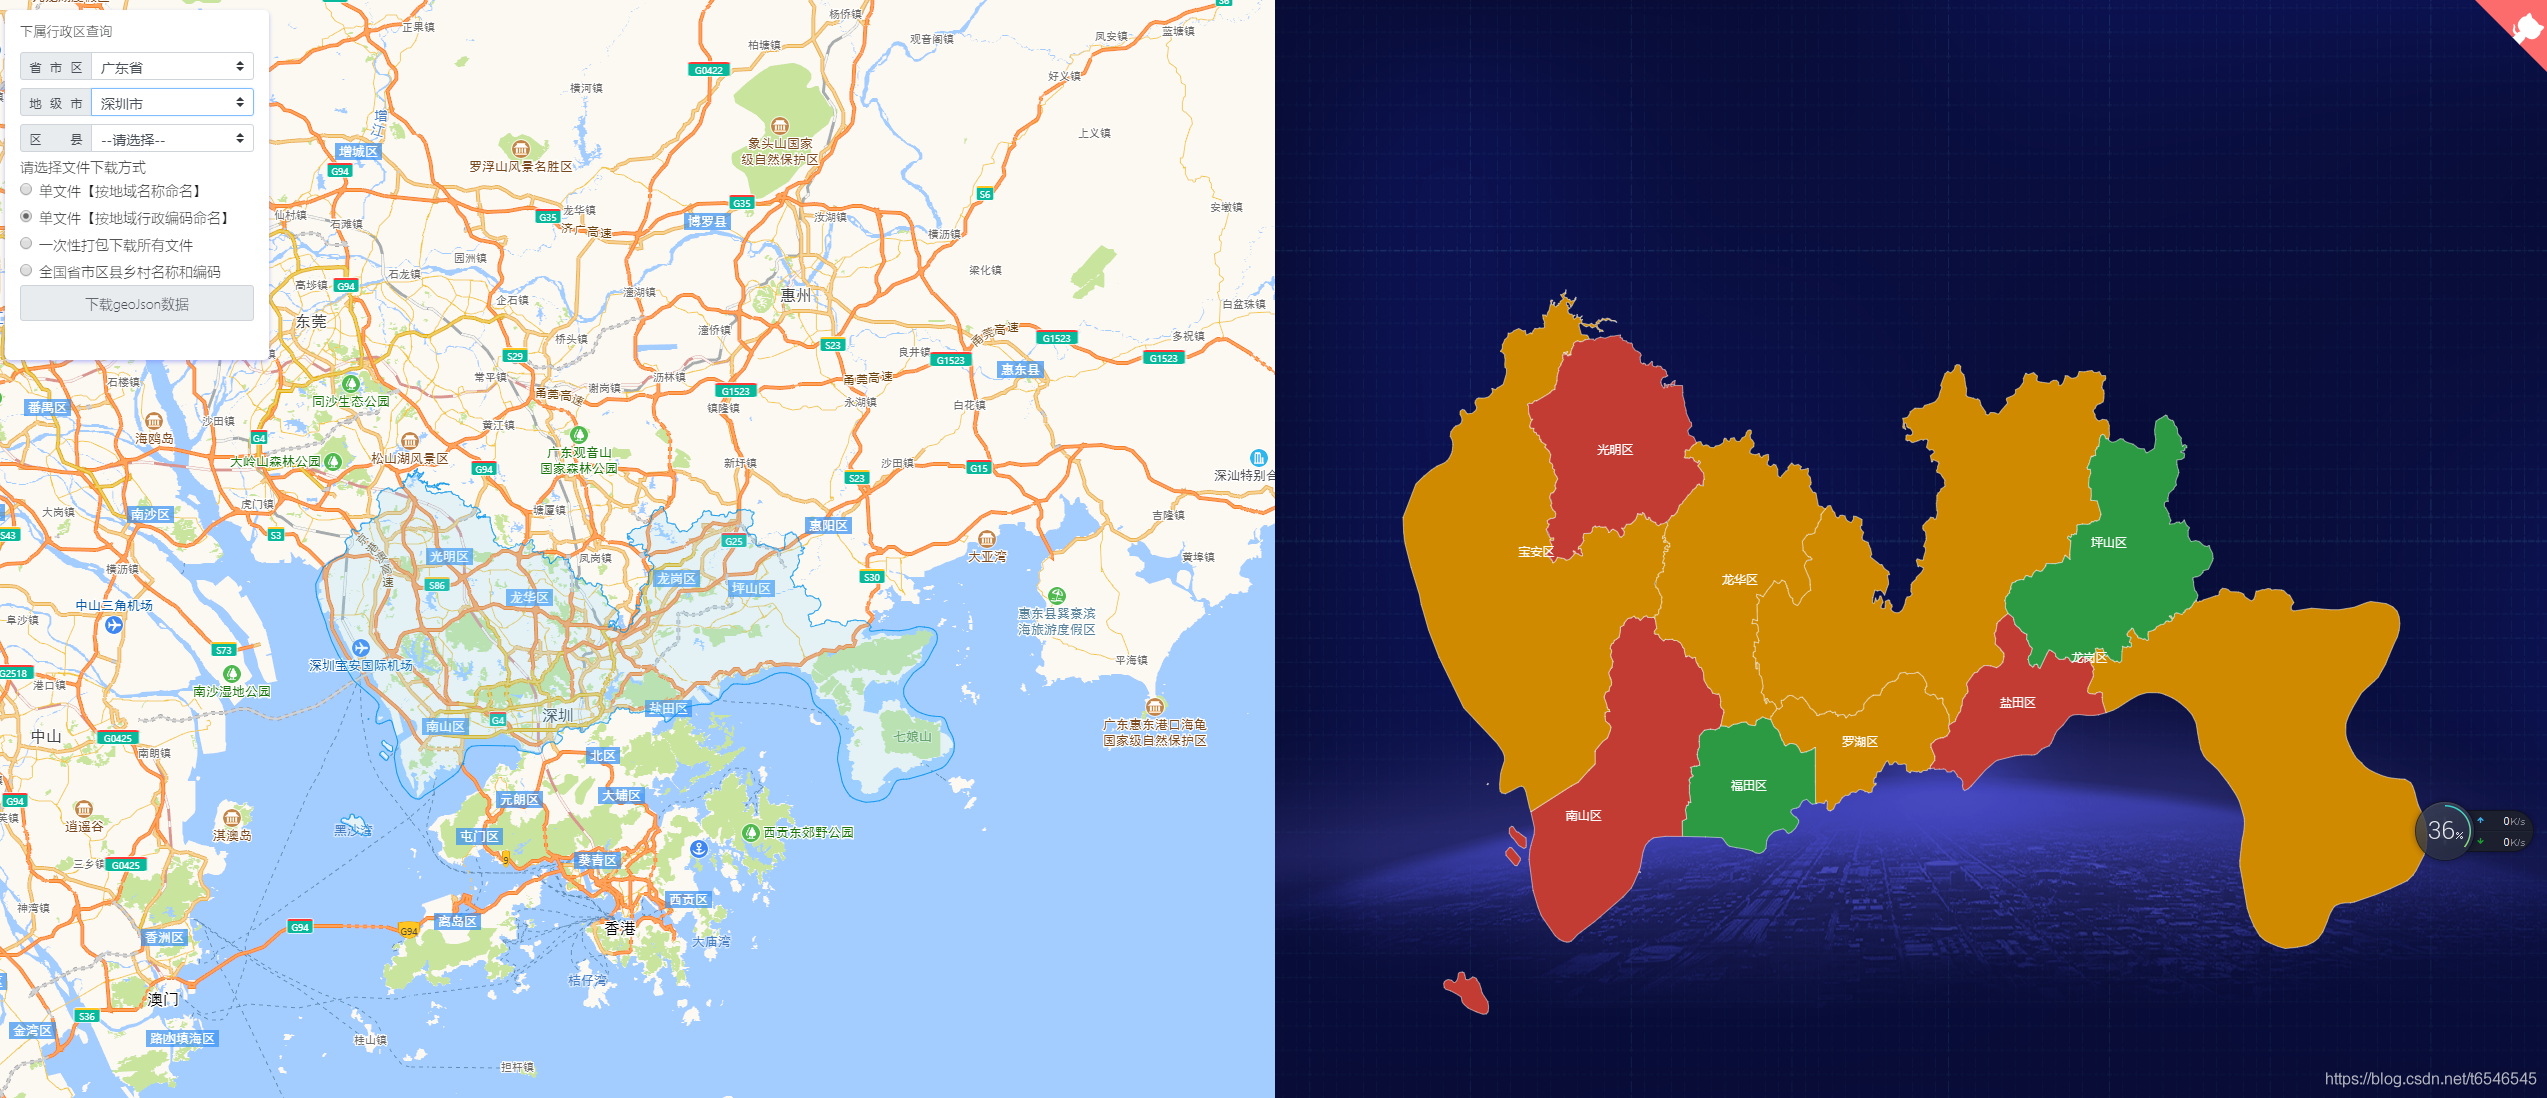
适用于echarts、QGIS等地图geoJson行政区划边界数据的实时获取与应用,json格式数据,全国省市区县多级联动下钻,真正意义的下钻至县级【附最新全国省市区县乡镇三级或四级城市geoJson文件下载,另可下载四级联动或五级(村级)行政编码对应关系】
- 2.2k
- Vue
- 3 wk ago
Open source tools, tips and tricks for mapping lovers
Repo TheBeachLab/mapping, read from GitHub 9 min ago. TheBeachLab has not joined Take My Repo.
TheBeachLab/mapping is a public repo on GitHub by TheBeachLab. Open source tools, tips and tricks for mapping lovers. It declares the GPL-3.0 license on GitHub. It has 1 stars and last changed on 2022-03-04. Nobody has reviewed it on Take My Repo yet, which says nothing about its quality. Read from GitHub on 2026-11-22.
Open source tools, tips and tricks for mapping lovers
Uninstall GDAL if present
Download the ERDAS ECW JP2 SDK v5.4 (or later) Linux
./ERDAS_ECWJP2_SDK-5.4.0.binsudo cp -r ~/hexagon/ERDAS-ECW_JPEG_2000_SDK-5.4.0/Desktop_Read-Only /usr/local/hexagonsudo rm -r /usr/local/hexagon/lib/x64sudo mv /usr/local/hexagon/lib/newabi/x64 /usr/local/hexagon/lib/x64sudo cp /usr/local/hexagon/lib/x64/release/libNCSEcw* /usr/local/libsudo ldconfig /usr/local/hexagonDownload and install MrSID DSDK
Build GDAL
./configure CXXFLAGS=-D_GLIBCXX_USE_CXX11_ABI=0 --with-ecw=/usr/local/hexagon --with-mrsid=~/MrSID_DSDK-9.5.4.4709-rhel6.x86-64.gcc531/Raster_DSDK --with-mrsid_lidar=~/MrSID_DSDK-9.5.4.4709-rhel6.x86-64.gcc531/Lidar_DSDK --without-libtoolmake cleanmake -j8sudo make installCheck the format is now supported:
gdalinfo --formats | grep -i ecw mrsid
There is an Arch Geo Tux repository with some useful packages. Add this repository to /etc/pacman.conf
[archgeotux]
SigLevel = Optional TrustAll
Server = https://downloads.sourceforge.net/project/archgeotux/$arch
Add the database file for this new repo sudo pacman -Sy
You need a digital elevation model (DEM) of the area you want to cover.
Following https://medium.com/@mbostock/command-line-cartography-part-1-897aa8f8ca2c
Projection obtained from https://github.com/veltman/d3-stateplane
API Key is required for US Census Data https://data.census.gov/cedsci/
curl 'https://www2.census.gov/geo/tiger/GENZ2020/shp/cb_2020_41_tract_500k.zip' -o cb_2020_41_tract_500k.zip

unzip cb_2020_41_tract_500k.zip

sudo npm install -g shapefile

shp2json cb_2020_41_tract_500k.shp -o or.json

sudo npm install -g d3-geo-projection

geoproject 'd3.geoConicConformal().parallels([44 + 20 / 60, 46]).rotate([120 + 30 / 60, 0]).fitSize([960, 960], d)' < or.json > or-albers.json

geo2svg -w 960 -h 960 < or-albers.json > or-albers.svg

sudo npm install -g ndjson-cli

ndjson-split 'd.features' < or-albers.json > or-albers.ndjson

ndjson-map 'd.id = d.properties.GEOID.slice(2), d' < or-albers.ndjson > or-albers-id.ndjson

curl 'https://api.census.gov/data/2020/dec/pl?get=P1_001N&for=tract:*&for=county:*&in=state:41&key=c925e274479a21b29ebd41d4e86516edfa1cd9efERASETHIS' -o or-county-populations.json

ndjson-cat or-county-populations.json | ndjson-split 'd.slice(1)' | ndjson-map '{id: d[2]+d[3],P1: +d[0]}' > or-county-populations.ndjson

ndjson-join 'd.id' or-albers-id.ndjson or-county-populations.ndjson > or-albers-join.ndjson

ndjson-map 'd[0].properties = {density: Math.floor(d[1].P1 / d[0].properties.ALAND * 2589975.2356)}, d[0]' < or-albers-join.ndjson > or-albers-density.ndjson

ndjson-reduce < or-albers-density.ndjson | ndjson-map '{type: "FeatureCollection", features: d}' > or-albers-density.json

sudo npm install -g d3@6.7

ndjson-map -r d3 '(d.properties.fill = d3.scaleSequential(d3.interpolateViridis).domain([0, 4000])(d.properties.density), d)' < or-albers-density.ndjson > or-albers-color.ndjson

geo2svg -n --stroke none -p 1 -w 960 -h 960 < or-albers-color.ndjson > or-albers-color.svg

sudo npm install -g topojson-client topojson-server topojson-simplify

geo2topo -n tracts=or-albers-density.ndjson > or-tracts-topo.json

toposimplify -p 1 -f < or-tracts-topo.json > or-simple-topo.json

topoquantize 1e5 < or-simple-topo.json > or-quantized-topo.json

topomerge -k 'd.id.slice(0,3)' counties=tracts < or-quantized-topo.json > or-merge-topo.json

topomerge --mesh -f 'a !== b' counties=counties < or-merge-topo.json > or-topo.json

topo2geo tracts=- < or-topo.json | ndjson-map -r d3 'z = d3.scaleSequential(d3.interpolateViridis).domain([0,4000]),d.features.forEach(f => f.properties.fill = z(f.properties.density)),d' | ndjson-split 'd.features' | geo2svg -n --stroke none -p 1 -w 960 -h 960 > or-tracts-color.svg

sudo npm install -g d3-scale-chromatic@2

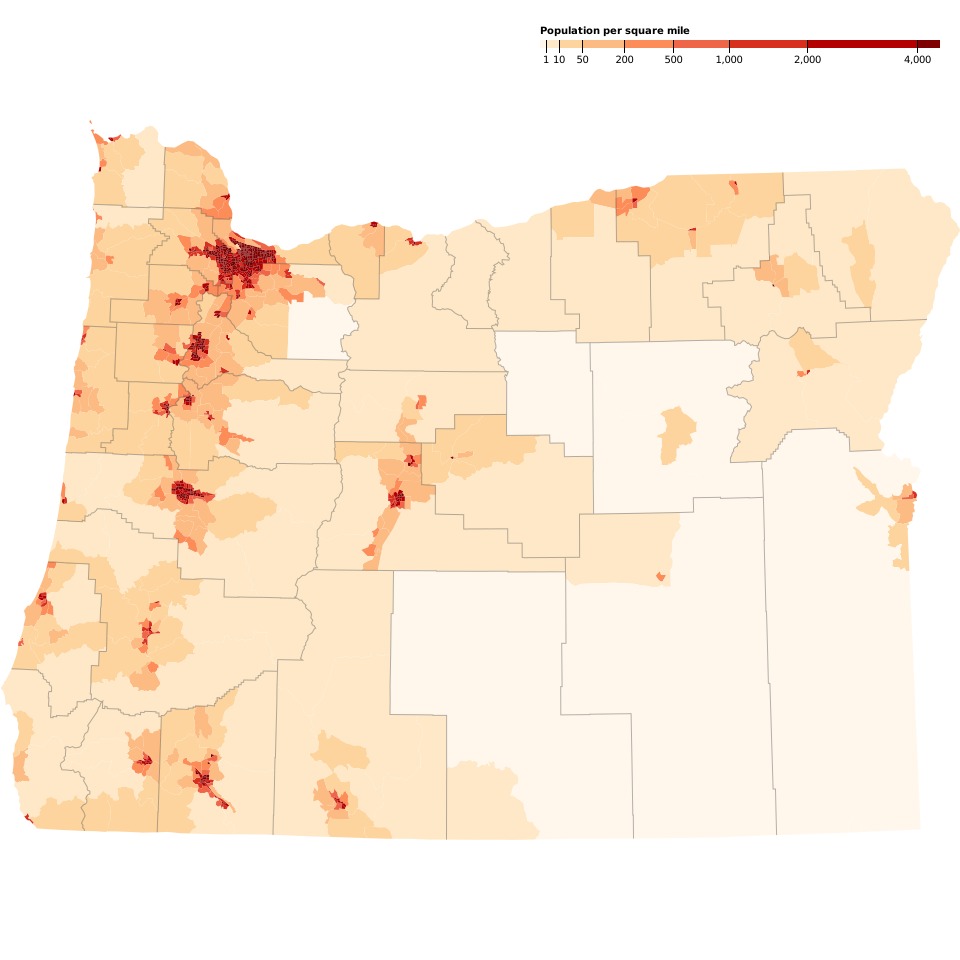
topo2geo tracts=- < or-topo.json | ndjson-map -r d3 -r d3-scale-chromatic 'z = d3.scaleThreshold().domain([1, 10, 50, 200, 500, 1000, 2000, 4000]).range(d3.schemeOrRd[9]),d.features.forEach(f => f.properties.fill = z(f.properties.density)),d' | ndjson-split 'd.features' | geo2svg -n --stroke none -p 1 -w 960 -h 960 > or-tracts-threshold.svg

(topo2geo tracts=- < or-topo.json | ndjson-map -r d3 -r d3-scale-chromatic 'z = d3.scaleThreshold().domain([1, 10, 50, 200, 500, 1000, 2000, 4000]).range(d3.schemeOrRd[9]),d.features.forEach(f => f.properties.fill = z(f.properties.density)),d' | ndjson-split 'd.features' ; topo2geo counties=- < or-topo.json | ndjson-map 'd.properties = {"stroke": "#000", "stroke-opacity": 0.3}, d') | geo2svg -n --stroke none -p 1 -w 960 -h 960 > or.svg
Create the legend:
<?xml version="1.0" encoding="utf-8"?>
<!DOCTYPE svg PUBLIC "-//W3C//DTD SVG 1.1//EN" "http://www.w3.org/Graphics/SVG/1.1/DTD/svg11.dtd">
<svg version="1.1" xmlns="http://www.w3.org/2000/svg" xmlns:xlink="http://www.w3.org/1999/xlink" width="960" height="1100" viewBox="0 0 960 1100" fill="none">
  <g transform="translate(540,40)" font-size="10" font-family="sans-serif" text-anchor="middle">
    <rect height="8" x="0" width="6" fill="#fff7ec"></rect>
    <rect height="8" x="6" width="13" fill="#fee8c8"></rect>
    <rect height="8" x="19" width="23" fill="#fdd49e"></rect>
    <rect height="8" x="42" width="42" fill="#fdbb84"></rect>
    <rect height="8" x="84" width="49" fill="#fc8d59"></rect>
    <rect height="8" x="133" width="56" fill="#ef6548"></rect>
    <rect height="8" x="189" width="78" fill="#d7301f"></rect>
    <rect height="8" x="267" width="110" fill="#b30000"></rect>
    <rect height="8" x="377" width="23" fill="#7f0000"></rect>
    <text x="0" y="-6" fill="#000" text-anchor="start" font-weight="bold">Population per square mile</text>
    <g transform="translate(6,0)">
      <line stroke="#000" y2="13" x1="0.5" x2="0.5"></line>
      <text fill="#000" y="16" x="0.5" dy="0.71em">1</text>
    </g>
    <g transform="translate(19,0)">
      <line stroke="#000" y2="13" x1="0.5" x2="0.5"></line>
      <text fill="#000" y="16" x="0.5" dy="0.71em">10</text>
    </g>
    <g transform="translate(42,0)">
      <line stroke="#000" y2="13" x1="0.5" x2="0.5"></line>
      <text fill="#000" y="16" x="0.5" dy="0.71em">50</text>
    </g>
    <g transform="translate(84,0)">
      <line stroke="#000" y2="13" x1="0.5" x2="0.5"></line>
      <text fill="#000" y="16" x="0.5" dy="0.71em">200</text>
    </g>
    <g transform="translate(133,0)">
      <line stroke="#000" y2="13" x1="0.5" x2="0.5"></line>
      <text fill="#000" y="16" x="0.5" dy="0.71em">500</text>
    </g>
    <g transform="translate(189,0)">
      <line stroke="#000" y2="13" x1="0.5" x2="0.5"></line>
      <text fill="#000" y="16" x="0.5" dy="0.71em">1,000</text>
    </g>
    <g transform="translate(267,0)">
      <line stroke="#000" y2="13" x1="0.5" x2="0.5"></line>
      <text fill="#000" y="16" x="0.5" dy="0.71em">2,000</text>
    </g>
    <g transform="translate(377,0)">
      <line stroke="#000" y2="13" x1="0.5" x2="0.5"></line>
      <text fill="#000" y="16" x="0.5" dy="0.71em">4,000</text>
    </g>
  </g>
</svg>
And insert the legend into the map
sed '$d' legend.svg && tail -n +4 < legend.svg >> or.svg
The result:
TheBeachLab/mapping is a public repo on GitHub by TheBeachLab. Open source tools, tips and tricks for mapping lovers.
It declares the GPL-3.0 license on GitHub.
Its maker has not tagged a system, so it is unknown here. Its README says what it needs.
Open "Take it" on its page: Take My Repo writes an install plan for your machine and hands it to your AI agent (Claude Code, Codex or Cursor), which asks you before each step. Take My Repo has not tested it on any machine.
Its last change on GitHub was on 2022-03-04. Take My Repo does not judge from that whether it is maintained.
Nobody has reviewed it on Take My Repo yet, which says nothing about its quality.
适用于echarts、QGIS等地图geoJson行政区划边界数据的实时获取与应用,json格式数据,全国省市区县多级联动下钻,真正意义的下钻至县级【附最新全国省市区县乡镇三级或四级城市geoJson文件下载,另可下载四级联动或五级(村级)行政编码对应关系】
Hunt down social media accounts by username across social networks
Official source code of FreeCAD, a free and opensource multiplatform 3D parametric modeler.
:house_with_garden: Open source home automation that puts local control and privacy first.
π RuView turns commodity WiFi signals into real-time spatial intelligence, vital sign monitoring, and presence detection — all without a single pixel of video.
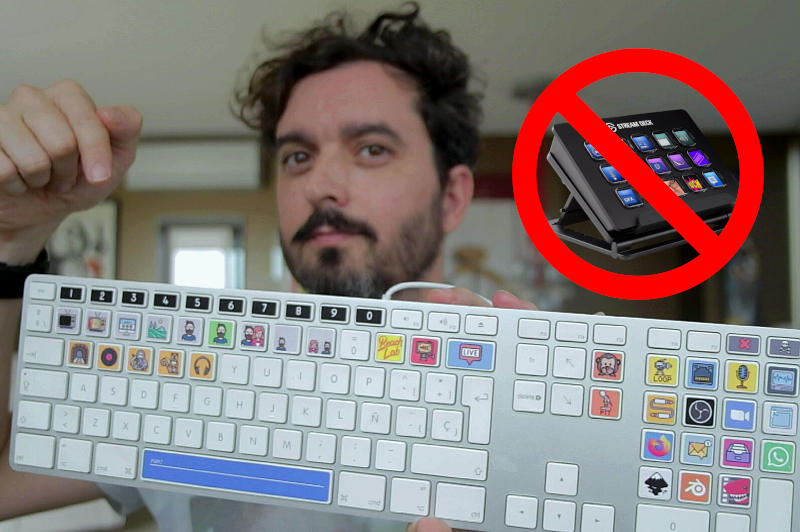
A free and open source alternative to elgato streamdeck using an old keyboard
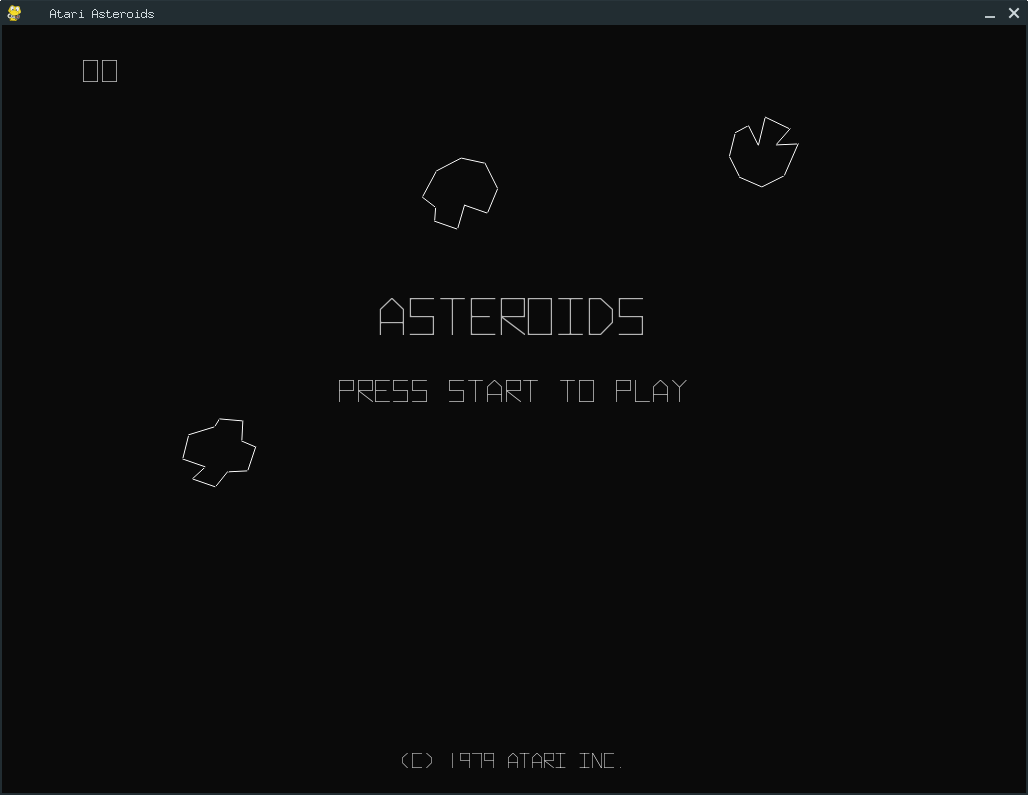
A Python 3 / Pygame port of the classic Atari Asteroids Arcade videogame
An attempt to create and exact vector clone of Atari's Lunar Lander using Pygame