
rea
Reverse engineer anything with agents, from app behavior down to native binaries.
- 473k
- TypeScript
- MIT
- 3 h ago
A lightweight, sampling-based CPU and memory profiler for Lua with FlameGraph and pprof support.
Repo esrrhs/pLua, read from GitHub 1 min ago. esrrhs has not joined Take My Repo.
esrrhs/pLua is a public repo on GitHub by esrrhs. A lightweight, sampling-based CPU and memory profiler for Lua with FlameGraph and pprof support. It declares the MIT license on GitHub. It is written mainly in C++, has 109 stars and last changed on 2026-11-10. Nobody has reviewed it on Take My Repo yet, which says nothing about its quality. Read from GitHub on 2026-11-22.
Lua Performance Profiler & Memory Profiler.
Similar to gperftools, pLua profiles CPU hotspots and memory allocations for Lua programs. Embed it as a shared library, collect .pro profiles, then convert them with tools/plua for FlameGraph SVGs or pprof-compatible call graphs.
Chinese documentation: README_CN.md
ITIMER_PROF / SIGPROF ticks and safe-context Lua stack snapshots, including CPU-bound C calls. Windows (or forced fallback) samples VM instruction counts, not C CPU time. See precision limits below.lua_State has its own profiler session. You can profile several states in one process. Multi-state is not multi-OS-thread safe — keep profiling on one OS thread; see the process-CPU caveat below.set_config / get_config, environment variables, and optional rate arguments on start / start_mem.status() reports whether CPU/mem are running, sample counts, output paths, backend, and a config snapshot. close() tears down the session for the current lua_State.pprof (gperftools) and FlameGraph collapsed stacks / SVGs.| Platform | Library artifact | CPU backend | hookso injection | Notes |
|---|---|---|---|---|
| Linux | bin/libplua.so |
SIGPROF (default) or LUA_MASKCOUNT |
Supported | Primary platform |
| macOS | bin/libplua.so (also loadable as .dylib via cpath) |
SIGPROF (default) or count |
Not supported | Embedding OK |
| Windows | bin/libplua.dll |
LUA_MASKCOUNT |
Not supported | Embedding OK |
pLua targets Lua 5.2 / 5.3 / 5.4 (uses luaL_newlib / luaL_checkversion / luaL_requiref).
Lua 5.1 and LuaJIT are not supported by the current module loader API.
sudo apt-get update
sudo apt-get install -y lua5.3 liblua5.3-dev
sudo yum install -y lua-devel
brew install lua
Install Lua 5.4 development headers/libs (vcpkg, Chocolatey, or a manual build), then point CMake at them via LUA_INCLUDE_DIR / LUA_LIBRARIES if needed.
mkdir build && cd build
cmake .. -DCMAKE_BUILD_TYPE=Release
cmake --build .
Artifacts land in bin/:
libplua.solibplua.dllplua profile converter (tools/plua.go)cd build
ctest --output-on-failureOr run the Lua unit test directly (after build):
cd test
lua test_unit.lua
Multi-lua_State coverage is in the C++ harness (unit_test / unit_test --multistate).
local p = require "libplua"   -- preferred (matches libplua.so / .dll)
-- If you ship a copy/symlink named plua.so, require "plua" also works (luaopen_plua).
Add the library directory to package.cpath as needed:
package.cpath = "./bin/?.so;./bin/?.dylib;./bin/?.dll;" .. package.cpath
local p = require "libplua"

-- Arg 1: sampling duration in seconds (0 = until stopped)
-- Arg 2: output profile file path
-- Arg 3 (optional): CPU sample interval in milliseconds
--                   (updates global default; else PLUA_CPU_INTERVAL_MS / 10)
p.start(0, "call.pro")
-- p.start(0, "call.pro", 5)

do_some_thing()

p.stop()
# a) Obtain a lua_State* in the target process
./hookso arg $PID xxx.so lua_settop 1
# -> prints L, e.g. 123456

# b) Load libplua.so
./hookso dlopen $PID ./libplua.so

# c) Start CPU profiling: lrealstart(L, seconds, path)
./hookso call $PID libplua.so lrealstart i=123456 i=0 s="./call.pro"

# d) Stop CPU profiling
./hookso call $PID libplua.so lrealstop i=123456
hookso injection is not supported on macOS or Windows — use embedding there.
local p = require "libplua"

-- Arg 1: max samples (0 = until stopped)
-- Arg 2: output prefix -> <prefix>_ALLOC_SIZE.pro and <prefix>_USAGE.pro
-- Arg 3 (optional): sampling rate in bytes
--                   (updates global default; else PLUA_MEM_RATE / 524288)
p.start_mem(0, "mem.pro")
-- p.start_mem(0, "mem.pro", 262144)

do_some_thing()
collectgarbage("collect")  -- optional, for retained-memory (_USAGE) view
p.stop_mem()
./hookso arg $PID xxx.so lua_settop 1
./hookso dlopen $PID ./libplua.so
./hookso call $PID libplua.so lrealstartmem i=123456 i=0 s="./mem.pro"
./hookso call $PID libplua.so lrealstopmem i=123456
lua_StateEach state keeps an independent session (CPU and/or mem). Stopping one state does not stop others.
-- In host C/C++: create L1, L2, require libplua in each, call start/stop per state.Thread safety: use one OS thread for all pLua/Lua activity. Sessions and attribution snapshots are not thread-safe. The POSIX timer measures process CPU: other CPU-active native threads can contaminate attribution even if Lua access is externally locked. All concurrent SIGPROF sessions must use the same interval; conflicting starts return an error.
lua_sethook exclusivity. pLua installs its own debug hook via lua_sethook for CPU sampling (and briefly when arming mem samples). It expects exclusive ownership of the hook on that lua_State while profiling:
lua_sethook on the same state at the same time — they will overwrite each other and produce wrong or missing samples (or break the other tool).stop / stop_mem / close) before attaching a different hook-based tool.Coroutines. Lua 5.2–5.4 may copy debug hooks to newly created threads, but that does not create a pLua session. Explicitly call start / stop inside every coroutine you want to profile. Enrolled coroutines are kept alive until stop/close or global lua_close.
coroutine.resume / the C bridge. Enroll them explicitly or exclude such workloads when interpreting the parent profile.Session cleanup: stop/close unregisters only that session; per-thread registry anchors also clean up active sessions on global lua_close. Stopping one coroutine does not invalidate another's anchor.
C-time precision (POSIX). Call, return and count hooks snapshot recoverable Lua/main frames, skipping C frames, in a normal VM context. The signal handler only increments a lock-free counter: no Lua APIs, allocations, locks, session-map iteration, or native unwinding. At the next boundary, all delivered ticks are charged to the previous snapshot before installing the new one. Thus a long C call retains multiple ticks and bills its Lua caller, not unrelated Lua work after its return; Lua→C→Lua callbacks update attribution at entry/return. A direct C lrealstop(L) also drains pending ticks and flushes; call it only on the VM thread in a safe context, never from a signal handler.
This is not an exact interrupted-stack sampler like vLua's VM-internal approach: snapshots can be stale between hooks, error unwinds/continuations can skip return hooks, and hook execution itself adds overhead (especially call-heavy/deep-stack code). POSIX signals can coalesce in the kernel, and blocked/delayed signals cannot be reconstructed. Pure C with no recoverable Lua frame is excluded. Host CPU between observed VM exits/entries is excluded when no owner exists, but unobserved transitions have the limits above. pLua owns SIGPROF / ITIMER_PROF; do not combine it with another user of them. Profiles estimate CPU time as delivered ticks × configured interval, not exact elapsed time. Count backend samples only Lua VM instructions and cannot measure time spent in C.
local st = p.status()
-- st.cpu_running / st.mem_running  (boolean)
-- st.cpu_samples / st.mem_samples  (number, samples collected so far)
-- st.cpu_output / st.mem_output    (path or nil)
-- st.cpu_backend                   ("sigprof" or "count")
-- st.config                        (same shape as get_config())

p.close()  -- stop cpu+mem if needed and free the session for this state
On start failure, start / start_mem return -1 plus an error string as the second result (e.g. already running, missing path).
Lua API:
p.set_config({
  cpu_interval_ms = 10,   -- SIGPROF interval (POSIX)
  cpu_hook_count = 1000,  -- LUA_MASKCOUNT step (Windows / fallback)
  mem_rate = 524288,      -- bytes between mem samples
  cpu_backend = "sigprof" -- or "count" / "maskcount"
})

local cfg = p.get_config()
print(cfg.cpu_backend, cfg.cpu_interval_ms, cfg.cpu_hook_count, cfg.mem_rate)
Environment variables (read once at first use of start / config APIs):
| Variable | Meaning | Default |
|---|---|---|
PLUA_CPU_INTERVAL_MS |
POSIX timer interval (ms) | 10 |
PLUA_CPU_HOOK_COUNT |
LUA_MASKCOUNT instructions per sample |
1000 |
PLUA_MEM_RATE |
Memory sampling period (bytes) | 524288 |
PLUA_CPU_BACKEND |
sigprof or count / maskcount |
sigprof on POSIX, always count on Windows |
.pro file format (CPU v2, memory v1)All integers in the existing little-endian format are 32-bit. CPU v2 starts with six uint32 words: magic 0x41554C50 (PLUA), version 2, kind 1 (CPU), backend 1 (SIGPROF) / 2 (count), interval in ms, and nominal VM hook instruction step. This metadata prevents guessing CPU units from filenames. Memory output remains v1 (magic + version 1); v0 has no header.
The payload is unchanged: records contain count/weight, depth and 64 root-first frame IDs; the trailing string table contains (name bytes, byte length, ID) entries followed by entry count. Empty CPU profiles have a valid trailing table. SIGPROF weights count delivered ticks, count weights count hook samples, and memory weights are sampled allocation bytes / estimated live bytes. tools/plua reads v0/v1/v2, rejects unknown versions and malformed/truncated records. Old converters must be updated to read v2.
tools/pluaGo converter (built to bin/plua when Go is available):
# FlameGraph collapsed stacks
./bin/plua -i call.pro -flame call.fl

# Legacy gperftools symbolized profile (-pprof remains unchanged)
./bin/plua -i call.pro -pprof call.prof

# Modern gzip profile.proto (CPU v2 only, no third-party Go dependencies)
./bin/plua -i call.pro -proto call.pb.gz
go tool pprof -top call.pb.gz
go tool pprof -sample_index=samples -top call.pb.gz

# Multiple outputs
./bin/plua -i call.pro -flame call.fl -proto call.pb.gz -pprof call.prof
-collapsed is an alias for -flame. -proto emits leaf-first stacks with valid function/location IDs and string-table index 0 empty. SIGPROF exports samples/count plus estimated cpu/nanoseconds, a CPU period, and count × interval weights. Count backend exports only samples/count, with nominal instructions/count period—never fabricated CPU nanoseconds. Simultaneous memory profiling can shorten some count-hook intervals. No timestamps/duration are invented.
-proto deliberately rejects memory and legacy/v1 files: those lack reliable type/backend/period metadata. Keep using -flame / legacy -pprof for these; memory values must be interpreted as bytes, not CPU samples/time. Existing show.sh continues to use legacy output.
cmake -S . -B build -DBUILD_TESTING=ON
cmake --build build -j2
ctest --test-dir build --output-on-failure
(cd tools && go test ./... -v)
# Optional statistical experiment; NOT a timing threshold in CI:
./bin/precision_test --experiment
The deterministic suite injects delivered SIGPROF ticks and checks exact weights/leaf attribution: long C-boundary batches, C→Lua callbacks, pending-stop drain, erased tail callers, repeated coroutine resume, global close/restart and independent states. Windows runs count-backend checks only. Converter tests check metadata, units, stack order, IDs, truncation/malformed input, legacy/flame output, and invoke real go tool pprof -top on generated CPU/count fixtures. The optional experiment burns 600ms of C CPU and reports nominal 60-tick bias without flaky statistical assertions.
show.sh fetches flamegraph.pl if neededdot)go install github.com/google/pprof@latestcd tools
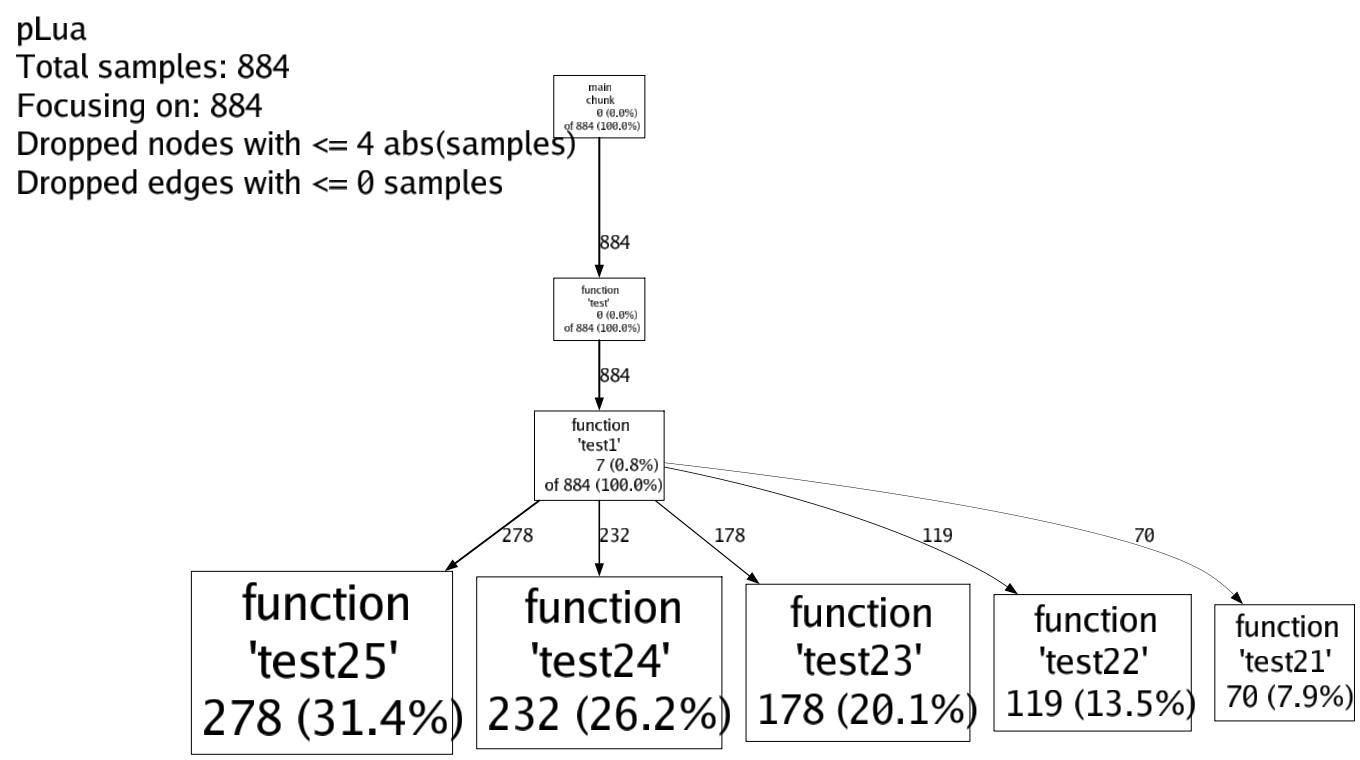
./show.sh ../testOutputs per .pro: .fl (collapsed), .svg (flamegraph), .prof (pprof), and optionally .dot / .png call graphs.


esrrhs/pLua is a public repo on GitHub by esrrhs. A lightweight, sampling-based CPU and memory profiler for Lua with FlameGraph and pprof support.
It declares the MIT license on GitHub.
Its maker tagged it for macOS, Windows and Linux, or as Docker or cross-platform. That is declared by the maker; Take My Repo has not tested it.
Open "Take it" on its page: Take My Repo writes an install plan for your machine and hands it to your AI agent (Claude Code, Codex or Cursor), which asks you before each step. Take My Repo has not tested it on any machine.
Its last change on GitHub was on 2026-11-10. GitHub counts 0 open issues and pull requests. Take My Repo does not judge from that whether it is maintained.
Nobody has reviewed it on Take My Repo yet, which says nothing about its quality.
Reverse engineer anything with agents, from app behavior down to native binaries.
DEPRECATED StackImpact Python Profiler - Production-Grade Performance Profiler: CPU, memory allocations, blocking calls, exceptions, metrics, and more
A debugging and profiling tool that can trace and visualize python code execution
Perforator is a cluster-wide continuous profiling tool designed for large data centers
A versatile, high-performance network proxy and traffic-forwarding tool written in Go
High-performance Mahjong win detection, waiting-hand calculation and AI discard algorithm based on lookup tables, with behavior-identical Java / Go / C++ implementations and a live web demo.