scalene
Scalene: a high-performance, high-precision CPU, GPU, and memory profiler for Python with AI-powered optimization proposals
- 14k
- Python
- Apache-2.0
- 3 d ago
Scalene: a high-performance, high-precision CPU, GPU, and memory profiler for Python with AI-powered optimization proposals
A simple & straight-to-the-point PHP profiling extension with its built-in web UI
Automatically monitor the evolving performance of Flask/Python web services.
plpgsql_check is a linter tool (does source code static analyze) for the PostgreSQL language plpgsql (the native language for PostgreSQL store procedures).
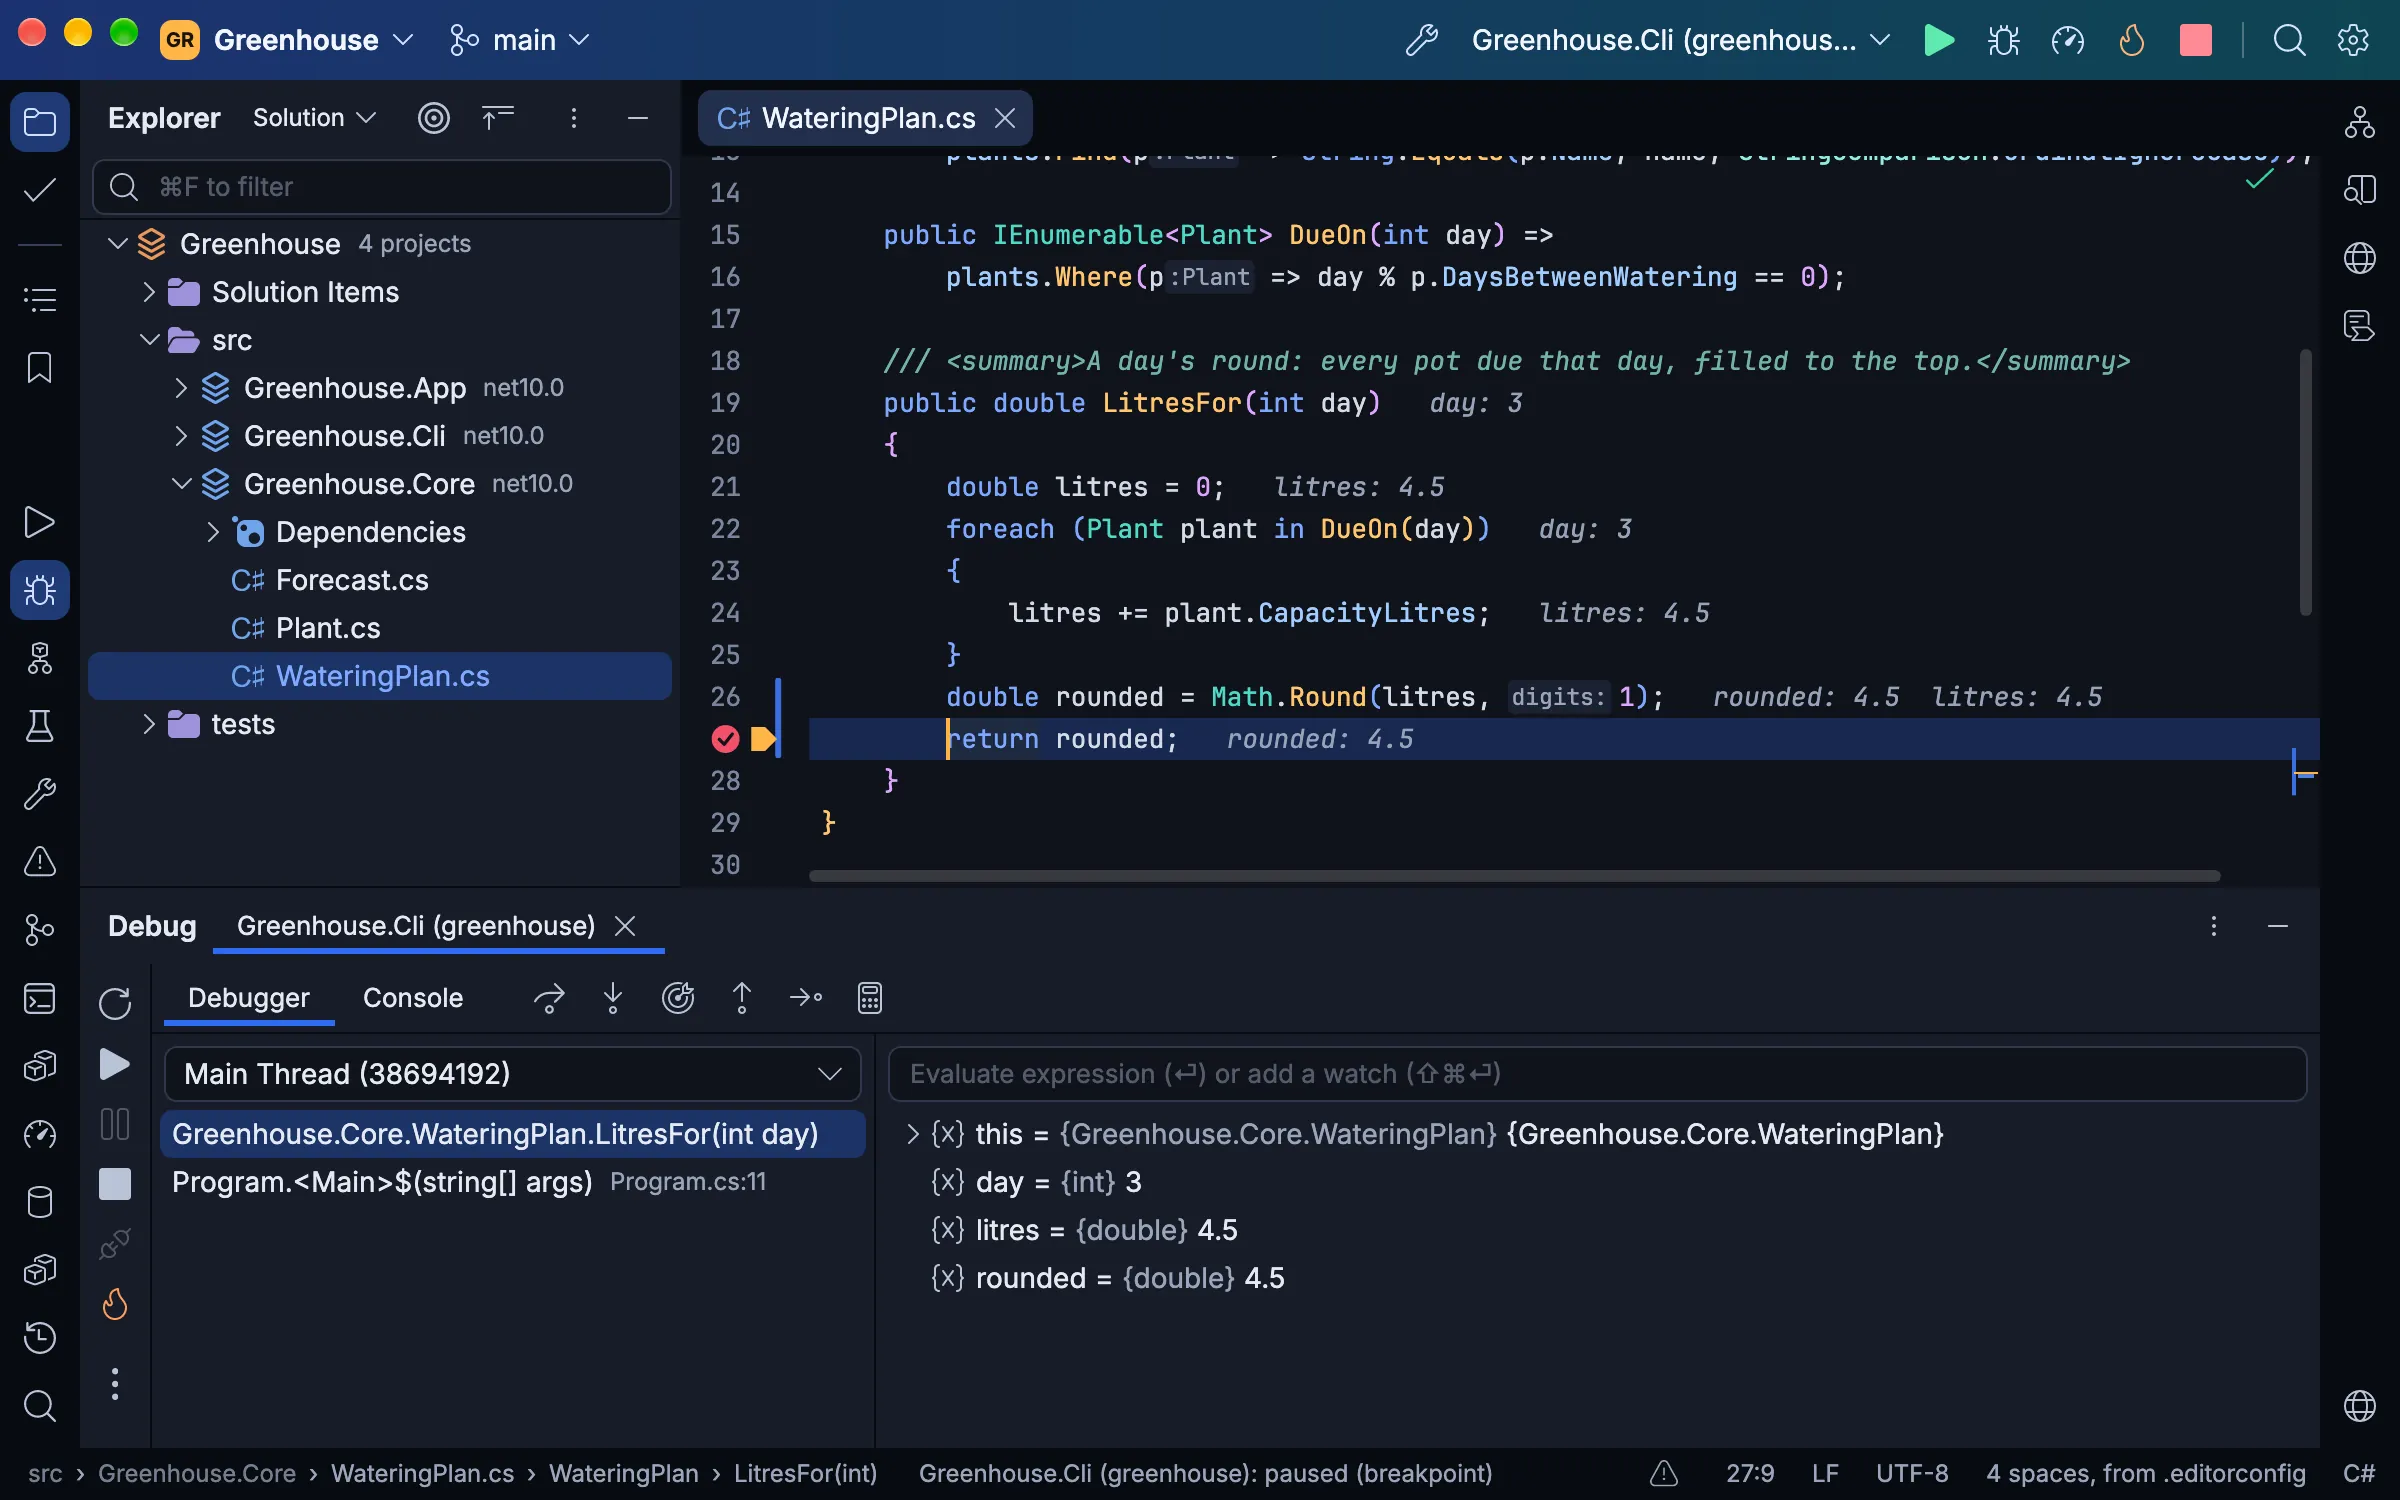
An open-source IDE for C# and .NET, built with Avalonia, for Windows, macOS and Linux: a Roslyn-powered editor, its own debugger with Hot Reload, a CPU and memory profiler, XAML tooling for Avalonia and WPF, and an MCP server for coding agents.
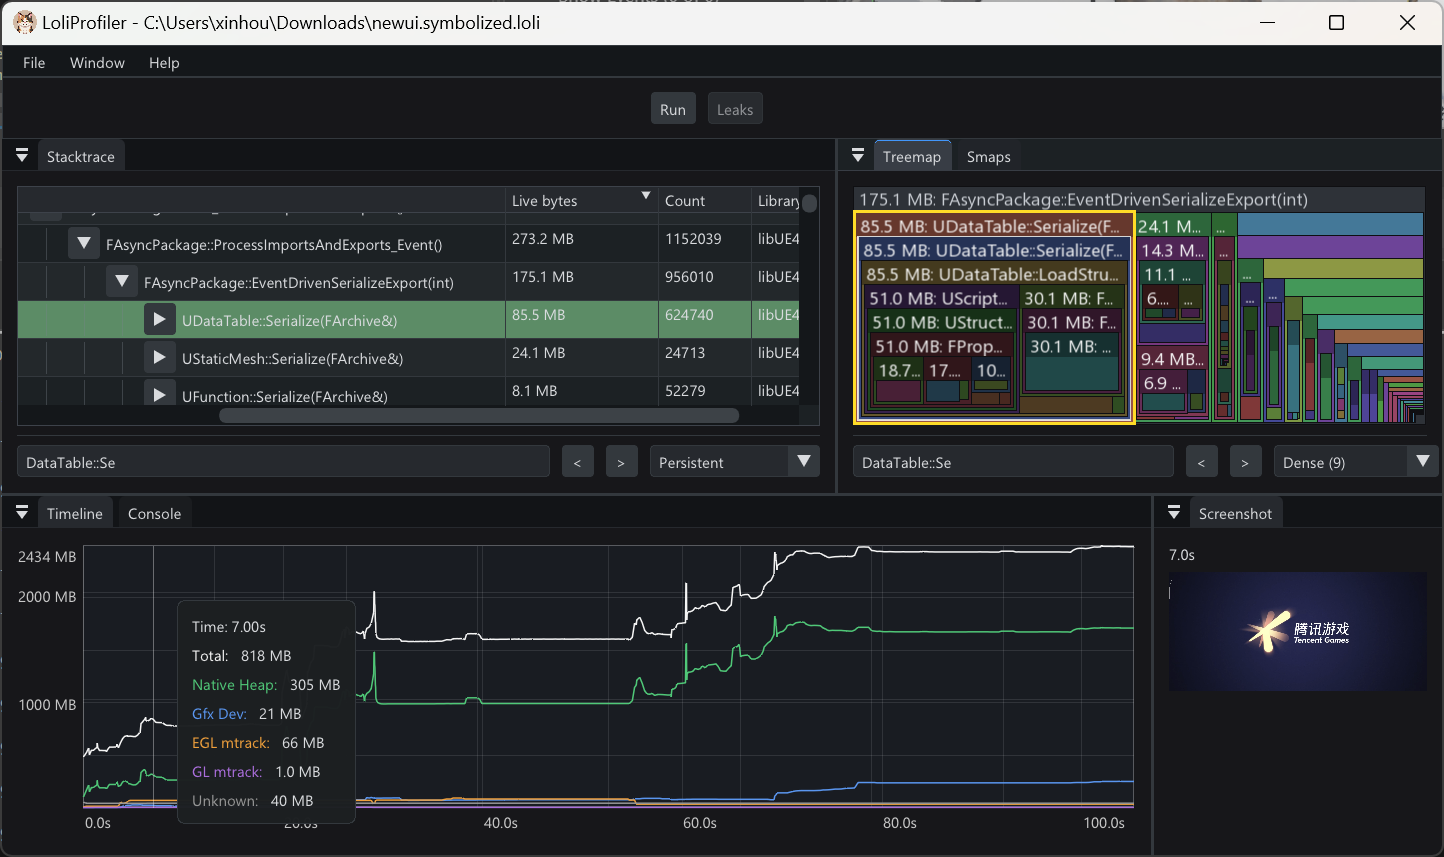
Memory instrumentation tool with CI and AI support for android app&game developers.
A sampling profiler or a memory usage profiler for PHP written in PHP, which reads information about running PHP VM from outside the process. You can find performance bottlenecks or memory leaks of your scripts without changing the target script or loading extensions.
Runtime evidence that helps agents trace, profile, and burn down hotspots in application and native code, GPU kernels, and inference stacks.
The Radeon Compute Profiler (RCP) is a performance analysis tool that gathers data from the API run-time and GPU for OpenCL™ and ROCm/HSA applications. This information can be used by developers to discover bottlenecks in the application and to find ways to optimize the application's performance.
Measures empirical computational complexity (in both time and space) of functions
An easy to use customizable django profiling middleware to profile and find bottlenecks in your code and custom middlewares
A Moodle tool to find bottlenecks in your code safely in production
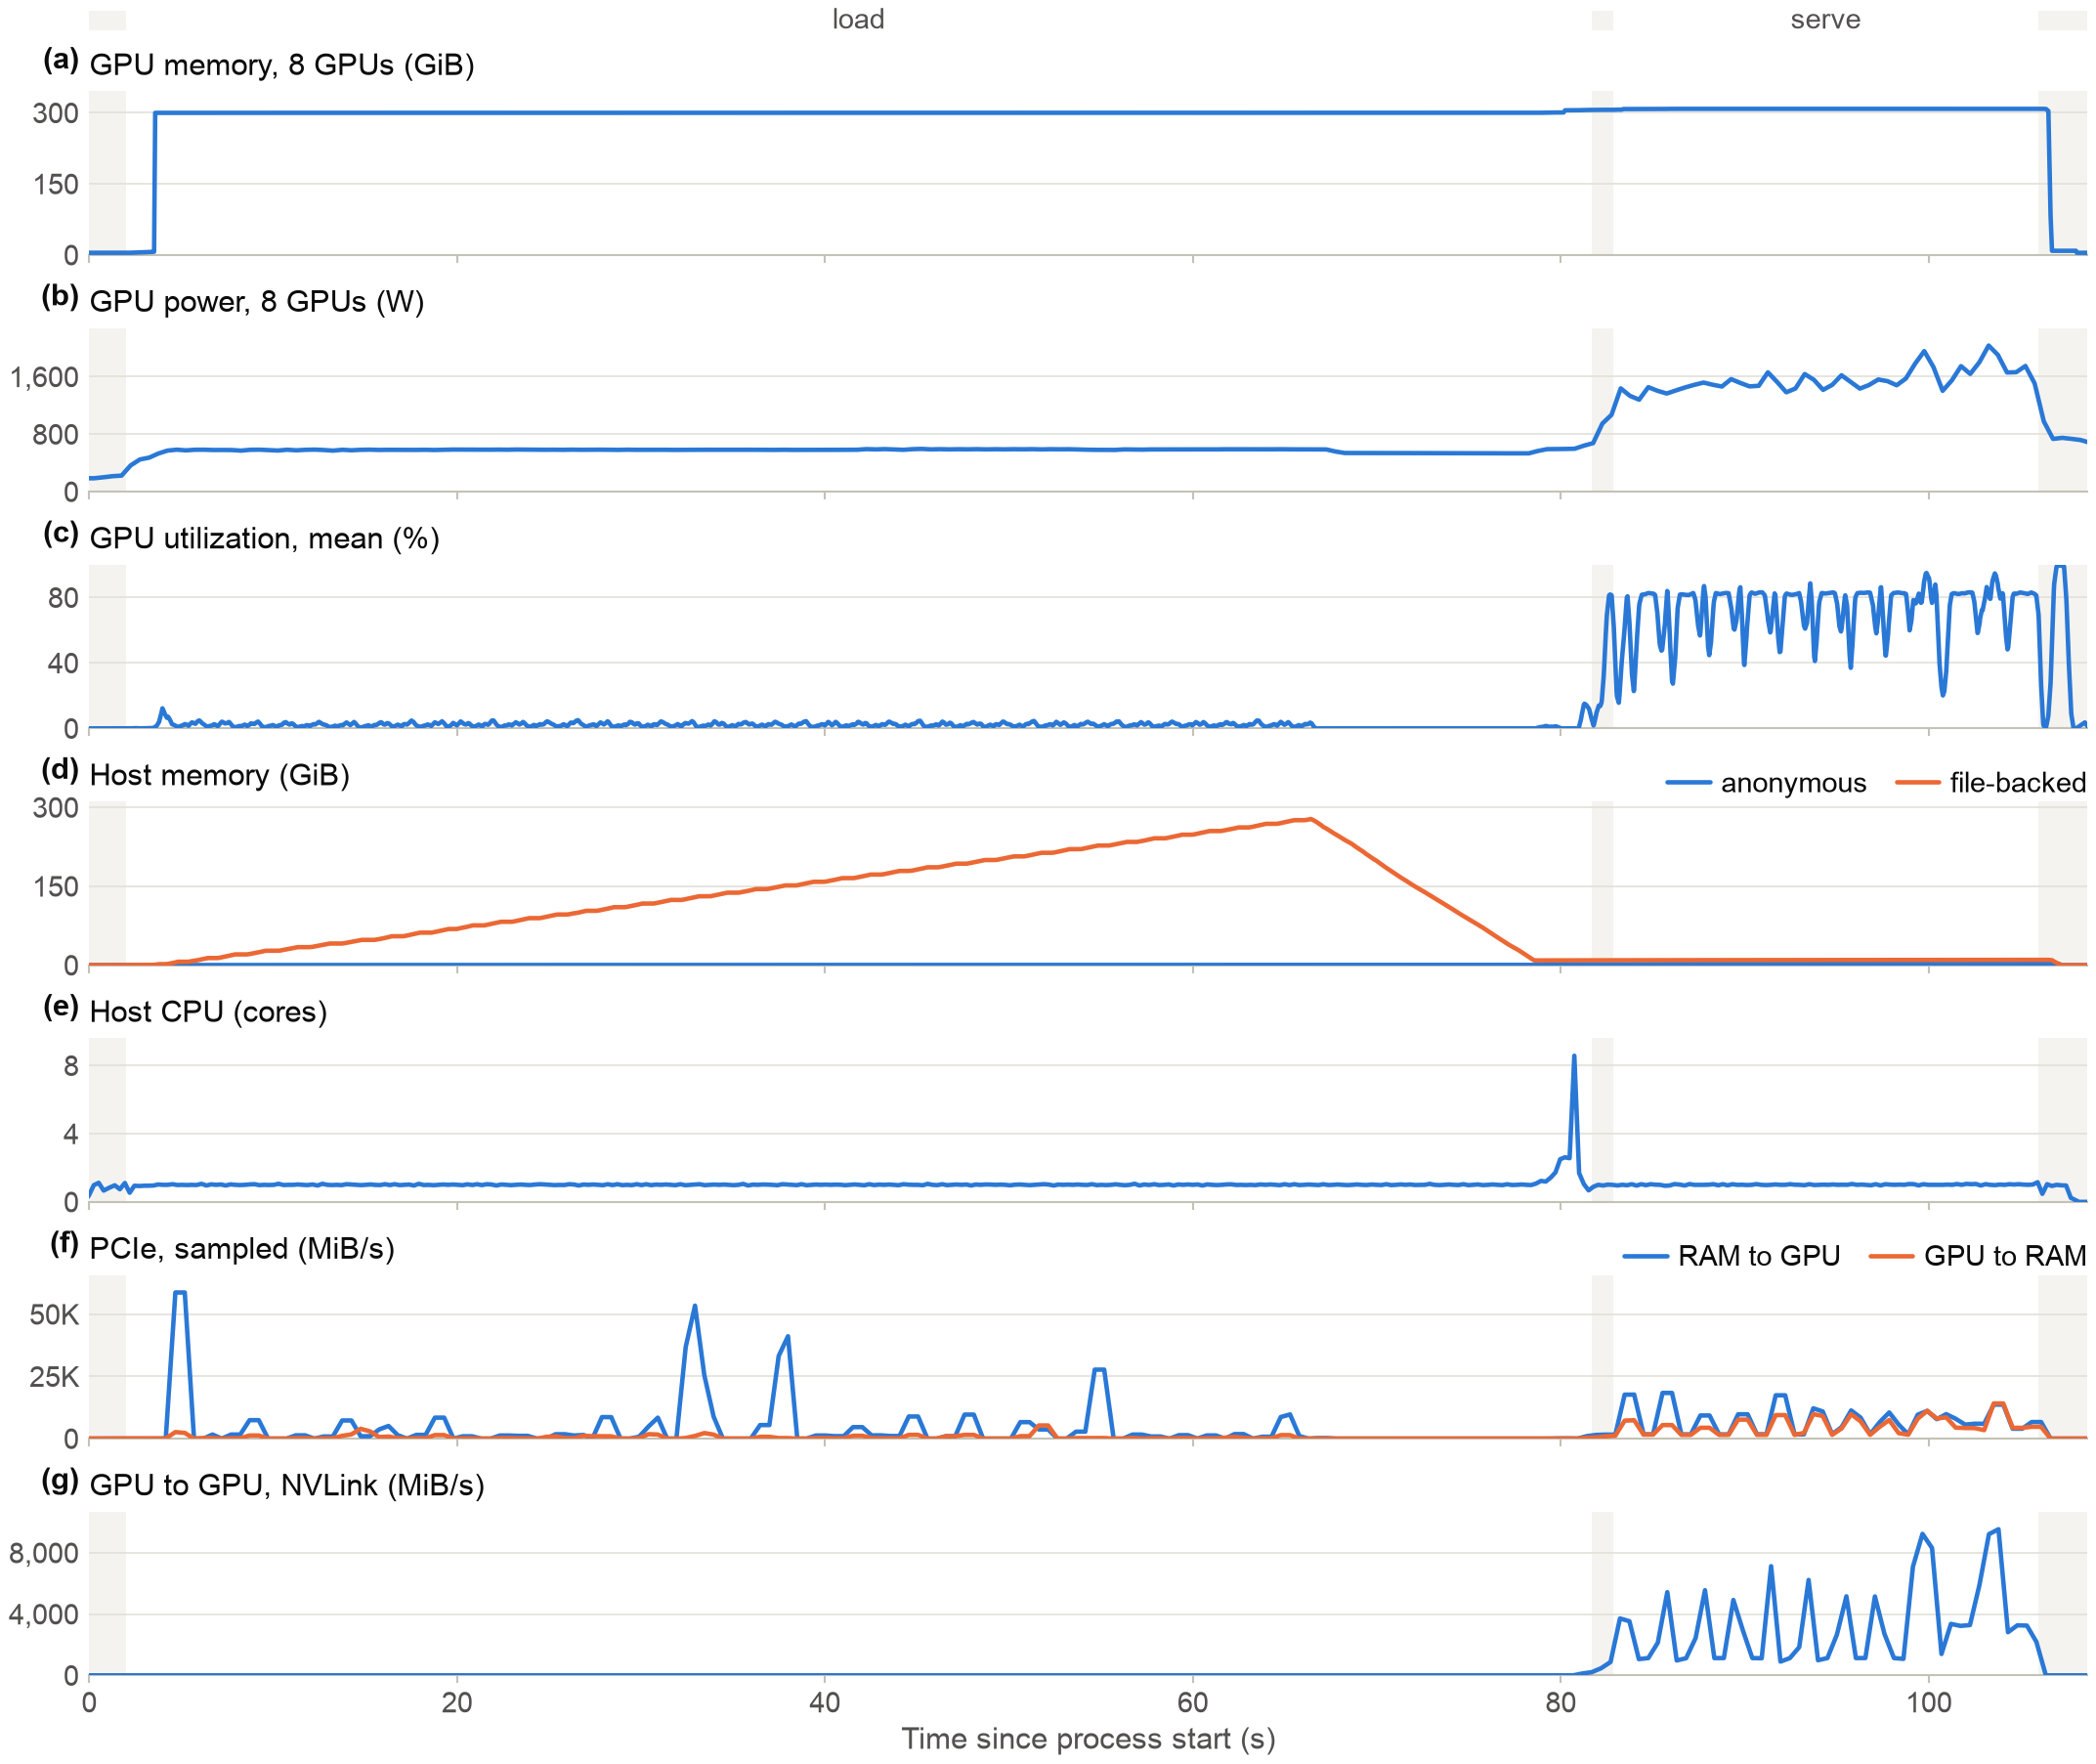
Whole-lifecycle profiler for LLM inference engines: what limits each phase, where memory goes, how data moves between disk, RAM and GPU. Paper-ready figures.
Lightweight Python code profiler and log reporter. Inspect execution time, memory, call stacks, and bottlenecks — zero dependencies, stdlib only, one decorator away