rea
Reverse engineer anything with agents, from app behavior down to native binaries.
- 471k
- TypeScript
- MIT
- 2 h ago
🔬 microscope
Repo microscope-dev/microscope, read from GitHub 1 min ago. microscope-dev has not joined Take My Repo.
microscope-dev/microscope is a public repo on GitHub by microscope-dev. 🔬 microscope. It declares the Apache-2.0 license on GitHub. It is written mainly in Rust, has 1,054 stars and last changed on 2026-11-20. Nobody has reviewed it on Take My Repo yet, which says nothing about its quality. Read from GitHub on 2026-11-20.
Microscope is an all-in-one observability tool for Linux x86-64.
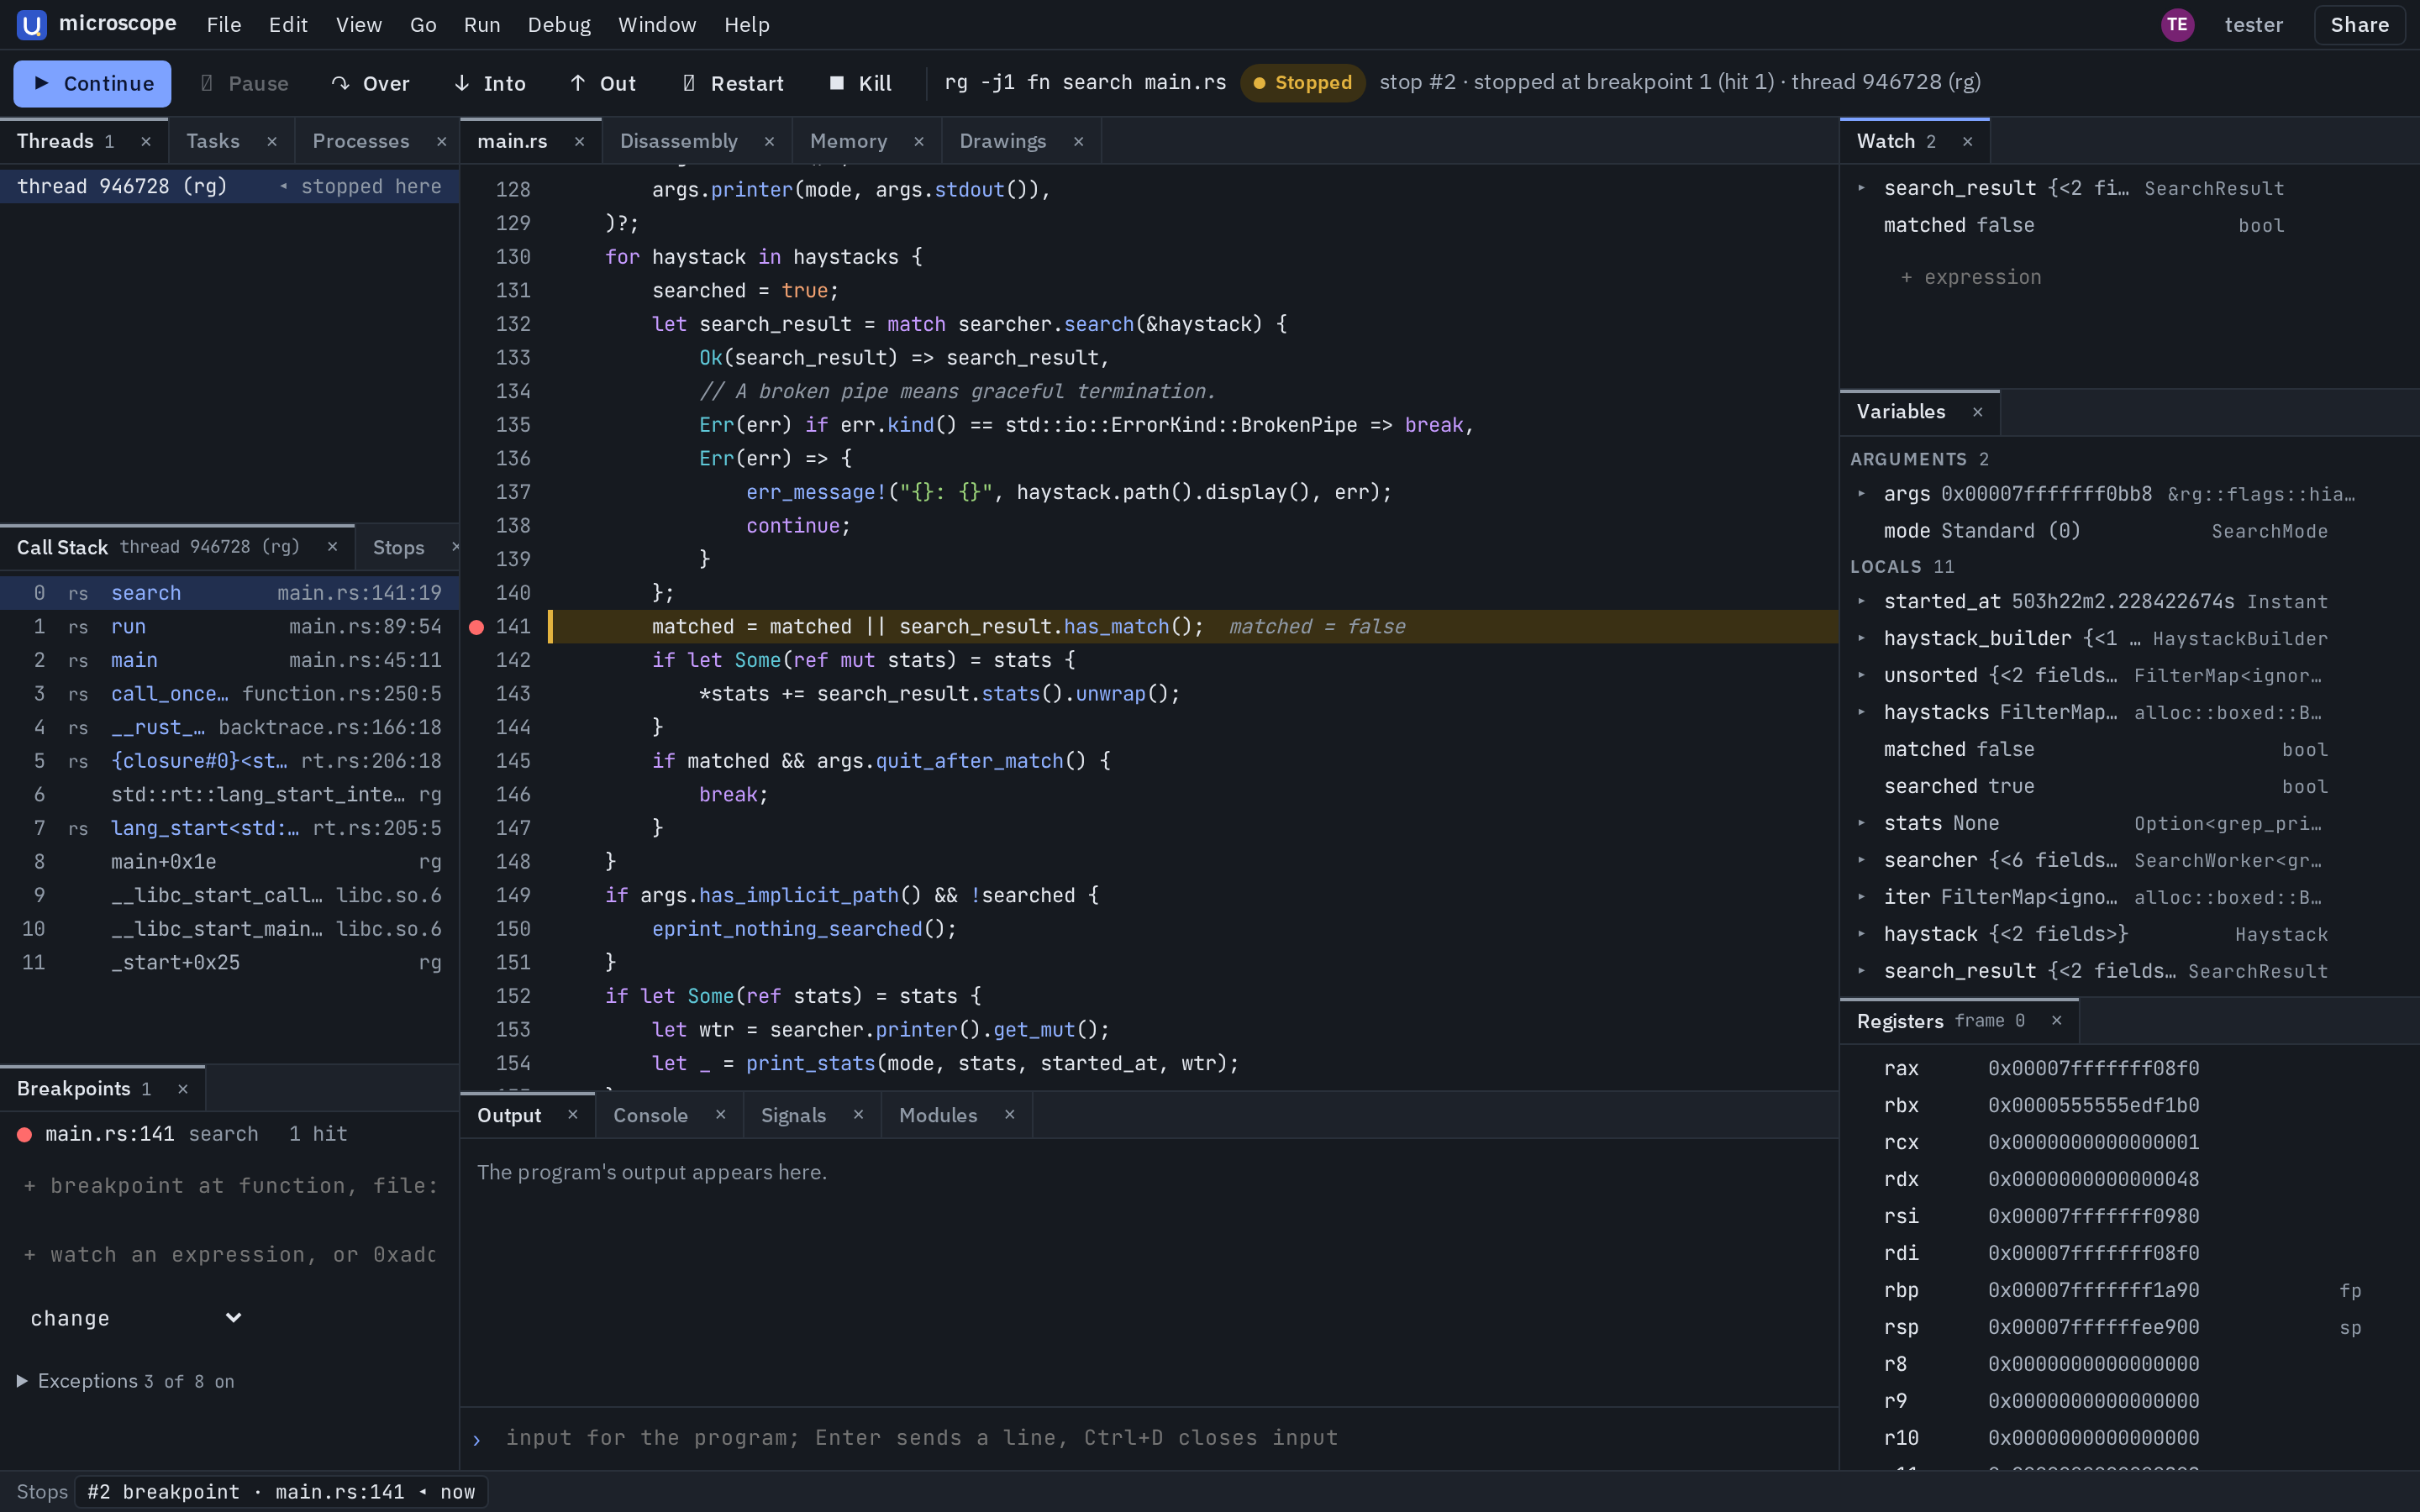
It combines interactive debugging, core-dump analysis, sampling profiling, and syscall tracing in a single binary. You can use it from the terminal, a browser UI, or your editor over DAP. More observability techniques are coming soon!
x86-64. Kernel 5.15+ with BTF is required for eBPF profiling and non-stopping syscall tracing; ptrace is available as an unprivileged fallback on local dev machines only (ptrace is not safe in production).microscope web), and Debug Adapter Protocol (microscope dap) for VS Code and Neovim.Licensed under either MIT or Apache-2.0, at your option.
Please see SECURITY.md
Development uses a pinned Nix shell (./scripts/dev.sh) and just. For instance:
./scripts/dev.sh
just web-build
cargo build --release --bin microscope
This builds ./target/release/microscope with the web UI embedded. To build a static musl binary instead:
just web-build
just build-static release
Build ripgrep in debug mode (cargo build), then launch it under microscope:
microscope ./target/debug/rg -- -j1 "fn search" crates/core/main.rsSet a breakpoint, run to it, inspect values, and step over lines:
(microscope) break main.rs:141
breakpoint 1 set at search at crates/core/main.rs:141
(microscope) run
113:fn search(args: &HiArgs, mode: SearchMode) -> anyhow::Result<bool> {
166:fn search_parallel(args: &HiArgs, mode: SearchMode) -> anyhow::Result<bool> {
stopped at breakpoint 1 (hit 1) in search at crates/core/main.rs:141
    138 |                 continue;
    139 |             }
    140 |         };
●=> 141 |         matched = matched || search_result.has_match();
    142 |         if let Some(ref mut stats) = stats {
    143 |             *stats += search_result.stats().unwrap();
(microscope) print search_result
(SearchResult) search_result = {has_match = true, stats = None}
(microscope) print matched
(bool) matched = false
(microscope) next
stopped after source next in search at crates/core/main.rs:142
    139 |             }
    140 |         };
●   141 |         matched = matched || search_result.has_match();
 => 142 |         if let Some(ref mut stats) = stats {
    143 |             *stats += search_result.stats().unwrap();
    144 |         }
    145 |         if matched && args.quit_after_match() {
(microscope) print matched
(bool) matched = true
(microscope) continue
inferior exited with status 0
Step into calls and inspect the call stack:
(microscope) break main.rs:132
breakpoint 1 set at search at crates/core/main.rs:132
(microscope) run
stopped at breakpoint 1 (hit 1) in search at crates/core/main.rs:132
    129 |     )?;
    130 |     for haystack in haystacks {
    131 |         searched = true;
●=> 132 |         let search_result = match searcher.search(&haystack) {
    133 |             Ok(search_result) => search_result,
(microscope) step
stopped after source step in search<grep_cli::wtr::StandardStream> at crates/core/search.rs:249
   246 |         &mut self,
   247 |         haystack: &crate::haystack::Haystack,
   248 |     ) -> io::Result<SearchResult> {
=> 249 |         let bin = if haystack.is_explicit() {
   250 |             self.config.binary_explicit.clone()
(microscope) bt
#0  0x0000555555667f53 in search<…> at crates/core/search.rs:249
#1  0x00005555556ed896 in search at crates/core/main.rs:132
#2  0x00005555556eb97b in run at crates/core/main.rs:89
#3  0x00005555556ebda1 in main at crates/core/main.rs:45
Run commands non-interactively with --batch:
microscope --batch -e 'break main.rs:141' -e run -e 'print search_result' -e continue \
    ./target/debug/rg -- -j1 "fn search" crates/core/main.rs
Attach to a running process or inspect a core dump:
microscope -p 1234                 # attach by PID or process name
microscope --core core.1234 ./target/debug/rgOpen the web workbench on a program:
microscope web ./target/debug/rg -- -j1 "fn search" crates/core/main.rs
Inspect program data with built-in or custom visualizers defined in .views files (for example, rendering a C++ Mesh from memory):
microscope web --views tests/fixtures/cpp/mesh/mesh.views build/test-programs/mesh

Record a CPU/off-CPU profile and explore the thread lanes and flame graph:
microscope record -o rg.usprof -- ./target/debug/rg "fn search" crates/
microscope report rg.usprof --tree
microscope web rg.usprof
Record syscalls and open the Kernel tab to inspect call summaries, timelines, and latency heatmaps:
microscope record --syscalls calls -o rg-syscalls.usprof -- ./target/debug/rg "fn search" crates/
microscope web rg-syscalls.usprof
microscope-dev/microscope is a public repo on GitHub by microscope-dev. 🔬 microscope.
It declares the Apache-2.0 license on GitHub.
Its maker tagged it for Linux. That is declared by the maker; Take My Repo has not tested it.
Open "Take it" on its page: Take My Repo writes an install plan for your machine and hands it to your AI agent (Claude Code, Codex or Cursor), which asks you before each step. Take My Repo has not tested it on any machine.
Its last change on GitHub was on 2026-11-20. Take My Repo does not judge from that whether it is maintained.
Nobody has reviewed it on Take My Repo yet, which says nothing about its quality.
Reverse engineer anything with agents, from app behavior down to native binaries.
An open-source user mode debugger for Windows. Optimized for reverse engineering and malware analysis.
The agent harness performance optimization system. Skills, instincts, memory, security, and research-first development for Claude Code, Codex, Opencode, Cursor and beyond.