matplotx
:bar_chart: More styles and useful extensions for Matplotlib
- 845
- MIT
- 4 y ago
Repo nschloe/matplotx, read from GitHub 1 min ago. nschloe has not joined Take My Repo.
In short
nschloe/matplotx is a public repo on GitHub by nschloe. :bar_chart: More styles and useful extensions for Matplotlib. It declares the MIT license on GitHub. It is written mainly in Python, has 845 stars and last changed on 2023-01-05. Nobody has reviewed it on Take My Repo yet, which says nothing about its quality. Read from GitHub on 2026-11-22.
Some useful extensions for Matplotlib.
This package includes some useful or beautiful extensions to Matplotlib. Most of those features could be in Matplotlib itself, but I haven't had time to PR yet. If you're eager, let me know and I'll support the effort.
Install with
pip install matplotx[all]
and use in Python with
import matplotx
See below for what matplotx can do.
Clean line plots (dufte)
| matplotlib |
matplotx.styles.dufte,
matplotx.ylabel_top,
matplotx.line_labels
|
matplotx.styles.duftify(matplotx.styles.dracula)
|
The middle plot is created with
import matplotlib.pyplot as plt
import matplotx
import numpy as np

# create data
rng = np.random.default_rng(0)
offsets = [1.0, 1.50, 1.60]
labels = ["no balancing", "CRV-27", "CRV-27*"]
x0 = np.linspace(0.0, 3.0, 100)
y = [offset * x0 / (x0 + 1) + 0.1 * rng.random(len(x0)) for offset in offsets]

# plot
with plt.style.context(matplotx.styles.dufte):
    for yy, label in zip(y, labels):
        plt.plot(x0, yy, label=label)
    plt.xlabel("distance [m]")
    matplotx.ylabel_top("voltage [V]")  # move ylabel to the top, rotate
    matplotx.line_labels()  # line labels to the right
    plt.show()
The three matplotx ingredients are:
matplotx.styles.dufte: A minimalistic stylematplotx.ylabel_top: Rotate and move the the y-labelmatplotx.line_labels: Show line labels to the right, with the line color
You can also "duftify" any other style (see below) with
matplotx.styles.duftify(matplotx.styles.dracula)
Further reading and other styles:
Clean bar plots
| matplotlib | dufte | dufte with matplotx.show_bar_values() |
The right plot is created with
import matplotlib.pyplot as plt
import matplotx

labels = ["Australia", "Brazil", "China", "Germany", "Mexico", "United\nStates"]
vals = [21.65, 24.5, 6.95, 8.40, 21.00, 8.55]
xpos = range(len(vals))

with plt.style.context(matplotx.styles.dufte_bar):
    plt.bar(xpos, vals)
    plt.xticks(xpos, labels)
    matplotx.show_bar_values("{:.2f}")
    plt.title("average temperature [°C]")
    plt.show()
The two matplotx ingredients are:
matplotx.styles.dufte_bar: A minimalistic style for bar plotsmatplotx.show_bar_values: Show bar values directly at the bars
Extra styles
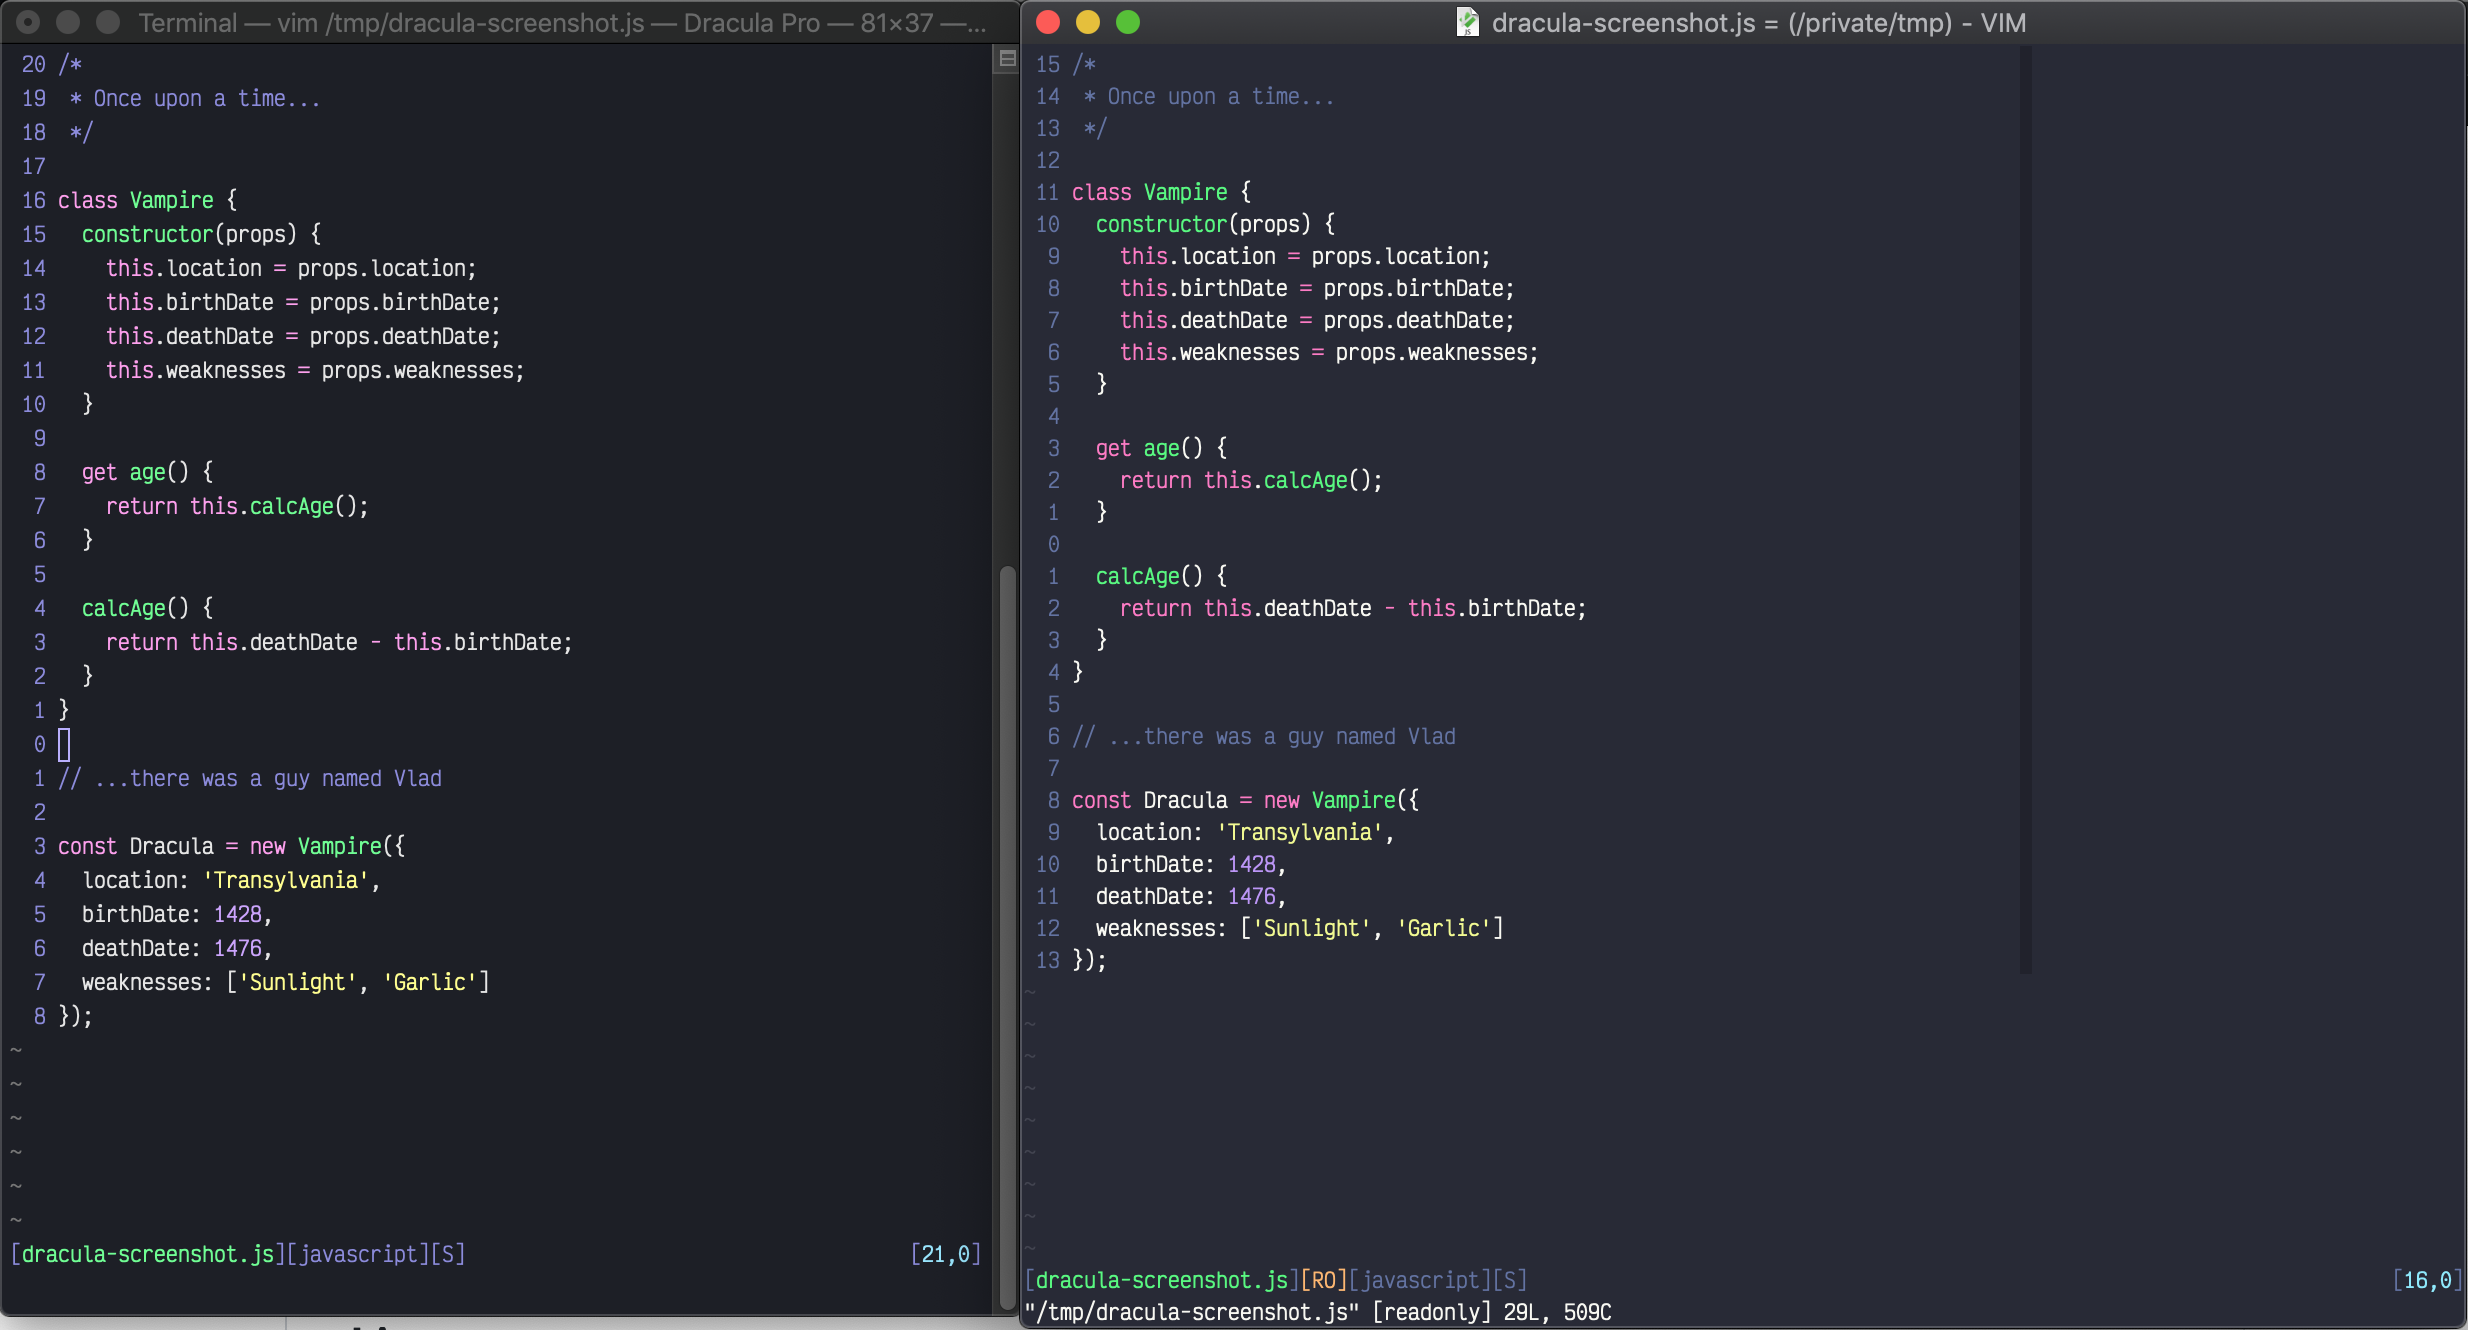
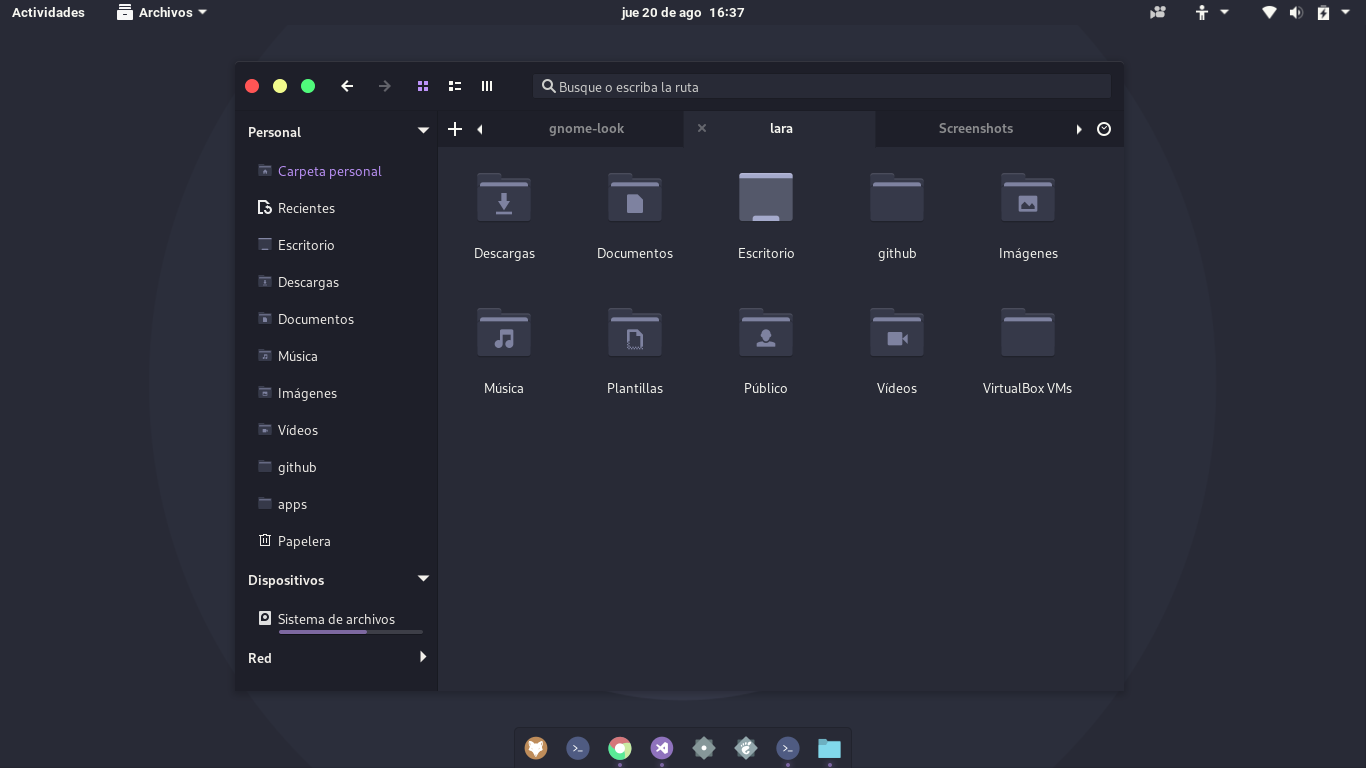
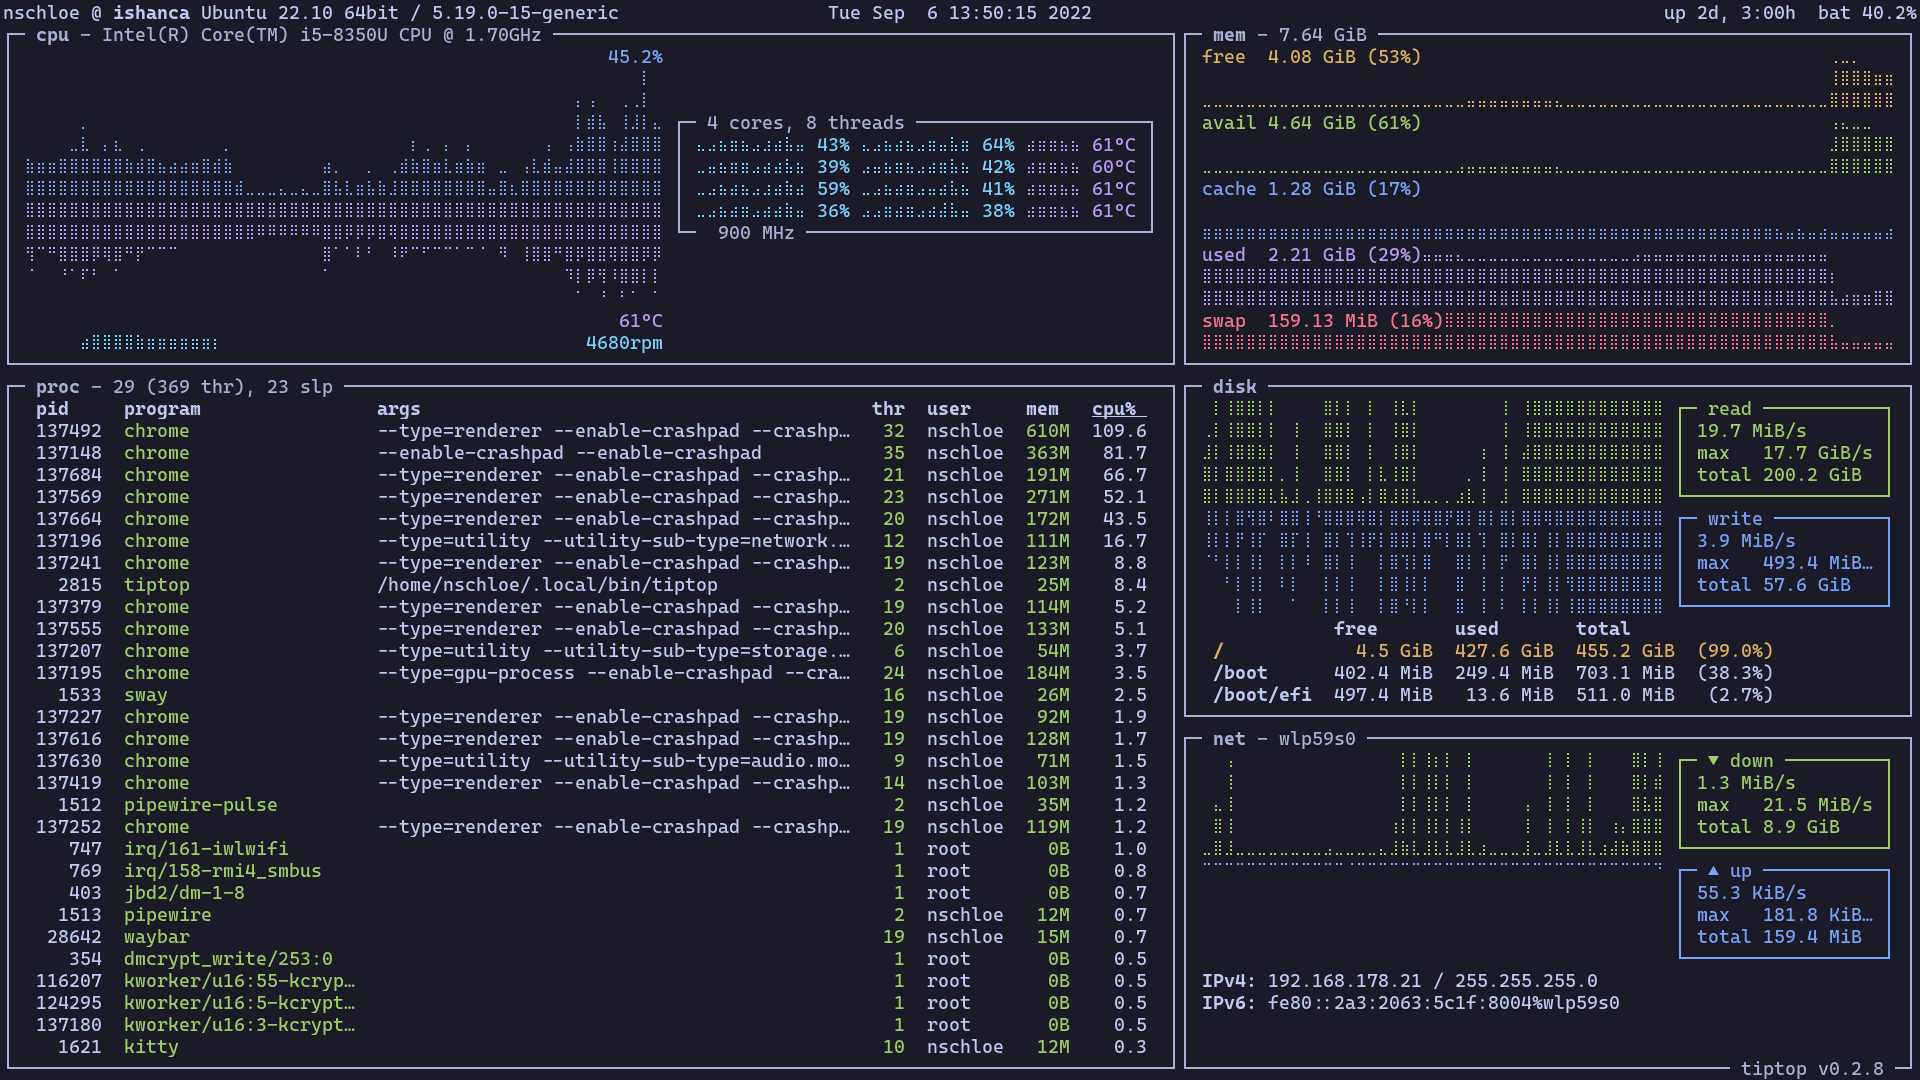
matplotx contains numerous extra color schemes, e.g., Dracula, Nord, gruvbox, and Solarized, the revised Tableau colors.
import matplotlib.pyplot as plt
import matplotx

# use everywhere:
plt.style.use(matplotx.styles.dracula)

# use with context:
with plt.style.context(matplotx.styles.dracula):
    pass
Many more styles here...
Other styles:
- John Garrett, Science Plots
- Dominik Haitz, Cyberpunk style
- Dominik Haitz, Matplotlib stylesheets
- Carlos da Costa, The Grand Budapest Hotel
- Danny Antaki, vaporwave aesthetics
- QuantumBlack Labs, QuantumBlack
Smooth contours
plt.contourf |
matplotx.contours() |
Sometimes, the sharp edges of contour[f] plots don't accurately represent the
smoothness of the function in question. Smooth contours, contours(), serves as a drop-in replacement.
import matplotlib.pyplot as plt
import matplotx


def rosenbrock(x):
    return (1.0 - x[0]) ** 2 + 100.0 * (x[1] - x[0] ** 2) ** 2


im = matplotx.contours(
    rosenbrock,
    (-3.0, 3.0, 200),
    (-1.0, 3.0, 200),
    log_scaling=True,
    cmap="viridis",
    outline="white",
)
plt.gca().set_aspect("equal")
plt.colorbar(im)
plt.show()
Contour plots for functions with discontinuities
plt.contour |
matplotx.contour(max_jump=1.0) |
Matplotlib has problems with contour plots of functions that have discontinuities. The software has no way to tell discontinuities and very sharp, but continuous cliffs apart, and contour lines will be drawn along the discontinuity.
matplotx improves upon this by adding the parameter max_jump. If the difference between
two function values in the grid is larger than max_jump, a discontinuity is assumed
and no line is drawn. Similarly, min_jump can be used to highlight the discontinuity.
As an example, take the function imag(log(Z)) for complex values Z. Matplotlib's
contour lines along the negative real axis are wrong.
import matplotlib.pyplot as plt
import numpy as np

import matplotx

x = np.linspace(-2.0, 2.0, 100)
y = np.linspace(-2.0, 2.0, 100)

X, Y = np.meshgrid(x, y)
Z = X + 1j * Y

vals = np.imag(np.log(Z))

# plt.contour(X, Y, vals, levels=[-2.0, -1.0, 0.0, 1.0, 2.0])  # draws wrong lines

matplotx.contour(X, Y, vals, levels=[-2.0, -1.0, 0.0, 1.0, 2.0], max_jump=1.0)
matplotx.discontour(X, Y, vals, min_jump=1.0, linestyle=":", color="r")

plt.gca().set_aspect("equal")
plt.show()
Relevant discussions:
spy plots (betterspy)
Show sparsity patterns of sparse matrices or write them to image files.
Example:
import matplotx
from scipy import sparse

A = sparse.rand(20, 20, density=0.1)

# show the matrix
plt = matplotx.spy(
    A,
    # border_width=2,
    # border_color="red",
    # colormap="viridis"
)
plt.show()

# or save it as png
matplotx.spy(A, filename="out.png")
| no colormap | viridis |
There is a command-line tool that can be used to show matrix-market or Harwell-Boeing files:
matplotx spy msc00726.mtx [out.png]
See matplotx spy -h for all options.
License
This software is published under the MIT license.
Questions
What is matplotx?
nschloe/matplotx is a public repo on GitHub by nschloe. :bar_chart: More styles and useful extensions for Matplotlib.
Is matplotx open source?
It declares the MIT license on GitHub.
Does matplotx run on macOS, Windows or Linux?
Its maker has not tagged a system, so it is unknown here. Its README says what it needs.
How do I install matplotx?
Open "Take it" on its page: Take My Repo writes an install plan for your machine and hands it to your AI agent (Claude Code, Codex or Cursor), which asks you before each step. Take My Repo has not tested it on any machine.
Is matplotx still maintained?
Its last change on GitHub was on 2023-01-05. GitHub counts 10 open issues and pull requests. Take My Repo does not judge from that whether it is maintained.
What do people who ran matplotx say?
Nobody has reviewed it on Take My Repo yet, which says nothing about its quality.