
react-chartjs-2
React components for Chart.js, the most popular charting library
- 6.9k
- TypeScript
- MIT
- 1 d ago
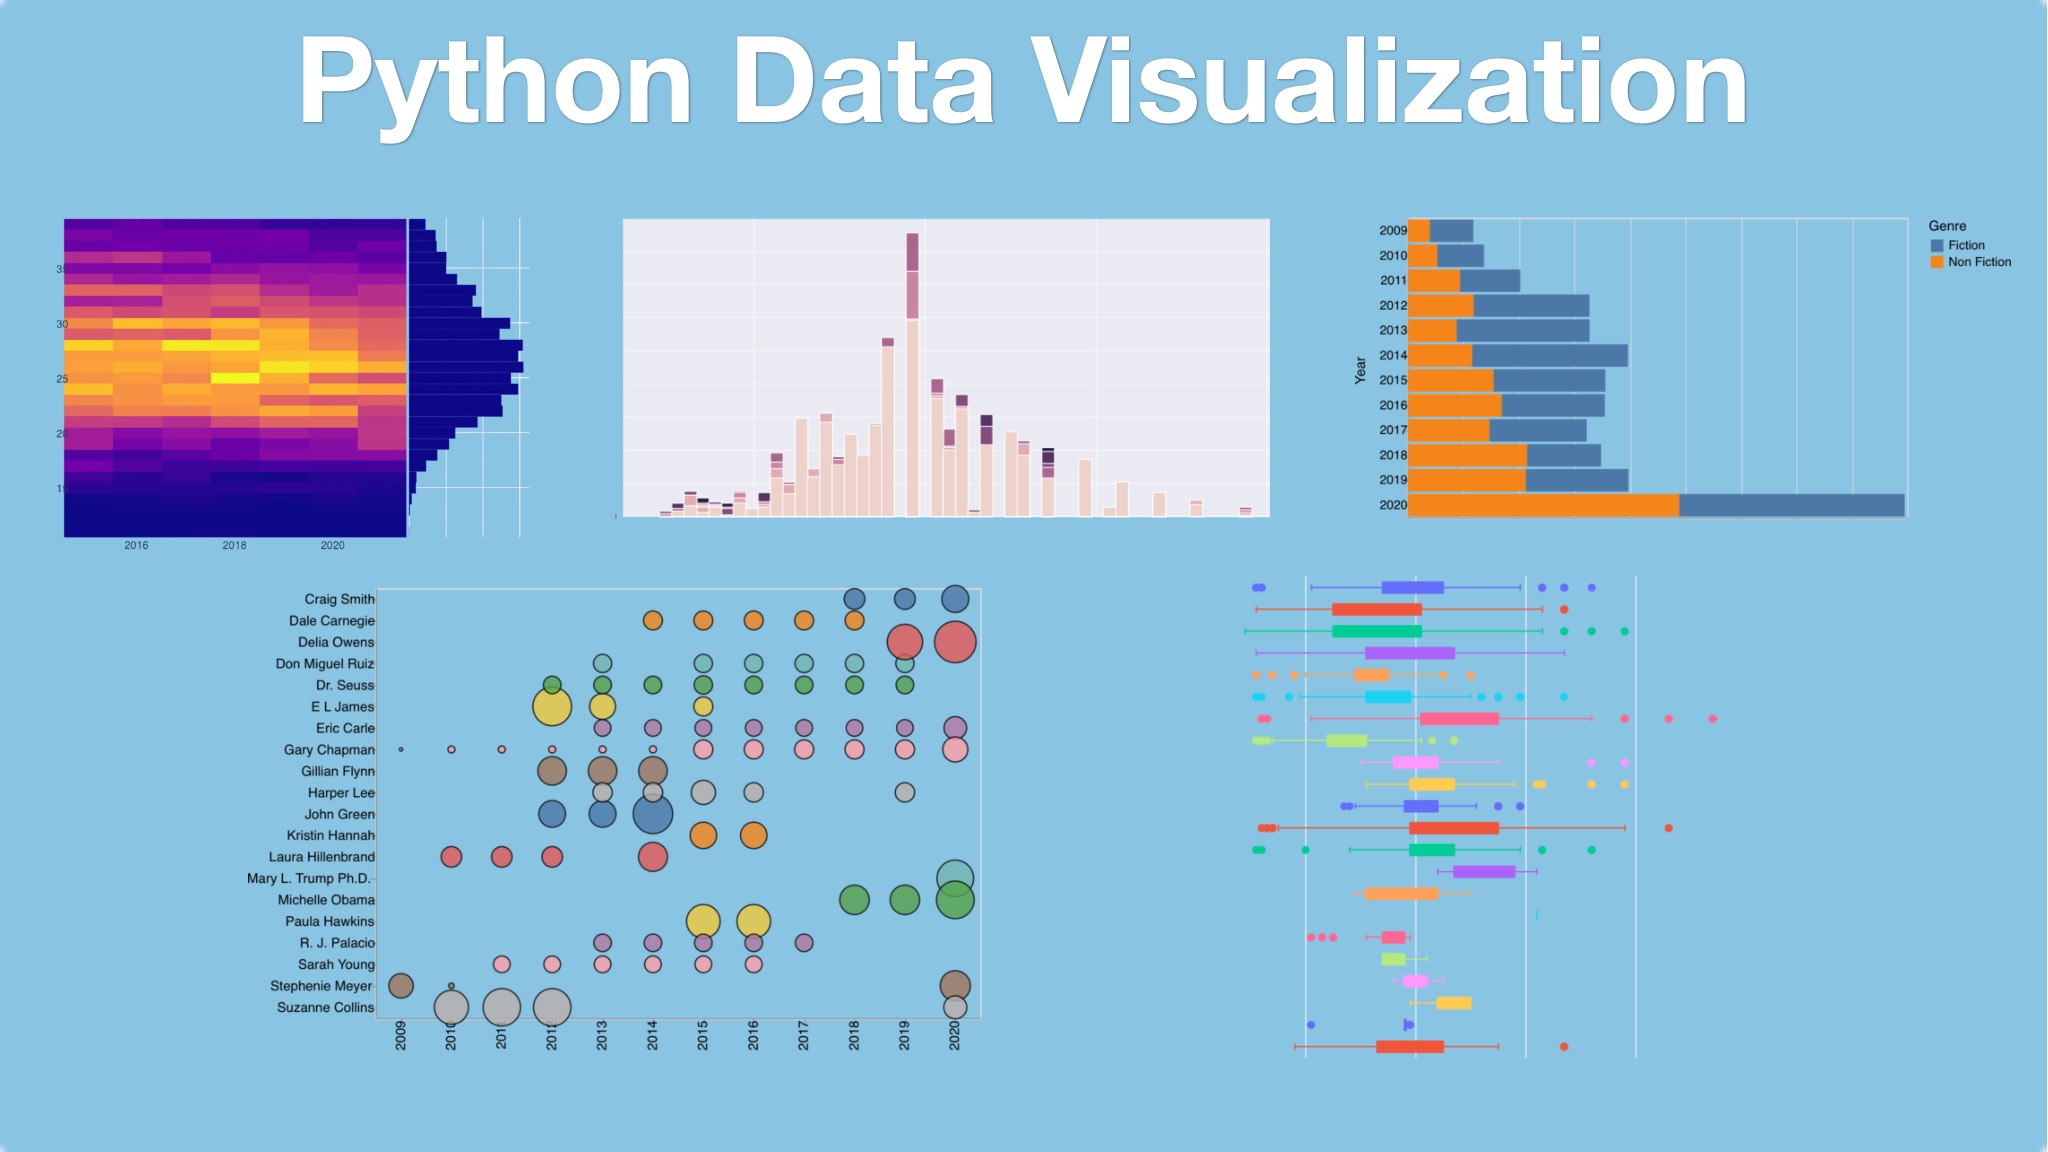
Python Data Visualization course code and examples
Repo talkpython/python-data-visualization, read from GitHub 1 min ago. talkpython has not joined Take My Repo.
talkpython/python-data-visualization is a public repo on GitHub by talkpython. Python Data Visualization course code and examples. It declares the MIT license on GitHub. It is written mainly in Jupyter Notebook, has 51 stars and last changed on 2023-12-03. Nobody has reviewed it on Take My Repo yet, which says nothing about its quality. Read from GitHub on 2026-11-18.
Code and examples from our Python Data Visualization course.
Have you ever been confused by all the different python plotting libraries? Have you tried to make a "simple" plot and gotten stuck and been unable to move forward? Do you want to make sophisticated, interactive data visualizations in python? If you answer yes, to any of these questions, then this course is for you.
The python data visualization landscape has many different libraries. They are all powerful and useful but it can be confusing to determine what works best for you. This course is unique because you will learn about many of the most popular python visualization libraries. You will start by learning how to use each library to build simple visualizations. You will also explore more complex usage and identify the scenarios where each library shines.
By the end of this course, you will have a basic working knowledge of how to visualize data in python using multiple libraries. You will also learn which library is best for you and your coding style. Along the way, you'll learn general visualization concepts to make your plots more effective.
In addition to the overview material, we will cover some of the more complex, interactive visualization dashboard technologies.
In this course, you will:
View the full course outline.
Developers and Data Analysts that have some experience with python but have not developed a competency in a python visualization library. This course is also helpful for those that feel restricted by their current plotting tools and wish to explore other options.
Note: All software used during this course, including editors, Python language, etc., are 100% free and open source. You won't have to buy anything to take the course.
Data sciense is one of the hottest topic of the year and data visualization is a core skillset needed to properly communicate your results and discoveries. Take this course to get good at a wide variety of modern Python-based visualization libraries.
talkpython/python-data-visualization is a public repo on GitHub by talkpython. Python Data Visualization course code and examples.
It declares the MIT license on GitHub.
Its maker has not tagged a system, so it is unknown here. Its README says what it needs.
Open "Take it" on its page: Take My Repo writes an install plan for your machine and hands it to your AI agent (Claude Code, Codex or Cursor), which asks you before each step. Take My Repo has not tested it on any machine.
Its last change on GitHub was on 2023-12-03. Take My Repo does not judge from that whether it is maintained.
Nobody has reviewed it on Take My Repo yet, which says nothing about its quality.
React components for Chart.js, the most popular charting library
aka "Bayesian Methods for Hackers": An introduction to Bayesian methods + probabilistic programming with a computation/understanding-first, mathematics-second point of view. All in pure Python ;)
12 weeks, 26 lessons, 52 quizzes, classic Machine Learning for all
Bring data to life with SVG, Canvas and HTML. :bar_chart::chart_with_upwards_trend::tada:
A data science project aimed at creating a machine learning-based email spam detection system. It effectively identifies and classifies emails into spam and non-spam categories, enhancing email security and user experience.


