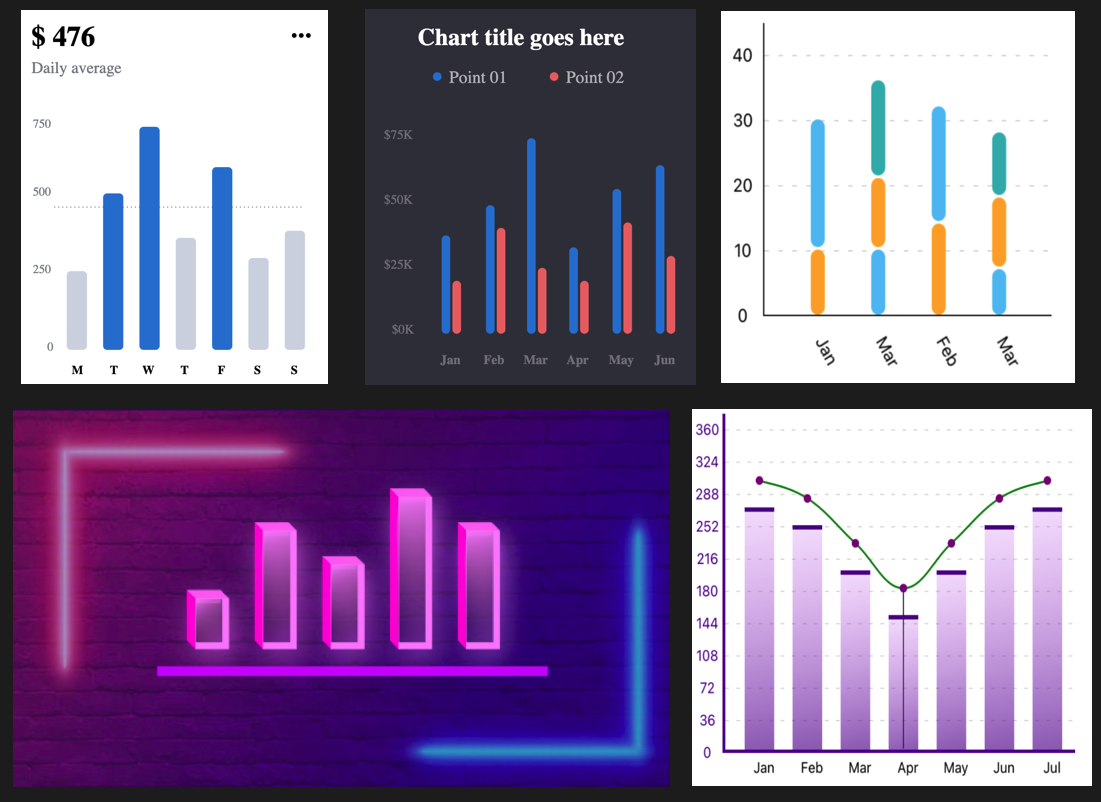
fl_chart
FL Chart is a highly customizable Flutter chart library that supports Line Chart, Bar Chart, Pie Chart, Scatter Chart, Radar Chart and Candlestick Chart.
- 7.6k
- Dart
- MIT
- 8 d ago
FL Chart is a highly customizable Flutter chart library that supports Line Chart, Bar Chart, Pie Chart, Scatter Chart, Radar Chart and Candlestick Chart.
The most loved library for Bar, Line, Area, Pie, Donut, Stacked Bar, Population Pyramid, Radar, Bubble, Scatter and Candle Stick charts in React Native. Allows 2D, 3D, gradient, animations and live data updates.
📊📈 A D3 v7 tutorial - interactive bar chart and multiple coordinated views (MCV)
Leaflet.minichart is a leaflet plugin for adding to a leaflet map small animated charts
Learn data visualization through Microsoft Power BI and create opportunities for you or key decision makers to discover data patterns such as customer purchase behavior, sales trends, or production bottlenecks. You'll learn all of the features in Power BI that allow you to explore, experiment with, fix, prepare, and present data easily, quickly, and beautifully.
Learn data visualization through Tableau 2020 and create opportunities for you or key decision-makers to discover data patterns such as customer purchase behavior, sales trends, or production bottlenecks. This Course on Udemy
React component for bubble chart, bar chart, and pie chart, with animated morphing transitions between charts, on hover, and on window resize.
AidData's Core Research Release 3.1 is a corrected snapshot of AidData's entire project-level database from April 2016. This database includes commitment information for over 1.5 million development finance activities funded between 1947 and 2013, covers 96 donors, and includes ODA, OOF flows, Equity Investments, and Export Credits where available.
Matplotlib The Figure is the overall window or page that everything is drawn on. It’s the top-level component of all. To the figure you add Axes. The Axes is the area on which the data is plotted. A figure can have multiple axes. Note: when you see, for example, plt.xlim, you’ll call ax.set_xlim() behind the covers. All methods of an Axes object exist as a function in the pyplot module and vice v
A command-line utility for showing dependencies stargazers count