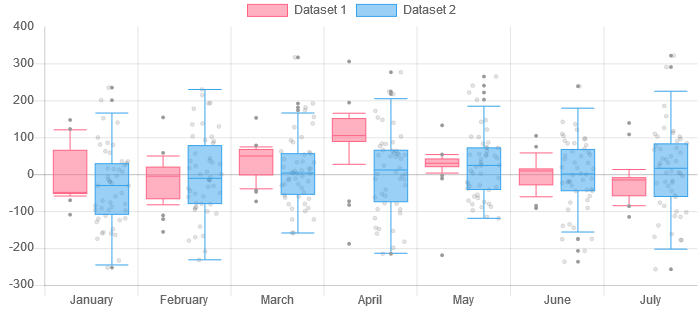
boxplot

Open repos and models their makers tagged boxplot, most starred first. The same for everyone.

Data and analyticsRepo

12_Python_Seaborn_Module

Seaborn is one of the go-to tools for statistical data visualization in python. It has been actively developed since 2012 and in July 2018, the author released version 0.9. This version of Seaborn has several new plotting features, API changes and documentation updates which combine to enhance an already great library. This article will walk through a few of the highlights and show how to use the

  • 234
  • Jupyter Notebook
  • MIT
  • 4 y ago
milaan9Take it
GitHubRepo

Learn_Visualization_on_Matplotlib

Matplotlib The Figure is the overall window or page that everything is drawn on. It’s the top-level component of all. To the figure you add Axes. The Axes is the area on which the data is plotted. A figure can have multiple axes. Note: when you see, for example, plt.xlim, you’ll call ax.set_xlim() behind the covers. All methods of an Axes object exist as a function in the pyplot module and vice v

  • 1
  • Jupyter Notebook
  • 5 y ago
MoinDalvsTake it
Search GitHub and Hugging Face for boxplot

Get , open it once and sign in. Then come back here and press the button again.

boxplot: open source repos and models on Take My Repo