choropleth-map




Visualization-using-Plotly-and-Covid-19-Data
Covid-19 Analysis using plotly : Choropleth Maps
- 4
- Jupyter Notebook
- 6 y ago



Geographic-Information-Sciences-and-Technologies-RIT
Contains Weekly Activites for the (ISTE 740) Geographic Information Sciences and Technologies Course @ RIT
- 1
- HTML
- GPL-3.0
- 7 y ago

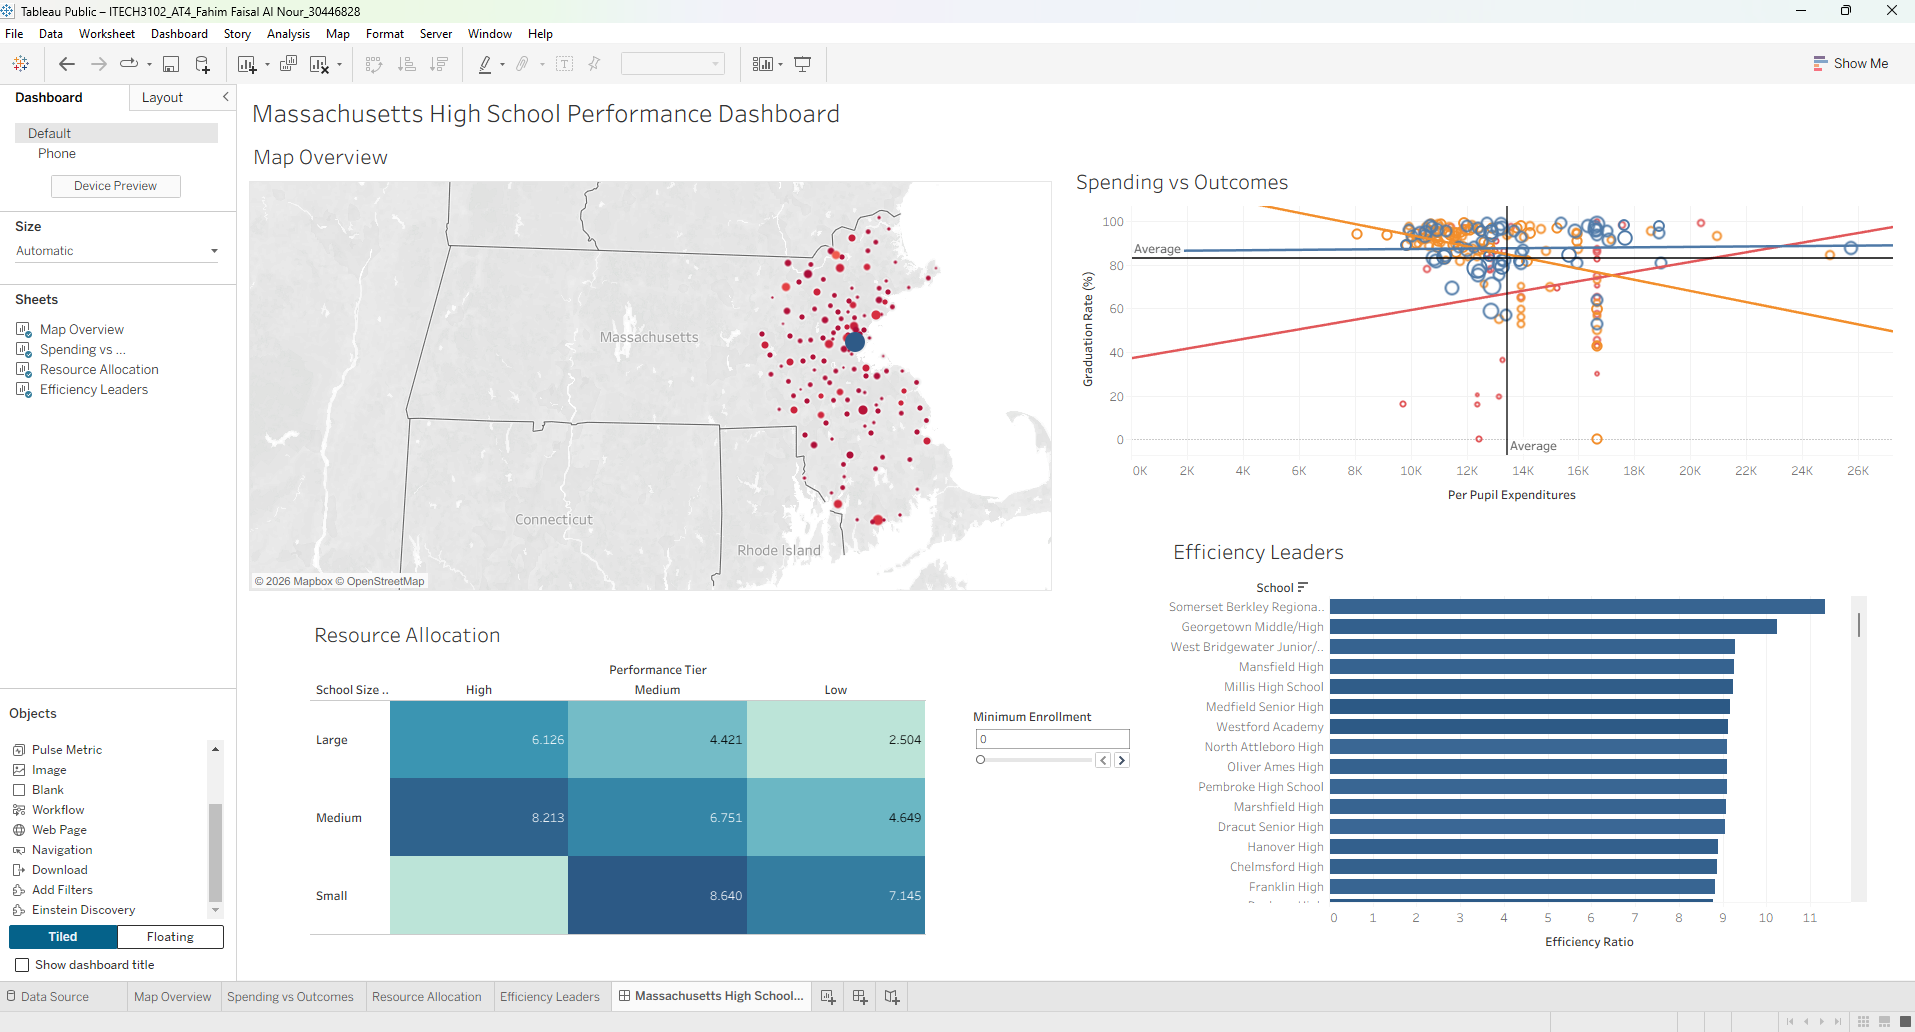
ITECH-3102_Big-Data-AND-Data-Visualisation
Comprehensive portfolio for ITECH3102 Big Data and Data Visualisation at Federation University Australia. Features interactive Tableau capstone dashboards, D3.js and SVG web visualisations, spatial maps, clustering models, full design plans, executive analysis reports, and 8 weekly lab projects with complete reproducible datasets.
- 0
- HTML
- 12 d ago

education-choropleth-map
A D3.js choropleth map of the US built in React.js that presents each county's percentage of adults who are college graduates.
- 1
- JavaScript
- 20 mo ago
