fl_chart
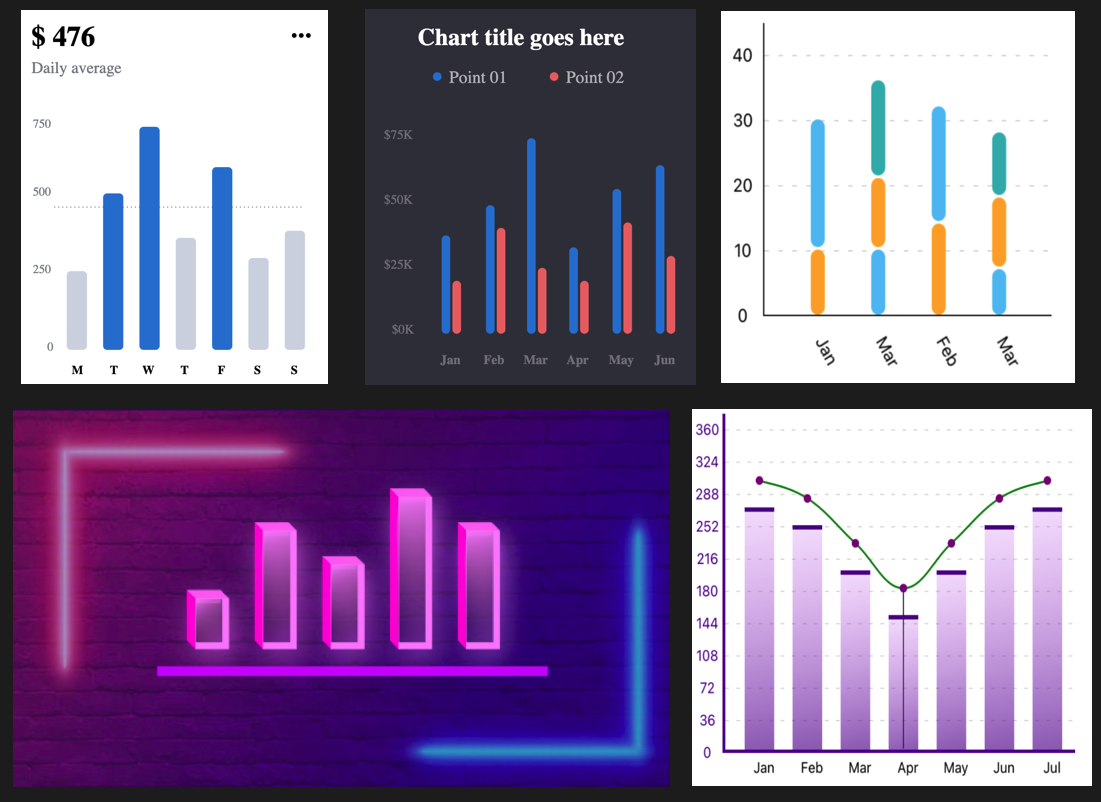
FL Chart is a highly customizable Flutter chart library that supports Line Chart, Bar Chart, Pie Chart, Scatter Chart, Radar Chart and Candlestick Chart.
- 7.6k
- Dart
- MIT
- 6 d ago
FL Chart is a highly customizable Flutter chart library that supports Line Chart, Bar Chart, Pie Chart, Scatter Chart, Radar Chart and Candlestick Chart.
The most loved library for Bar, Line, Area, Pie, Donut, Stacked Bar, Population Pyramid, Radar, Bubble, Scatter and Candle Stick charts in React Native. Allows 2D, 3D, gradient, animations and live data updates.
Matplotlib The Figure is the overall window or page that everything is drawn on. It’s the top-level component of all. To the figure you add Axes. The Axes is the area on which the data is plotted. A figure can have multiple axes. Note: when you see, for example, plt.xlim, you’ll call ax.set_xlim() behind the covers. All methods of an Axes object exist as a function in the pyplot module and vice v