react-chartjs-2
React components for Chart.js, the most popular charting library
- 6.9k
- TypeScript
- MIT
- 2 d ago
Chart.js Box Plots and Violin Plot Charts
Repo sgratzl/chartjs-chart-boxplot, read from GitHub 16 h ago. sgratzl has not joined Take My Repo.
sgratzl/chartjs-chart-boxplot is a public repo on GitHub by sgratzl. Chart.js Box Plots and Violin Plot Charts. It declares the MIT license on GitHub. It is written mainly in TypeScript, has 136 stars and last changed on 2025-10-04. Nobody has reviewed it on Take My Repo yet, which says nothing about its quality. Read from GitHub on 2026-11-21.
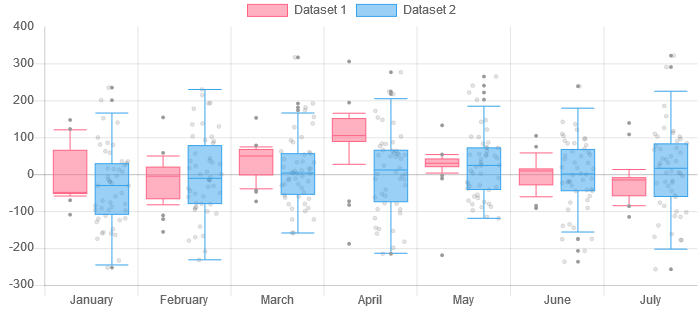
Chart.js module for charting box and violin plots. This is a maintained fork of @datavisyn/chartjs-chart-box-and-violin-plot, which I originally developed during my time at datavisyn.

npm install chart.js @sgratzl/chartjs-chart-boxplot
see Examples
and
four new types: boxplot and violin.
The config can be done on a per dataset .data.datasets[0].minStats or for all datasets under the controllers name. e.g., .options.boxplot.datasets.minStats.
see https://github.com/sgratzl/chartjs-chart-boxplot/blob/dev/src/data.ts#L100-L147
Both types support that the data is given as an array of numbers number[]. The statistics will be automatically computed. In addition, specific summary data structures are supported:
see https://github.com/sgratzl/chartjs-chart-boxplot/blob/dev/src/data.ts#L24-L49
In order to simplify the customization of the tooltips the tooltip item given to the tooltip callbacks was improved. The default toString() behavior should be fine in most cases. The tooltip item has the following structure:
interface ITooltipItem {
  label: string; // original
  value: {
    raw: IBoxPlotItem | IViolinItem;
    /**
     * in case an outlier is hovered this will contains its index
     * @default -1
     */
    hoveredOutlierRadius: number;
    /**
     * toString function with a proper default implementation, which is used implicitly
     */
    toString(): string;

    min: string;
    median: string;
    max: string;
    items?: string[];

    //... the formatted version of different attributes IBoxPlotItem or ViolinItem
  };
}
The ESM build of the library supports tree shaking thus having no side effects. As a consequence the chart.js library won't be automatically manipulated nor new controllers automatically registered. One has to manually import and register them.
Variant A:
import { Chart, LinearScale, CategoryScale } from 'chart.js';
import { BoxPlotController, BoxAndWiskers } from '@sgratzl/chartjs-chart-boxplot';

// register controller in chart.js and ensure the defaults are set
Chart.register(BoxPlotController, BoxAndWiskers, LinearScale, CategoryScale);
...

new Chart(ctx, {
  type: 'boxplot',
  data: [...],
});
Variant B:
import { BoxPlotChart } from '@sgratzl/chartjs-chart-boxplot';

new BoxPlotChart(ctx, {
  data: [...],
});
Check out also my other chart.js plugins:
npm i -g yarn
yarn install
yarn sdks vscode
yarn compile
yarn test
yarn lint
yarn fix
yarn build
yarn docs
Original credits belong to @datavisyn.
sgratzl/chartjs-chart-boxplot is a public repo on GitHub by sgratzl. Chart.js Box Plots and Violin Plot Charts.
It declares the MIT license on GitHub.
Its maker has not tagged a system, so it is unknown here. Its README says what it needs.
Open "Take it" on its page: Take My Repo writes an install plan for your machine and hands it to your AI agent (Claude Code, Codex or Cursor), which asks you before each step. Take My Repo has not tested it on any machine.
Its last change on GitHub was on 2025-10-04. GitHub counts 16 open issues and pull requests. Take My Repo does not judge from that whether it is maintained.
Nobody has reviewed it on Take My Repo yet, which says nothing about its quality.
React components for Chart.js, the most popular charting library
Seaborn is one of the go-to tools for statistical data visualization in python. It has been actively developed since 2012 and in July 2018, the author released version 0.9. This version of Seaborn has several new plotting features, API changes and documentation updates which combine to enhance an already great library. This article will walk through a few of the highlights and show how to use the
📊📈 A D3 v7 tutorial - interactive bar chart and multiple coordinated views (MCV)
:memo: Python3 module for deleting Slack messages and files using the Slack REST API