viztracer
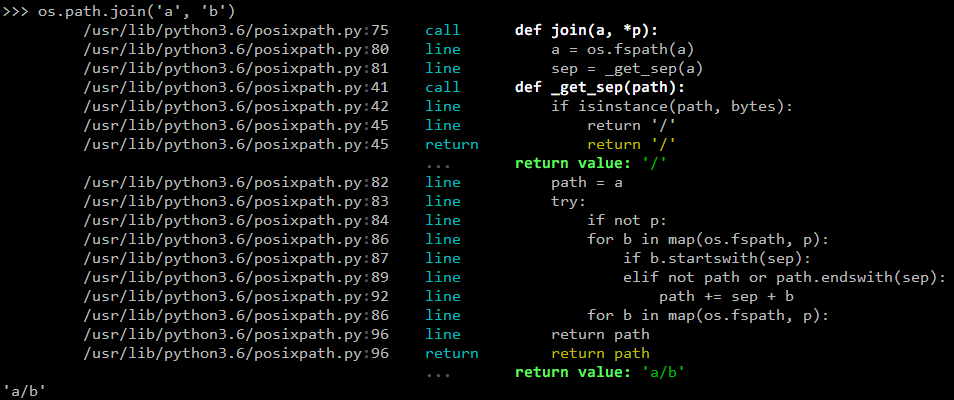
A debugging and profiling tool that can trace and visualize python code execution
- 7.8k
- Python
- Apache-2.0
- 8 d ago
A debugging and profiling tool that can trace and visualize python code execution
A simple & straight-to-the-point PHP profiling extension with its built-in web UI
Real-time PathTracing with global illumination and progressive rendering, all on top of the Three.js WebGL framework. Click here for Live Demo: https://erichlof.github.io/THREE.js-PathTracing-Renderer/Geometry_Showcase.html
Path tracing renderer and utilities for three.js built on top of three-mesh-bvh.
A Frida based tool that traces usage of the JNI API in Android apps.
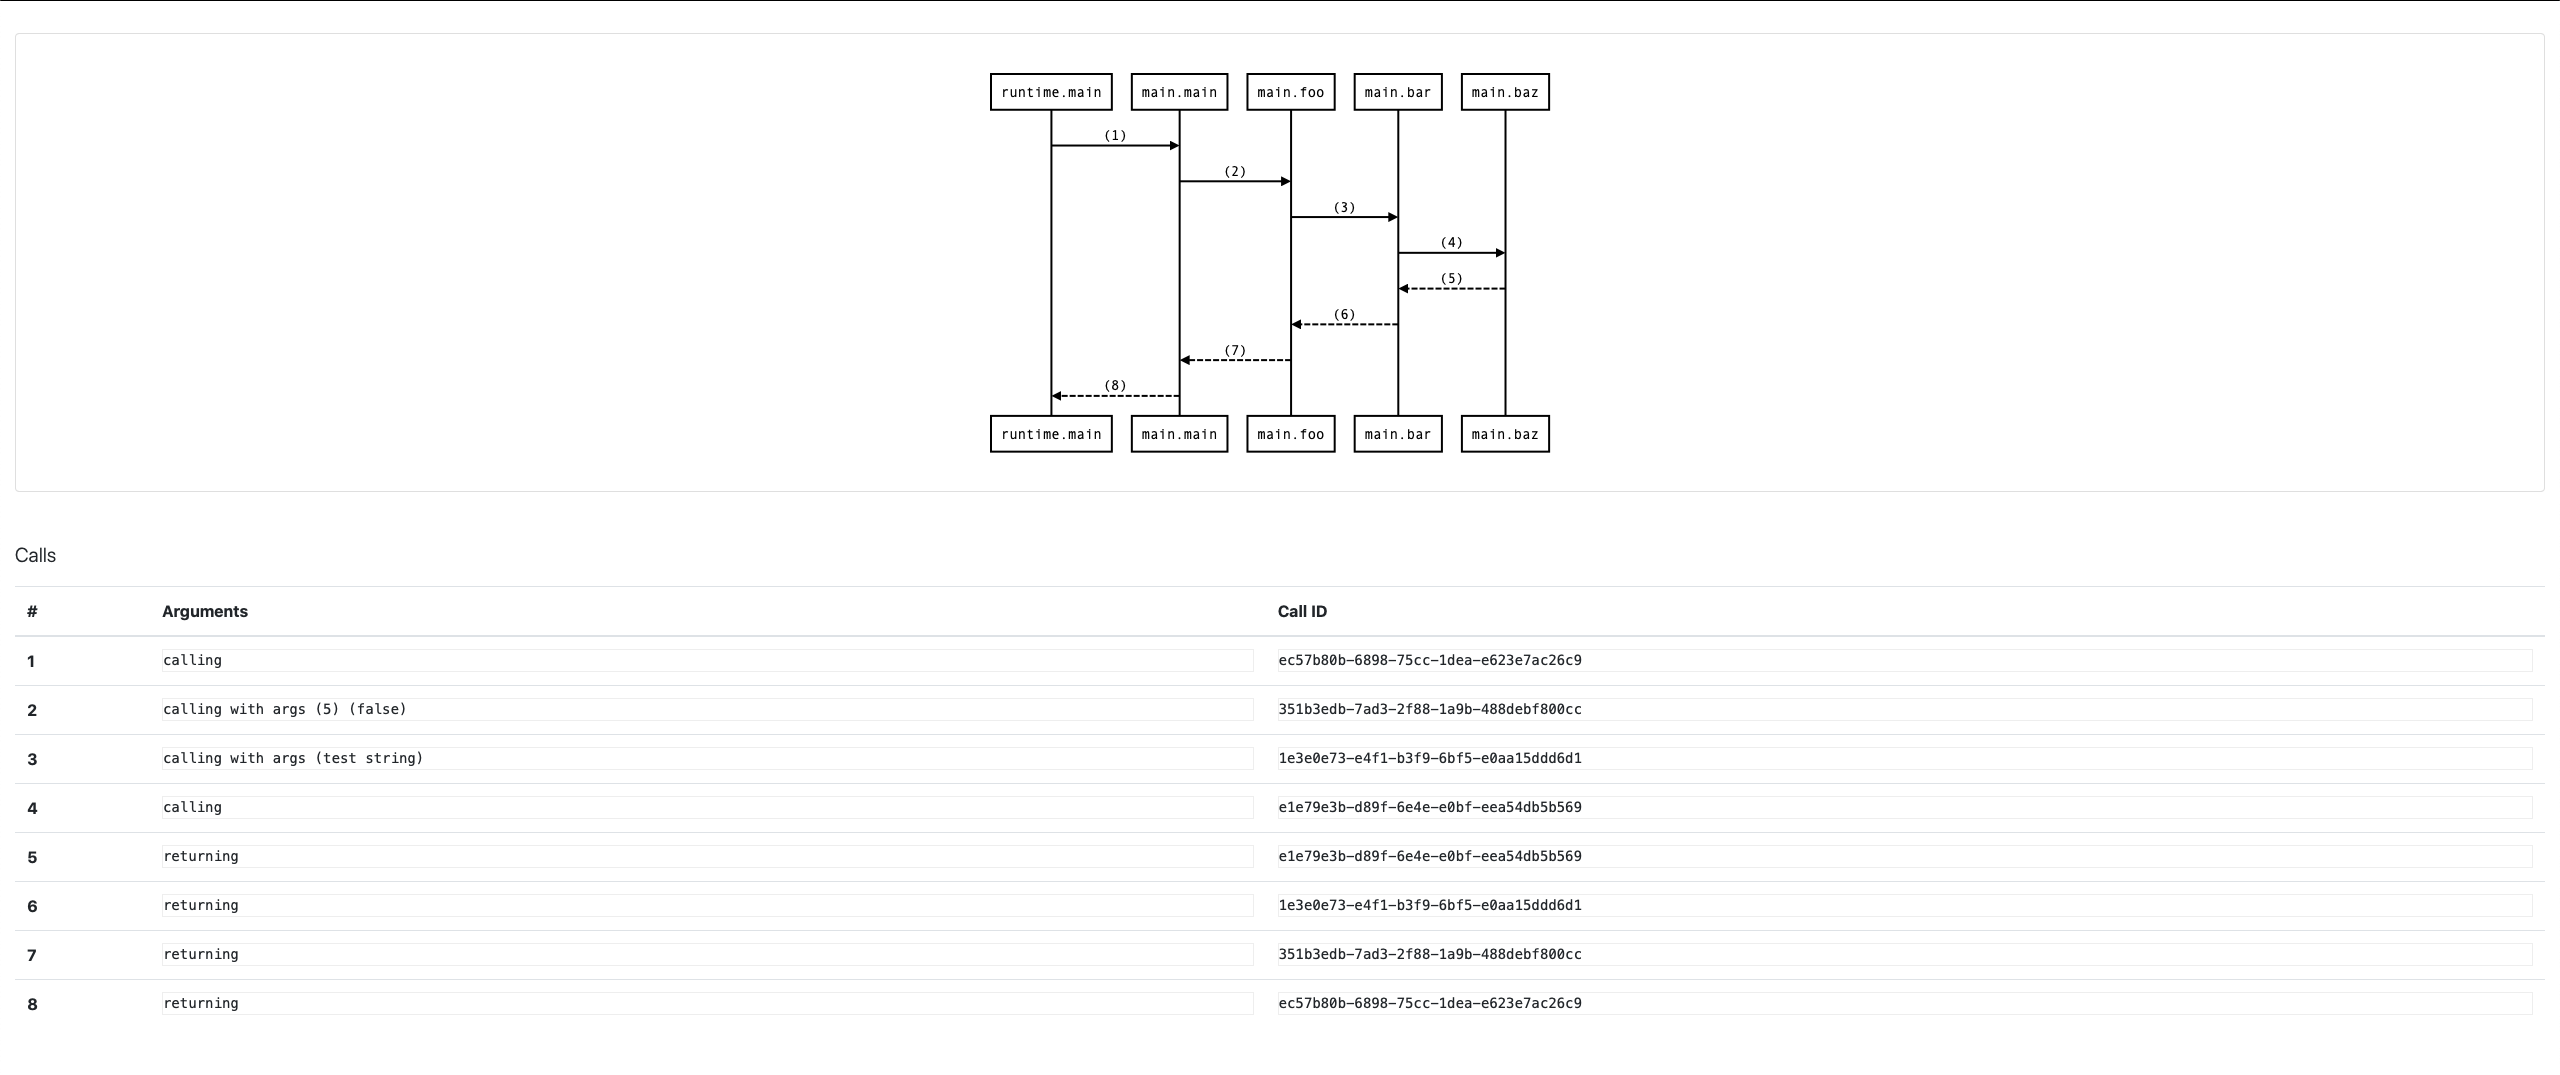
🔎🐛 Golang fmt.Println debugging and tracing tool capable of visualising function invocation paths.
SYSMON65 is a full 2-pass assembler, with local and global labels, directives, and more. A 65C02 disassembler is included which includes Step-By-Step debugging (i.e., Tracing), memory dump, ASCII dump, fill, delete, block move, intel hex loader and more.