d3tutorial
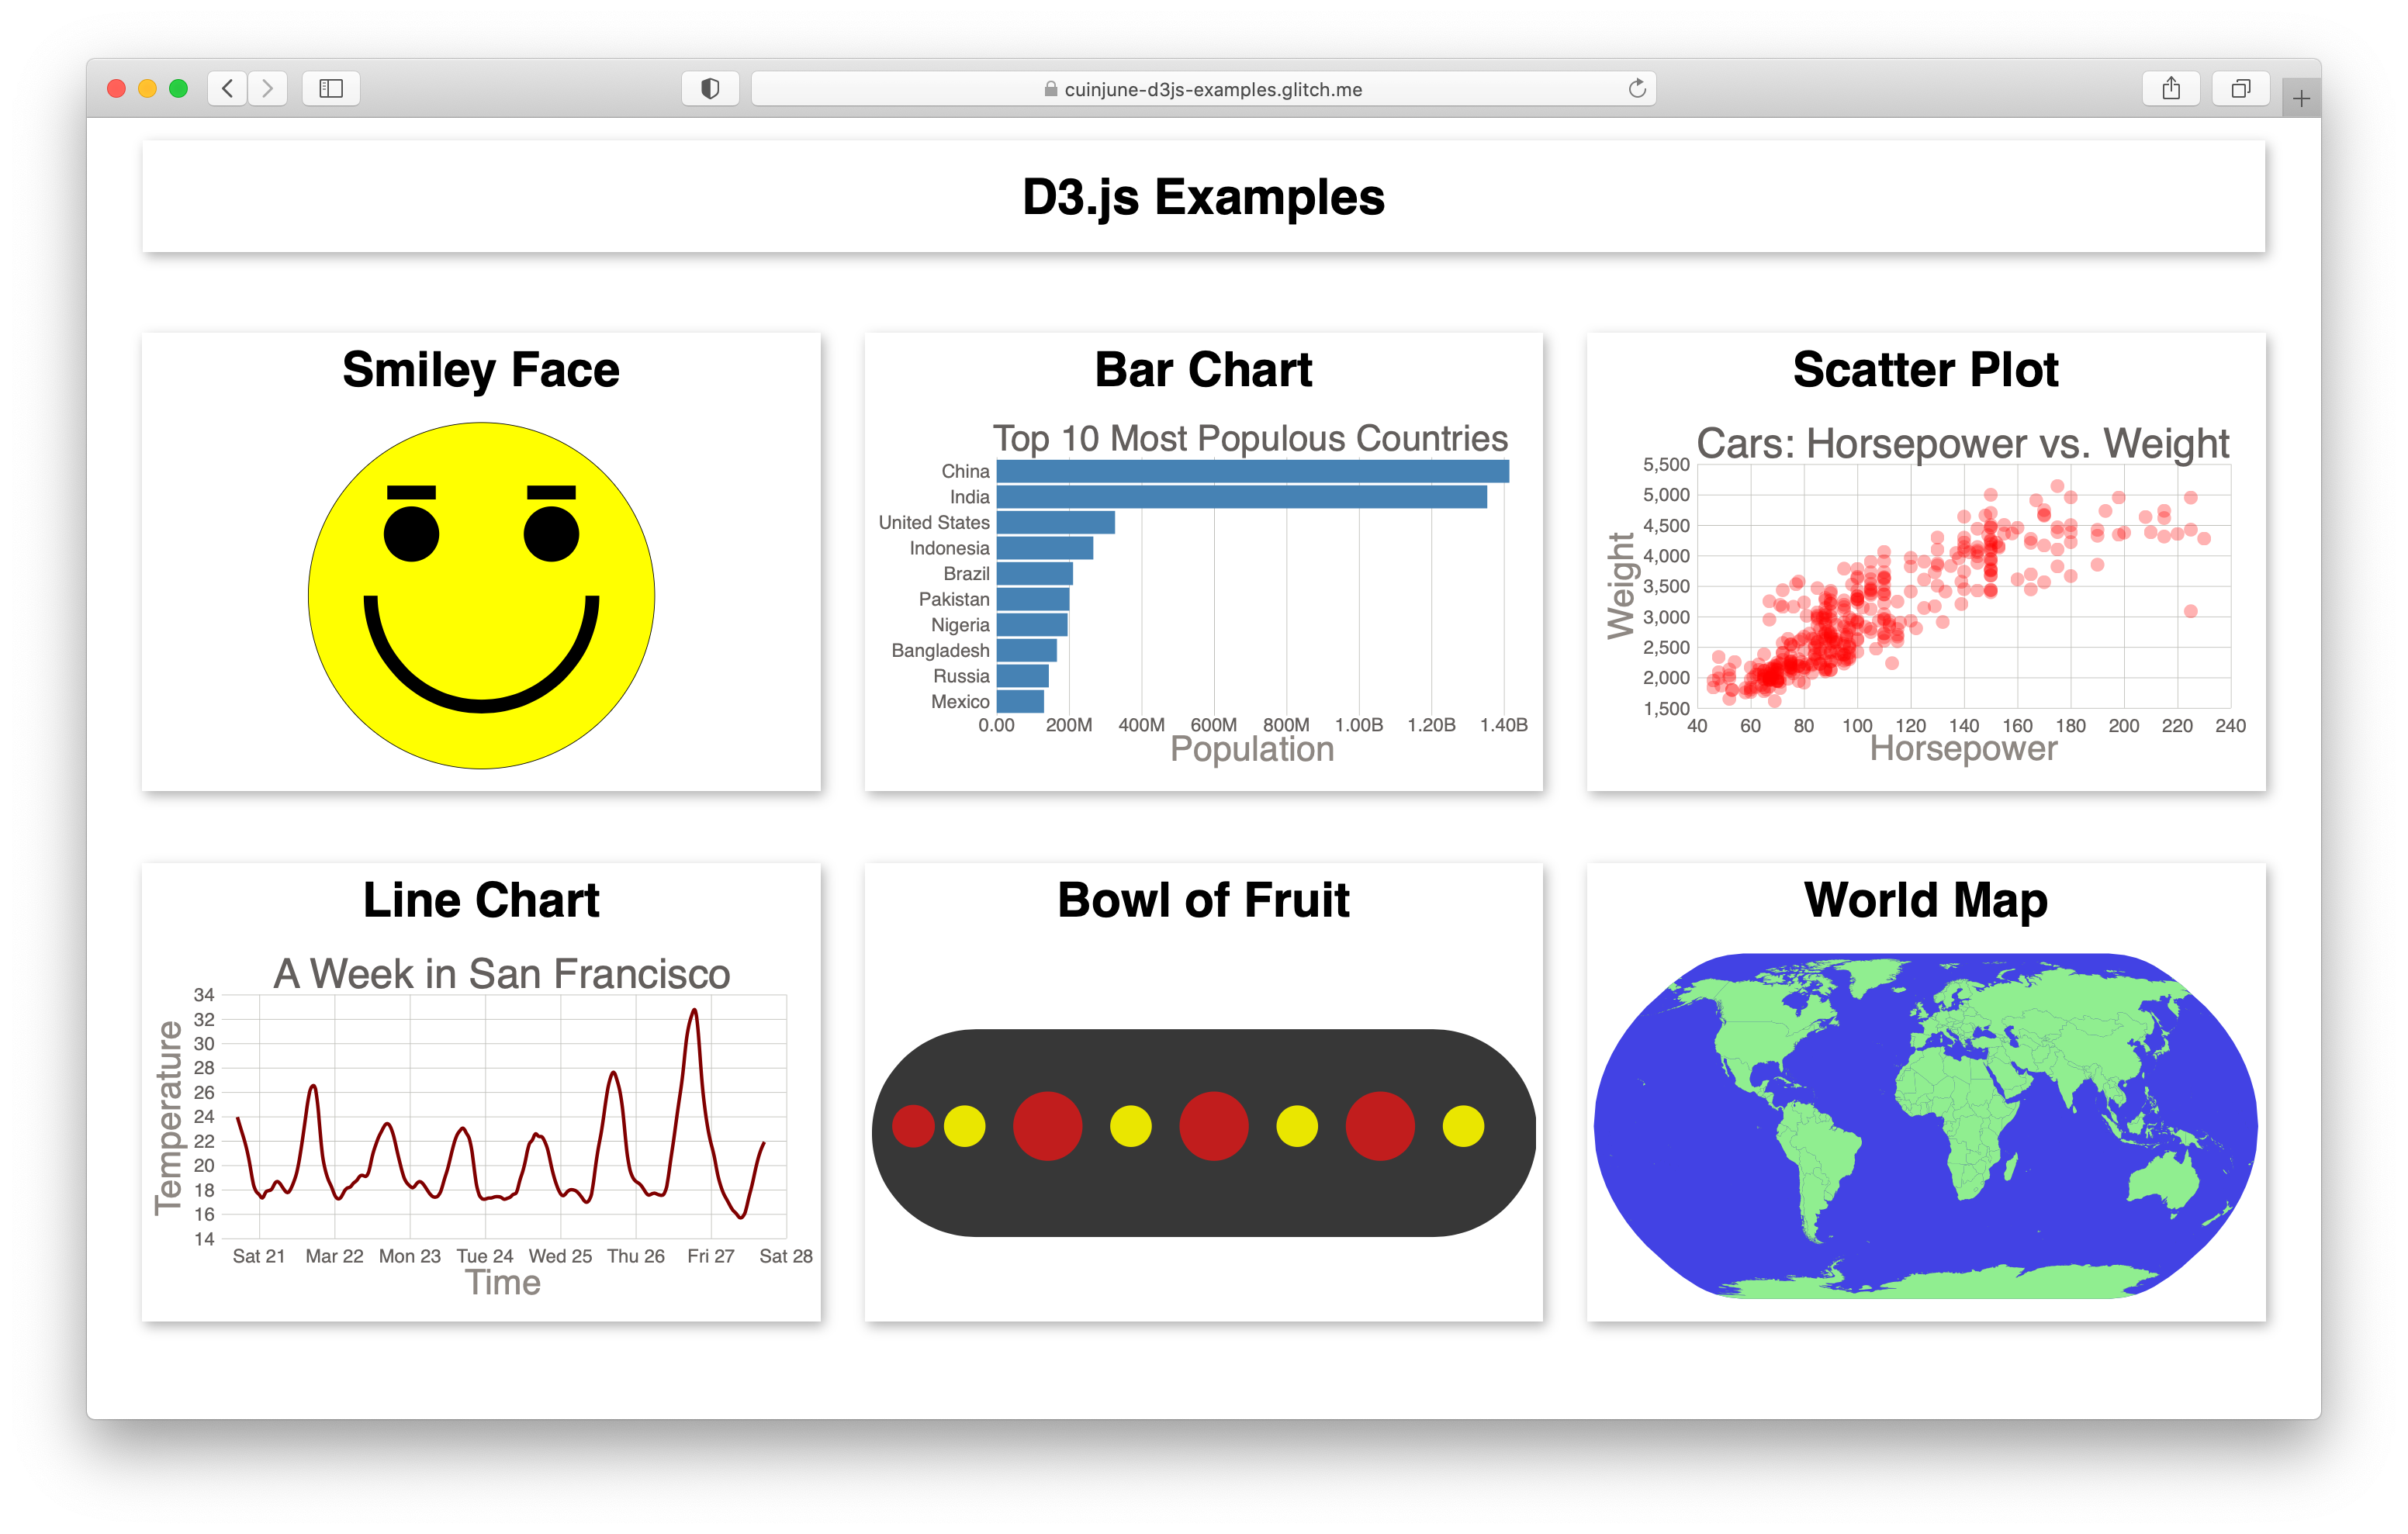
📊📈 A D3 v7 tutorial - interactive bar chart and multiple coordinated views (MCV)
- 255
- HTML
- BSD-3-Clause
- 9 mo ago
📊📈 A D3 v7 tutorial - interactive bar chart and multiple coordinated views (MCV)
D3-Table-Cards: Animated morphing between table and card views built with D3.js.
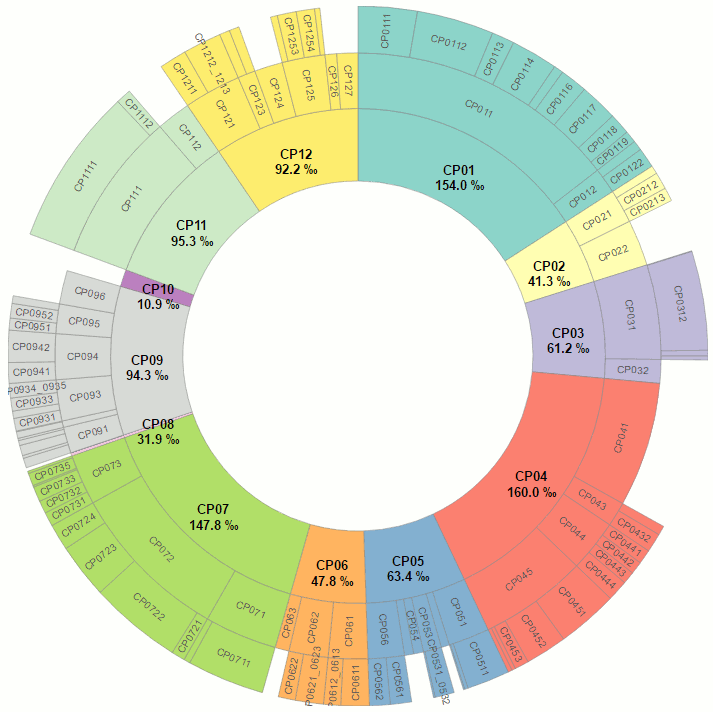
Reusable function to easily create sunburst visualizations based on D3.js
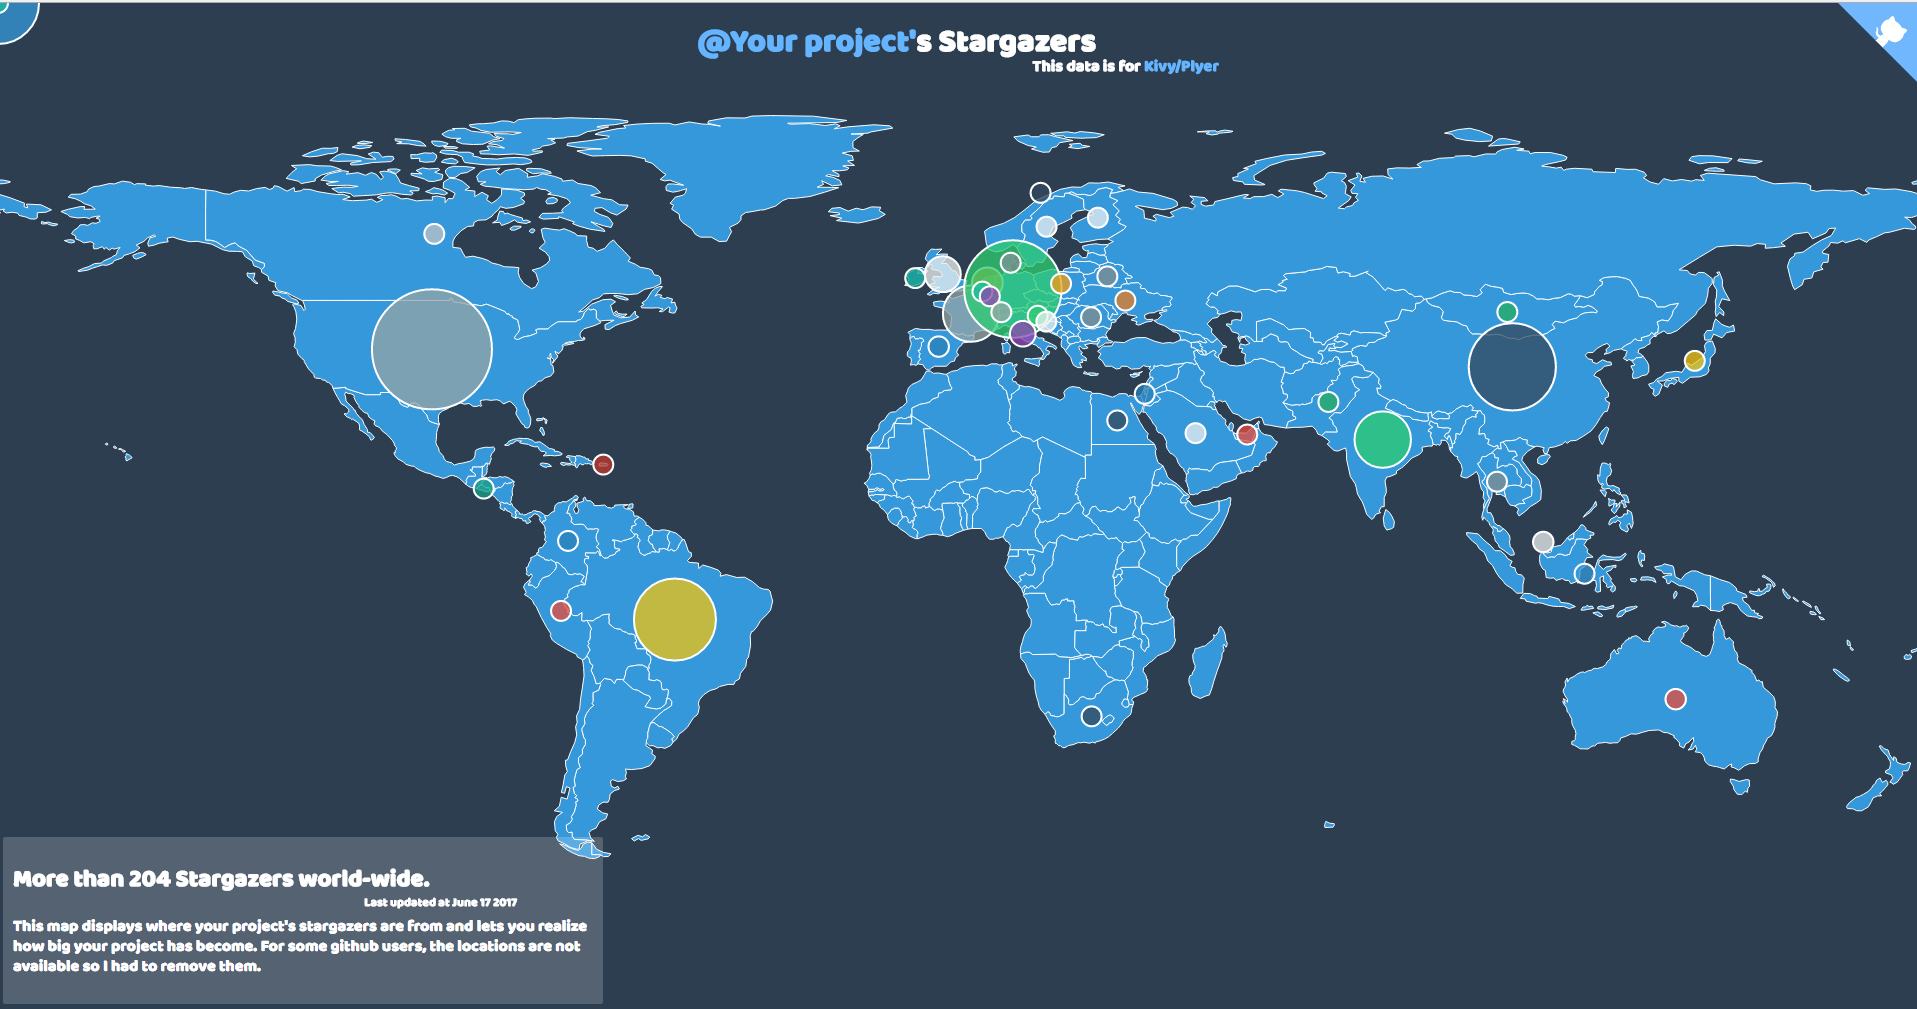
Generate a 3D map of links based on their embeddings using OpenAI's embedding API
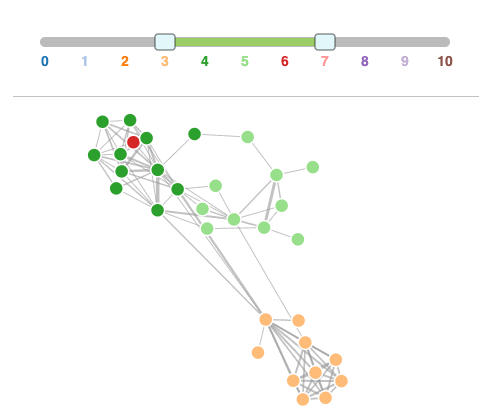
Interactive Merkle Tree Visualizer for Database Replication: Simulate efficient data sync using hash trees in distributed systems. Build trees, compare roots, drill down mismatches, and sync only changes—perfect for learning anti-entropy in DBs like Cassandra or DynamoDB.
AidData's Core Research Release 3.1 is a corrected snapshot of AidData's entire project-level database from April 2016. This database includes commitment information for over 1.5 million development finance activities funded between 1947 and 2013, covers 96 donors, and includes ODA, OOF flows, Equity Investments, and Export Credits where available.
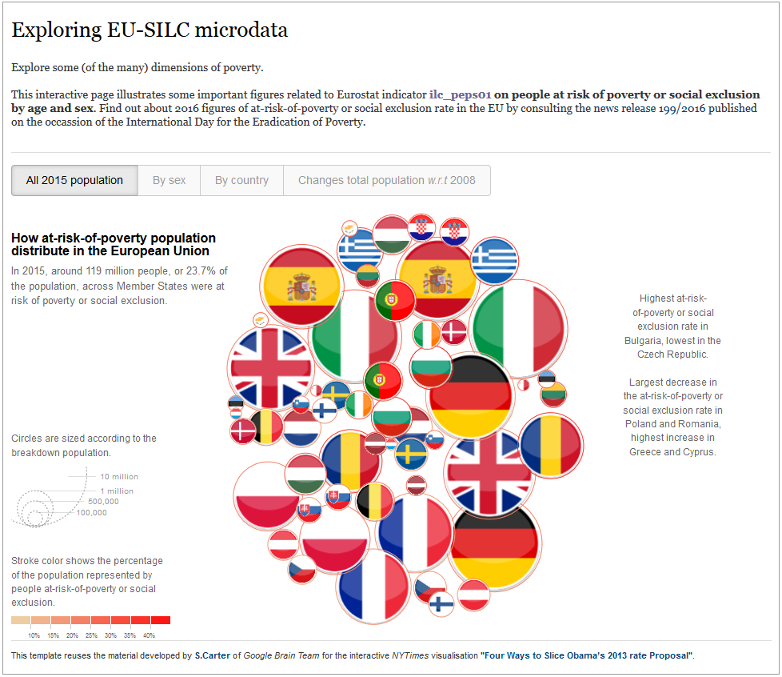
Applying d3 framework for handling and exploring (Javascript/Python) Eurostat data and metadata.
A D3.js choropleth map of the US built in React.js that presents each county's percentage of adults who are college graduates.
A D3.js treemap built in React.js that presents the top 100 sold video games grouped by their associated gaming platform.
A D3.js heat map built in React.js that presents the monthly variance of the global temperature from the years 1753 to 2015.
A D3.js bar chart built in React.js that presents the changes in the US Gross Domestic Product from 1947 to 2015.
A D3.js scatterplot built in React.js that presents the top 35 fastest completions of the Alpe d'Huez and whether or not the associated cyclist has been accused of doping during that period.